1. A Cost-Benefit Approach to Disaster-Induced Migration:
The Study of Hurricane Mitch and its Effects on Honduran and Nicaraguan Emigration
by
Erin Cloninger
A thesis submitted to the
Department of Political Science for honors
Duke University
Durham, North Carolina 2011
Abstract. Policy makers and migration theorist alike have argued that, in general,
natural disasters do not induce significant increases in emigration. Yet in the wake
of Hurricane Mitch in 1998, Honduras and Nicaragua experienced increases in
emigration of 286% and 37% respectively (FOA 2001: 103). What explains this
unusual variation in emigration following a natural disaster? Through a cost-
benefit approach to migration, I hypothesize that differing degrees of (1) disaster
severity, (2) migrant network strength, and/or (3) government capacity in disaster
response may account for some of the variation in post-disaster emigration. I posit
that Honduran migrants may have experienced higher degrees of infrastructural
and economic damage, weaker government capacity, and/or stronger migrant
networks abroad and thus were inspired to emigrate at a rate higher than
Nicaragua. The results lend some support for these hypotheses. Perceptions of
disaster severity were greater in Honduras relative to Nicaragua and the Honduran
public did report lower confidence in government capacity following the storm.
Migrant network strength, on the other hand, appears to influence the direction, but
not the extent of emigration. Most Hondurans living abroad resided in the U.S. as
of 1998 and the majority of post-Mitch migrants did indeed go to the U.S.;
however, Hondurans networks were not stronger in terms of size, density, or
organization in the U.S. relative to those of Nicaragua.
2. Cloninger 2
Acknowledgement
The author would like to thank Dr. Erik Wibbels for his continued guidance and
encouragement throughout the formation of this thesis. It was, without a doubt,
his teaching that inspired me to appreciate the nuance and creativity involved in
social science research. A special thanks to Benjamin Barber who provided
invaluable feedback throughout the writing process, as well as Dr. Peter Feaver
who helped to make the writing of Political Science theses possible this year at
Duke University.
3. Cloninger 3
I. INTRODUCTION
Over the past decade, policy makers and migration theorists alike have postulated that
survivors of a natural disaster are more likely to become internally displaced than to cross an
international border (Ferris 2007; Hugo 2009; Guterres 2009; Laczko and Aghazarm 2009;
Naik et. al 2007; Newman 2010; Reynoso 2010).1
What is remarkable is that this conclusion
is not based on a wealth of empirical data, but rather a lack thereof. According to a report
produced by the International Organization for Migration (IOM), there is little evidence that
regular mass flows of émigrés follow natural disasters (Laczko and Aghazarm 2009), leading
scholars to assume that, in general, it does not occur. However, according to a recent UN
Office for the Coordination for Humanitarian Affairs (OCHA) and IDMC report (2009),
climate change (i.e. natural disasters, desertification, global warming, etc.) accounted for the
internal and external displacement of roughly 36 million people in 2008 compared to the 4.6
million displaced by conflict in that year alone. Clearly, the link between natural events and
population movement does exist, but additional scholarship is needed to explain why human
migratory responses to environmental change vary.
While it may be true that natural disasters generally induce internal rather than
external migration, there are several cases of emigration swells following a natural disaster.
The most notable of these occurred following Hurricane Mitch, a category five storm that
swept through Central America in 1998. According to IOM, Honduras and Nicaragua
experienced marked emigration increases of roughly 286% and 37% respectively (FOA
2001: 103). El Salvador similarly experienced spikes in emigration following two
earthquakes in 2001 and Hurricane Stan in 2005 (Laczko and Aghazarm 2009), as did Sri
1
The UN defines “internally displaced persons” as "persons or groups of persons who have been forced or
obliged to flee or to leave their homes or places of habitual residence, in particular as a result of or in order to
avoid the effects of armed conflict, situations of generalised violence, violations of human rights or natural or
human-made disasters, and who have not crossed an internationally recognised State border” (OCHA 1998).
4. Cloninger 4
Lanka following the Tsunami in 2004 (Naik et. al 2007; Grote 2006; Department of
Immigration and Emigration 2004).2
More recently, Mexican authorities have also reported
significant increases in the number of Haitian immigrants following the January 2010
earthquake (Ugalde 2010).
Scholars are correct, however, that unusual increases in emigration do not follow
every disaster. Significant spikes in emigration did not occur in Indonesia following the 2004
Tsunami (Naik et. al 2007) or in Chile following the magnitude 8.8 earthquake in February
2010 (IOM 2010). The conclusion drawn from these examples is that natural disasters of
similar type and magnitude induce a range of migratory outcomes around the world. What
explains this variation? Why is it that the same tsunami causes a rise in emigration in Sri
Lanka, but not Indonesia? Why does a category five hurricane in Honduras cause significant
emigration, but a high magnitude earthquake in Chile does not? For far too long, scholars
have ignored such questions in the study of migration and displacement following natural
disasters. It is therefore the aim of this paper to advance research in post-disaster migration
and explore the yet unanswered question: Under what conditions do natural disasters induce
unusual variation in external migration?
The international security threat posed by sudden, large-scale, cross-border
migrations is one reason why such a question is pressing. While many migratory flows are
peaceful, migration can lead to violence when disputes arise over resource use, politics,
ethnicity, or territory (as has been the case in Bangladesh, one of the most disaster-prone
nations in the world). One of the most violent migration-induced conflicts in history occurred
between Bengali and Indian citizens in 1983. Between 1951 and 1981, Bengali migrants fled
cyclone and flood-prone regions to settle illegally in the Indian states of Assam and Tripura
2
The Sri Lankan Department of Immigration and Emigration reports a 13% increase in emigration in 2004
compared to an average yearly increase of roughly 9%.
5. Cloninger 5
(Suhrke 1993). The Assamese, fearful of Bengali claims to land, middle class job
opportunities, and political representation, massacred between 3,000 and 5,000 Bengali
immigrants as a result (Suhrke 1993). Similar violent cases also occurred in the 1970s when
Bengali residents took refuge from floods and tropical storms in urban slums. The
government responded by forcefully relocating migrants to the Chittagong Hill Tracts (CHT),
a region occupied by rebellious tribal groups. The move was largely a political maneuver
and, not surprisingly, ignited conflict between migrants and tribal groups in the form of
guerrilla warfare—a conflict that eventually escalated into an international dispute between
India and Bangladesh (Suhrke 1993).
As the Bangladesh case illustrates, there exists an immediate need for scholars to
acknowledge the very real and at times severe effects of environmental and disaster-induced
migration. With the frequency of natural disasters increasing threefold over the past 30 years
(Laczko and Aghazarm 2009) and estimates of disaster-induced displacement in 2008 being
four times that of conflict-induced displacement (OCHA-IDMC 2009), scholars can no
longer ignore the study of population movement in relation to natural disasters. In particular,
greater research is needed on the effects of sudden-onset disasters, including hurricanes,
floods, cyclones, and earthquakes, as much of the literature available has focused on
migration resulting from slow-onset disasters such as drought or desertification (Bilsborrow
et. al 1990; Islam 1992; Surke 1993; Dirks 1980).
While the United Nations High Commission on Refugees (UNHCR) and IOM offer a
laundry list of variables to explain population movement—poverty, the scale of the disaster,
aid response, or the likelihood of recurrence to explain migration (Guterres 2009; Naik et. al
2007)—no scholarship exists which specifically examines why some natural disasters result
in greater cross-border migration than others. This paper seeks to explain such variance by
examining the effect of Hurricane Mitch on Honduran and Nicaraguan emigration. More than
6. Cloninger 6
a decade after the hurricane, scholars have yet to explain why the migratory responses of
Hondurans and Nicaraguans varied drastically in response to this particular hurricane.
Between 1998 and 1999 alone, Honduras experienced an unprecedented spike in emigration
(286%) compared to a notable, but less extreme emigration increase in Nicaraguan (37%)
(FAO 2001: 103). Relying on a cost-benefit approach to migration, I argue that differences in
post-disaster migration between these two nations may have been the result of varying
degrees of disaster severity, government capacity, and migrant network strength that affected
the migratory calculations of the survivors of Hurricane Mitch. Potential Honduran migrants
may have seen higher degrees of infrastructural and economic damage, weaker government
capacity, and/or stronger migrant networks abroad and decided to emigrate at a rate higher
than Nicaragua.
This paper is divided into six sections. Proceeding from the introduction, the second
section gives a brief overview of the current literature of migration and its relationship to
natural disasters, focusing specifically on the evolution and utility of a cost-benefit approach
to migration. The third section then outlines a cost-benefit theory for disaster-induced
displacement, the reasons for selecting disaster severity, migrant network strength, and
government capacity as independent variables, and the hypotheses related to each. In the
fourth section, I cover issues of methodology and case selection, and continue on with an
exploration of Hurricane Mitch in the fifth section. I close with comments regarding the
limitations of this study, as well as an overview of the areas in need of further research and
data collection.
II. MIGRATION & NATURAL DISASTER LITERATURE
Cost-Benefit Migration Theory
7. Cloninger 7
The literature on migration theory dates back to 1885 when E.G. Ravenstein (1885)
approached the Royal Statistical Society of London with a paper entitled The Laws of
Migration. Armed with 1881 British census data, Ravenstein (1885) argued that despite
claims to the contrary, migratory flows follow patterns that are predictable enough to adhere
to an ascribed set of rules. By 1889, he expanded his work to incorporate data on 20
countries and solidified what are now referred to as Ravenstein’s eight fundamental “laws”
of migration (Ravenstein 1889):
1. Most migrants move only a short distance.
2. There is a process of absorption, whereby people immediately surrounding a
rapidly growing town move into it and the gaps they leave are filled by
migrants from more distant areas, and so on until the attractive force [pull
factors] is spent.
3. There is a process of dispersion, which is the inverse of absorption.
4. Each migration flow produces a compensating counter-flow.
5. Long-distance migrants go to one of the great centers of commerce and
industry.
6. Natives of towns are less migratory than those from rural areas.
7. Females are more migratory than males.
8. Economic factors are the main cause of migration.
Since Ravenstein’s seminal addition to the field of migration theory, scholars have
added to his framework with theoretical models (Sjaastad 1962; Wolpert 1965; Lee 1966;
Todaro 1969; Speare 1971; Speare 1974). One such model is the cost-benefit theory of
migration, pioneered by Larry Sjaastad (1962) in the mid-twentieth century. Sjaastad (1962)
hypothesized that an individual will move if the benefits of relocation outweigh the costs of
doing so. His model was quite simple. It consisted of one point of origin for the migrant and
one destination. It did not account for information costs, differences in the cost of living
between the origin and destination point, nor the possibility of extended unemployment upon
arriving in a new place (Speare 1971).
Other cost-benefit models also took shape throughout the 1960s. In 1965, Julian
Wolpert proposed that individuals assess the costs and benefits of migration by comparing
8. Cloninger 8
the “place utility” of staying to the expected utility of moving. Acknowledging that
information is imperfect and not all persons rational, Wolpert (1965) argued that “measured
broadly,” utility can determine one’s level of satisfaction or dissatisfaction with a place to the
point of influencing behavior. Lee (1966) similarly theorized that individuals respond to a set
of push and pull factors at both the place of origin and destination, but added the importance
of “intervening obstacles” to Wolpert’s theory, such as immigration laws or physical barriers
to the migration formula. Lastly, Todaro (1969) applied the cost-benefit model to the study of
rural to urban migration in less developed countries, but corrected what he viewed as flaws in
Sjaastad’s (1962) model. He accounted for unemployment and underemployment in urban
areas and asserted that the decision to migrate was as much a matter of balancing
probabilities and risks as a cost-benefit calculation.
Alden Speare (1971) built upon this work further in the 1970s when he applied an
extended version of Lee’s (1966) and Sajaastad’s (1962) cost-benefit framework to rural-
urban migration in Taiwan. While his model was able to accurately predict the behavior of
75.8% of those who would eventually migrate, and 84.3% of those who would not, Speare
(1971) was struck by the number individuals surveyed who had never considered migration
at all. This discovery led Speare (1974) to produce a paper in which he developed the theory
of “residential satisfaction.” Building off of the work of Wolpert (1965) and Brown and
Moore (1970), Speare (1974) argued that individuals only consider moving once a threshold
of dissatisfaction with their current location has been reached. Only after satisfaction has
been assessed and deemed unacceptable—such as in the wake of a natural disaster—will a
cost-benefit analysis follow to determine the utility of alternative locations.
9. Cloninger 9
Migration and Natural Disasters
As stated previously, the current literature relating to migration following natural
disasters has primarily focused on the prevalence of internal displacement and a lack of
cross-border movement (Paul 2005; Ferris 2007; Hugo 2009; Guterres 2009; Laczko and
Aghazarm 2009; Naik et. al 2007; Newman 2010; Reynoso 2010). One of the most
prominent reports supporting this claim was produced in 2007 by IOM. The report authored
by Naik et. al (2007) provides an overview of how the 2004 tsunami and its effects
influenced migration in Indonesia, Sri Lanka, and Thailand. It concludes that no mass exodus
occurred in tsunami-affect areas, hypothesizing that remittance levels (i.e. funds sent from
migrants abroad) and foreign aid were responsible for peoples’ willingness to move
internally or return home, rather than cross borders. The report does, however, cite
speculative anecdotal evidence of Batam Island patrols refusing entry to Sri Lankan
immigrants. This indicates an acknowledgement by IOM that some cross-border migration
did occur or was attempted, though not “en masse.”
In addition to Naik et al’s (2007) work, individual scholars have also sought to
explain the relationship between disasters and migration through specific case studies. Bimal
Kanti Paul (2005) is frequently cited for his study on the effect of aid on post-disaster
migration in rural Bangladesh. Paul (2005) conducted a series of surveys following a tornado
in 2004 from which he concluded that the sufficient amount and distribution of aid by
government and non-government organizations led Bengali citizens to remain in disaster-
affected areas. Strangely, however, Ulrike Grote (2006) conducted similar surveys in
tsunami-affected areas in Sri Lanka and found the opposite effect. Grote (2006) discovered
that those households expressing intent to migrate were precisely those who received the
most material, financial and psychological aid (with the exception of construction materials,
which encouraged rebuilding in the disaster-affect area). While these studies differ in the fact
10. Cloninger 10
that Paul (2005) measured migratory action and Grote (2006) measured migratory intent,
they nonetheless illustrate the need to isolate and measure the effect of select variables—
disaster aid in this case—on the cost-benefit calculation of migration.
As a result of both the causal ambiguity surrounding post-disaster migration and the
lack of international protection for those displaced by natural disasters, data collection on
disaster-induced displacement is virtually non-existent.3
Both the UNHCR and the Internal
Displacement Monitoring Centre (IDMC) databases monitor conflict-induced displacement
only. Even EM-DAT, the most thorough database on natural disasters, fails to record
displacement figures or distinguish between the internal vs. cross-border migration that may
result. Founded in 1988 by the Center for Research on the Epidemiology of Disasters
(CRED), the EM-DAT database is most useful in determining the amount of US$ damage
caused by natural disasters, the total number of persons killed, and the total number affected.
Thankfully, the past two years have seen migration scholars and international
institutions alike taking note of the substantial statistical gap related to disaster-induced
displacement. So far, only one report has sought to quantify the number of persons displaced
as a result of environmental change, which includes both natural disasters and the effects of
global warming, in a given year. Produced by the UN Office for the Coordination for
Humanitarian Affairs (OCHA) and IDMC, this report (2009) estimates that climate change
displaced 36 million people in 2008 compared to 4.6 million persons displaced by conflict in
the same period. The methodology used to produce these estimates involved systematic
cross-referencing of EM-DAT data with numerous other databases and secondary sources.
Due to the exhaustive nature of the OCHA-IDMC project and the lack of readily available
3
One reason for this is that the 1951 UN Refugee Convention defines “refugee” as anyone crossing a border
“owing to a well-founded fear of being persecuted for reasons of race, religion, nationality, membership of a
particular social group or political opinion” (UNHCR 1951; Guterres 2009). Persons displaced by
environmental change are not considered “refugees” and therefore fall outside the jurisdiction of the UNHCR.
Consequently, data on environmental displaced persons (EDPs) is not gathered like that of internally displaced
persons (IDPs) and refugees fleeing conflict because there is no legal incentive to do so.
11. Cloninger 11
data, conducting a large-n study of post-disaster migration is not currently feasible. Thus, in-
depth case studies will form the empirical basis of this paper.
III. THEORY AND HYPOTHESES
The theoretical foundation for this paper is based on the cost-benefit theory of
migration, as propounded by Sjaastad (1962), Wolpert (1965), Lee (1966), Todaro (1969),
and Speare (1971, 1974). The basic premise of cost-benefit theory is that individuals will
migrate when they can and when it is in their best interest to do so. In other words, potential
migrants determine the expected utility of migration [E(UM)] by first calculating whether they
have the current resources [C(R)] sufficient to cover the expected costs [E(C)] of migrating.
A potential migrant must, for instance, have the financial resources required to cover the cost
of a plane ticket, border crossing, etc. Next, they compare this calculation to the expected
benefits [E(B)] of internal or external migration, which in the case of natural disasters are
typically improvements in income and/or safety. If the calculation is positive, migration
occurs. If it is negative, the potential migrant does not migrate. The equation can be
summarized as follows:
E(UM) = E(B) – [E(C) – C(R)]
It could be argued that the cost-benefit calculation described above is too simplistic to
explain migration in the context of natural disasters, which are by their nature complex. On
the contrary, the cost-benefit theory of migration is suited to the study of post-disaster
migration precisely because of its simplicity. The factors influencing the decision-making
processes of potential émigrés are largely the same, save the introduction of (1) damage
caused by an external event, the natural disaster in this case, and (2) the influx of aid. These
two factors may indirectly affect other variables within the cost-benefit framework, such as
per capita income or travel costs, but the process of weighing costs and benefits is
12. Cloninger 12
nonetheless parallel to that of any potential migrant outside of a disaster scenario. Thus, the
cost-benefit framework should hold within the context of post-disaster migration decision-
making.
It is thus assumed that in the wake of a natural disaster, potential migrants continue to
act rationally and respond to, at minimum, three basic calculations regarding costs, benefits,
and resources. Each of these calculations is influenced by numerous factors. For example, the
expected costs of migration are affected by variables such as the cost of travel, border
crossing, and information. Similarly, factors such as an anticipated rise in income play a
large part in increases the expected benefits of crossing an international border. Whereas
migration theorists have studied the effect of many of these variables on general migration,
three under-studied factors are also integral to the cost-benefit calculation of disaster-induced
migration. These include (1) the natural and economic severity of a natural disaster, (2) the
government capacity to prevent and respond to the disaster, which includes its administration
of international aid, and (3) the strength of migrant networks between disaster-affected
regions and migrant-receiving countries. I hypothesize that variance in these three variables
may explain the observed differences in migratory behavior following natural disasters.
Severity
One reason for the variation in post-disaster migration may be differences in the
severity of a natural disaster. From the perspective of a potential migrant, greater severity
may result in a longer real and/or perceived recovery timeline, which may in turn increase the
benefits of leaving the country relative to remaining internally displaced. “Severity” may be
quantified in a number of ways. A disaster may be measured in terms of its effect on a
population: the number killed, displaced, or generally affected. It may be measured in terms
of geophysical, meteorological, or hydrological scale: hurricane category, tsunami wave
13. Cloninger 13
height, or Richter scale magnitude. It may also be expressed in terms of economic damage:
absolute dollar amount or damage as percent GDP. IOM relies on this third measurement of
economic severity to explain why migration out of Sri Lanka and Indonesia varied following
the 2004 Tsunami (Naik et. al 2007). According to IOM, increases in emigration were greater
in Sri Lanka compared to Indonesia due to the fact that, relative to GDP, severity was
greater: 6% vs. 2% (EM-DAT 2004; World Bank 2004).
Migrant Networks
Alternatively, variance in post-disaster migration may result from differing degrees of
migrant network strength, which may be measured in terms of the size, concentration, and
organization of migrant populations residing in a foreign country. Migrant networks are
integral to the cost-benefit calculation of migration because they work to lower the costs
associated with relocation (e.g. housing, employment, information, etc.). Often migration
variation occurs despite the fact that donor nations open their borders to survivors from
multiple countries affected by the same disaster. This occurred in in 2004 when Canada and
Australia offered lenient immigration standards to both Indonesians and Sri Lankans
following the tsunami (Lackso and Collett 2005), as well as 1998 when the US offered
Nicaraguans and Hondurans temporary protective status (TPS) following Hurricane Mitch
(US Citizenship and Immigration Services 2010). Interestingly, the size of immigrant waves
varied for each of these countries, despite the fact that the nations incurred similar amounts
of economic damage relative to long-term GDP growth. I hypothesize that such variation
may be due to stronger migrant networks in some countries, as opposed to others, a factor
that would have served to lower the cost of resettlement in terms of time and money for
certain groups.
14. Cloninger 14
This hypothesis fits neatly with the work of scholars like Douglas Massey (1987;
1990; 2001) who argues that migrant networks lower the overall cost of migration. For
Massey, migrant networks are “sets of interpersonal ties that connect migrants, former
migrants, and nonmigrants to one another through relations of kinship, friendship, and shared
community origin” (Massey et. al 1990). In both his co-authored book Return to Aztlan (et al.
1987) and later study of US-Mexico migration (et. al 1990), Massey refers to migrant
networks as a form of social capital. “Interpersonal ties,” he argues, decrease the cost and
increase the potential benefits of migration, thereby increasingly the likelihood that an
individual will move.
Other scholars have also recounted the ways in which networks affect the cost-benefit
calculation of migration. Curran (2003) summarizes these effects in her paper on gender and
Mexican migration. She states that migrant networks work to reduce costs by increasing
information flows, reducing travel costs, reducing emotional costs, easing assimilation
(Choldin 1973), lowering the chance of deportation (Massey 1990), increasing the probably
of employment, reducing living expenses, and providing financial assistance to immigrants
(Curran 2003: 290). Her own quantitative findings support these claims, as she found that
both men and women in Mexico were 2.4 times more likely to migrate when connected to
strong migrant networks in the US (Curran 2003: 300). These results parallel those of
Massey (et. al 2001: 1295) who observed that Mexicans are three times as likely to migrate if
an older sibling had migrated previously.
The fact that migrant networks increase the likelihood of migration is therefore
widely known within the intellectual community; however, there appears to be little or no
scholarship on the direct effect of migrant networks on post-disaster migration specifically.
Nonetheless, it is logical to assume that the relevance of migrant networks extends to the
context of a natural disaster. If anything, times of crisis strengthen ties abroad, as
15. Cloninger 15
demonstrated by the enormous inflow of remittances that typically follow natural disasters
(Laczko and Aghazarm 2009). It is therefore plausible that differences in international
networks explain variance in cross-border migration: populations with strong ties to
receiving countries experience larger emigrant out-flows and those with weaker ties
experiences less.
Government Capacity
A third hypothesis posits that, in addition to a basic calculation of economic damage
or a lower of migration costs via migrant networks, the perceived and/or real capacity of the
government to respond to a disaster may result in significant variation in post-disaster
migration. The importance of government capacity lies in its effect on a population’s
perceived recovery timeline. When a government responds and rebuilds quickly following a
natural disaster (e.g. deploying helicopters and rescue teams readily, effectively removing
rubble, treating the wounded, etc.), those affected by the disaster are less likely to lose faith
in their government and emigrate. In contrast, a slow or ineffective government response
may reduce public confidence in the state, consequently increasing the expected benefits of
external relocation and spurring post-disaster emigration.
While the relationship between government capacity and migration is not widely
discussed in current migration literature, such a connection follows studies documenting the
relationship between government disaster response and other forms of individual behavior,
such as voting. In their study of mayoral elections, for example, Arceneaux and Stein (2006)
examine the attribution of responsibility for Tropical Storm Allison in the local 2001
elections for Houston, TX. They found that citizens were more likely to blame the
government for the natural disaster if they (1) had limited knowledge about politics and/or
(2) were severely affected by the disaster itself. These individuals were more likely to vote
16. Cloninger 16
against the incumbent mayor, using their vote as an expression of dissatisfaction in the
government’s ability to prevent or respond to severe flooding. In states where democratic
institutions are not fully functioning, as is the case in many nations hard-hit by disasters, it is
possible that migration is similarly a “vote” against low government capacity.
Many studies have also provided helpful definitions for what constitutes an
“effective” government response to a natural disaster. Scholars such as Torry (1978) and
Quarantelli (1997) define government capacity in objective terms. For them, capable
governments are as those that embrace historically “successful” bureaucratic norms of
disaster response: overall coordination, the division of labor and tasks, and a decentralized
command structure. In the context of migratory responses to disaster, however, subjective
measures of government capacity are often equally, if not more, important. As Schneider
(1992: 143) states in her study of US disaster response: “success or failure in disaster
recovery is almost entirely a matter of public perception rather than objective reality.” When
considering whether or not to migrate, cost-benefit calculations may therefore be affected by
perceptions of government capacity to respond to a disaster, which are often shaped by the
media (Burgess 2002), rumors (Schneider 1992), and personal experience (Schneider 1992).
Perceptions of state capacity are particularly important for this study, which rests upon a
cost-benefit formula for individual decision-making. Such a model assumes that people will
make a migratory decision based upon what they personally see, experience, or believe to be
true in a post-disaster context.
IV. METHODOLOGY
In order to examine the relative explanatory power of (1) severity, (2) migrant
network strength, and (3) government capacity on disaster-induced emigration, this paper
will explore the cases of Nicaragua and Honduras in the wake of Hurricane Mitch in 1998. In
17. Cloninger 17
selecting these two countries, a myriad of confounding variables have been controlled for,
including disaster type, distance to receiving countries, travel costs, barriers to border
crossing, and aid response. The fact that both countries experienced the same disaster and
subsequent flooding/landslides meant that the types of rescue and recovery processes were
similar in both countries. The relative proximity of Honduras and Nicaragua meant that
distance to receiving countries, mode of transportation, and even migrant route were more or
less equivalent. In terms of the policies of receiving countries, the United States offered
temporary protected status (TPS) to citizens from both nations, thereby eliminating the
possibility of disproportionate legal incentives for migration. Neighboring Central American
countries also lowered immigration standards for both Hondurans and Nicaraguans. Even
aid, which totaled $2.8 billion, was promised to Nicaragua and Honduras in the same
package under the same conditions (Stockholm Declaration 1999).
In terms of the economic and political differences between Honduras and Nicaragua
before Mitch, they were slight and a matter of degree, not kind. Compared to Honduras,
Nicaragua was slightly poorer, slightly behind in terms of yearly GDP growth, and slightly
more corrupt. Poverty and debt weighed heavily upon both nations throughout the 1990’s,
but economic growth was nonetheless steady and positive for each. The nations respectively
stood as the second and fourth poorest nations in Latin America with an estimated 67%
percent of the population believed to be living below the poverty line in both nations
(USAID 1998; ECLAC 1999).4
Nicaragua carried the highest per capita debt in the world in
1997, totaling approximately $1,300 per person, and struggled to fulfill the requirements of
the Heavily Indebted Poor Countries (HIPC) initiative (Burdsal 1998). Regardless, it was in
4
World Bank estimates suggest the percent of the population living below the poverty in Honduras was 53% in
1999 and 48% for Nicaragua in 1998. Statistics are not provided for other years. While these estimates are
noticeably lower than those by USAID and ECLAC, they nonetheless illustrate the narrow gap in poverty levels
between the two countries.
18. Cloninger 18
its third year of solid economic growth when Hurricane Mitch struck, and Honduras was on a
similar upward trajectory, albeit at a much greater pace. Where GDP growth in Nicaragua
averaged 4% per year from 1995-1997, Honduras experienced an average yearly growth rate
of 11% during the same period (World Bank 1997).
Honduras and Nicaragua were also fairly similar with regards to governance. Both
were known to have significant levels of corruption with survey data suggesting only slightly
higher levels in Nicaragua: approximately 7% of Nicaraguans and 6% of Hondurans
surveyed reported experiences with police bribery (Seligson 2001: 24). By 1998, the
Government of Honduras (GOH) had successfully completed four open, peaceful elections
since the transition from military to civilian control in 1981 and had made the
demilitarization of the state a national priority. Key 1990’s reforms included the slow
reformation of the judicial system beginning in 1993, the suspension of the military draft in
1995, and the official transition to civilian control of the national police in May of 1998. In
addition to demilitarization, poverty reduction was also a cornerstone of GOH reform with
the state dedicating over 30% of its federal budget to social services beginning in 1991
(USAID 1998). Many of these services were carried out at the municipal level in an attempt
to further the slow and at times failing efforts to decentralize the state. Issues involving
decentralization would later become a point of contention in Honduras’ recovery.
Poverty reduction and neoliberal reform were also key concerns for the Government
of Nicaragua (GON). When Mitch struck, Nicaragua was in its eighth year of transition from
a war-torn, dictatorial, and economically closed state to a more democratic and market-
oriented nation. In keeping with the requirements of the HIPC initiative, GON had begun the
process of drafting a poverty reduction strategy and improving transparency, though
corruption continued to prevail at the municipal and central level (Seligson 1999).
Approximately 75.8% of the surveyed population reported experiences with bribery in 1996
19. Cloninger 19
(Seligson 1999: 13). Nonetheless, USAID budgetary reports (1998) presented to the U.S.
Congress months before the hurricane indicate that the political and economic situation in
Nicaragua was slowly improving in the post-Sandinista and pre-Mitch era.
It should be noted, however, that the same USAID reports (1998) issue a warning.
They state that, despite some positive gains over the last decade, issues concerning
government capacity and the country’s precarious economic growth left Nicaragua in a state
of political and economic vulnerability as of early 1998. The report (USAID 1998) states,
“The progress achieved has yet to reach a sustainable level sufficient to withstand external
shocks or deliver widespread benefits.” The same report also emphasizes the need for
continued decentralization, but expresses concern over the feasibility of such reforms with
the four branches of the GON being “not coequal in power, capabilities, and accountability”
(USAID 1998). These statements made just months before Hurricane Mitch provide a
snapshot of pre-Mitch impressions of state capacity in Nicaragua. They also provide a useful
starting point from which to explore whether Nicaragua was capable of doing what USAID
said it could not, namely (1) withstand an “external shock” (e.g. a natural disaster) and (2)
coordinate a state whose power, capability, and accountability were called into question even
before Mitch.
IV. HURRICANE MITCH 1998: HONDURAS AND NICARAGUA
Hurricane Mitch struck the coast of Honduras on the morning of October 29, 1998,
leaving in its wake an unfathomable degree of economic and demographic devastation. In a
period of three days, Mitch destroyed over 70% of Honduras’ agricultural production and
over 57% of the Nicaraguan bean crop, a staple food in the region (Sergio 1998). Severe
wind and rainfall washed away bridges, roads, and telecommunication and created conditions
conducive to landslides large enough to bury entire villages. The result was the displacement
20. Cloninger 20
of approximately 1.5 million Hondurans and 368,000 Nicaraguans (EM-DAT 1998, World
Bank 1998) and a stage set for what would become the largest post-disaster migration in
modern history.
Almost immediately, fear that Mitch would spark uncontrollable emigration from
disaster-torn areas spread through government circles in the United States and Central
America (an ironic reaction, considering that scholars generally agree such migration rarely
occurs). Former President George Bush warned journalists that, should the White House fail
to deliver aid quickly, “people are going to find a way…[of] moving themselves and their
families across borders” (AFP 1998). Mexican President Ernesto Zedillo expressed similar
anxiety, sending 150 agents to the 650-mile border separating Mexico from Guatemala and
Belize in December (Migration News 1998). Even USAID Administrator Brian Atwood and
State Department Counselor Windy Sherman began framing the need to rebuild in terms of
the migratory threat it posed. “We don’t want to see desperate and poor people on the move
because it’s a factor that creates instability,” Atwater told reporters in November, “We need
to give them hope and a place to live” (Green 1998).
Worries concerning mass emigration were, in the end, warranted. Central Americans
began pouring across the border almost immediately following Mitch. In December of 1998,
Mexican officials reported apprehending 5,800 immigrants on its southern border, almost
twice as many as the December before (Migration News Feb 1999). The number of Central
Americans apprehended at the U.S.-Mexico border between October and December totaled
6,064—a figure 38.6% times higher than the same period in 1997 (Migration News March
1999). These alarming rates were the impetus for the preparatory measures taken by the INS.
Beginning in January, INS established the Enhanced Border Operational Program, which
included the construction of 10 centers capable of housing as many as 5,000 immigrants each
(Migration News 1999). The hope was that these facilities would house an anticipated wave
21. Cloninger 21
of 600,000 migrants believed to be on their way to the U.S. by the end of 1999 (Sandoval
1999).5
According to official Honduran and Nicaraguan figures, the total number of migrants
would far exceed that amount: over one million Hondurans and 450,000 Nicaraguans would
eventually emigrate within the first year of reconstruction (FOA 2001: 103).
These figures beg the question of why, given the numerous similarities in size, per
capita GDP, location, etc., emigration rates varied so drastically between Honduras and
Nicaragua in the wake of Hurricane Mitch. Media reports have argued that Honduran
emigration was unusually high due to miscommunication regarding the guidelines of
temporary protective status (TPS), which the United States offered to both Hondurans and
Nicaraguans illegally residing in the U.S. as of December 30, 1998. One news article
(Siskind 1998) states, “The cause for the mass exodus is apparently the impression the
migrants have of U.S. immigration policies toward them. Many people interpreted the
Temporary Protected Status granted the people of the region already in U.S. at the end of
1998 to extend to people arriving afterwards.” Migration News (Feb 1999) also cites cases in
which Hondurans arrived to the United State with recommendation letters from priests and
local mayors attesting their good character, work ethic, and destitution as a result of Mitch.
Reports such as these, however, are relatively rare and scholars, governments, and NGOs do
not cite TPS confusion as a primary cause for post-Mitch migration in either Honduras or
Nicaragua. Thus, other variables, such as disaster severity, migrant network strength, and
government capacity tested here, may account for unexplained variation.
5
USIA also commissioned the Gallup Poll of Costa Rica to conduct surveys concerning migration. Gallup
conducted in-person interviews with 1,000 adults from each of the four countries: Honduras, Nicaragua,
Guatemala, and El Salvador. Those interviewed reported that as many as 106,000 Hondurans (3.5% of the adult
population) and 79,000 Nicaraguans had emigrated by May 1999 (Sandoval 1999).
22. Cloninger 22
Disaster Severity
Given the unprecedented devastation Hurricane Mitch wreaked upon Central America
in October 1998, it is tempting to point to basic differences in disaster severity to explain the
variation in post-disaster migration in Honduras and Nicaragua. Media outlets and NGO
reports alike paint a picture of a decimated Honduran economy, storm-torn landscape, and
struggling displaced internal population, all the while offering reports of more manageable
damage and a fast transition from relief to reconstruction in Nicaragua.6
Taken alone, these
reports make differences in post-disaster Honduran vs. Nicaragua emigration seem
understandable, if not expected. The eye of Hurricane Mitch never crossed the northern
6
USAID reports issues on Oct. 28 state, “Honduras continues to suffer the brunt of the storm.” In reference to
Nicaragua, the same report states that “Mitch caused serious flooding along the coast of Nicaragua” but
“USAID/OFDA does not anticipate receiving requests for assistance” (USAID 1998a).
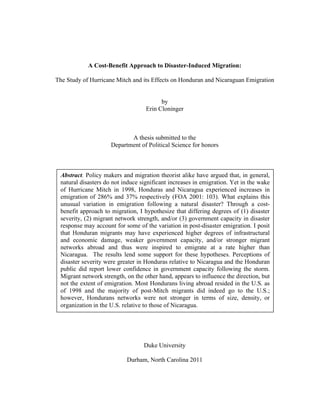
Figure 1
23. Cloninger 23
border of Nicaragua and reports indicate the occurrence of severe flooding, but little
significant wind damage. The following question therefore remains: Is it reasonable, given
differences in the severity of Mitch itself and the damages incurred, for Honduras to
experience a 286% increase in emigration between 1997 and 1999 and Nicaragua an increase
of 37% (see Figure 2) (FOA 2001: 103)? An assessment of the varying measures of
“severity” following Mitch yields an interesting observation. In terms of real severity (i.e.
GDP damage, infrastructural loss, etc.), the link between severity and migration appears to be
weak. In terms of perceived severity (i.e. perceptions of the economic future), the correlation
appears to be much stronger.
In absolute terms, it is true that Honduras was affected more by the storm. The
damage resulting from Mitch totaled 73% of Honduras’ 1998 GDP, whereas damage as
percent GDP in Nicaragua totaled 28%; the storm affected approximately 20% of the
population in Honduras, whereas as it affected 15% of the population in Nicaragua; and 14%
of Hondurans were reportedly displaced as a result, whereas only 6% of Nicaraguans were
Figure 2
24. Cloninger 24
rendered temporarily or permanently homeless following Mitch (EM-DAT 1998; World
Bank 1998). What is puzzling, however, is that while these indicators are all markedly higher
in Honduras—the number of people “affected” and “displaced,” for instance, was double and
even triple that of Nicaragua—the percent increase in Honduran emigration from one year
prior to one year post Mitch is nearly seven times that of Nicaragua. This means that where
differences in severity stood at a ratio of 3:1 at most, the ratio of percent increases in
migration stood at 7:1. While there might be some under-theorized non-linear relationship
between the severity and migration, the reason for why this discrepancy arises is unclear.
Thus, it is possible that some other factor(s) was/were at play in generating the significant
variation in post-Mitch migration, a hypothesis strengthened by the observation that the
percent increase in emigration for Honduras and Nicaragua was nearly identical in the year
leading up to Mitch: 25% and 28% respectively (see Figure 2) (FOA 2001: 103).
This skewed migratory response relative to disaster severity suggests that some other
factor(s) may have been at play in generating the unusually high post-Mitch migration from
Honduras. Such a theory seems even more likely when considered alongside municipal level
data indicating a weak correlation between disaster severity and external migration overall.
With regard to Nicaragua, Edward Funkhouser (2006: 8) uses 1998 and 2001 Living
Standard Measurement Survey data to conclude “there is not strong evidence that areas most
affected by the hurricane were associated with larger out-migrations following 1998, at least
at the level of the Department.” In his study of migrant households, Funkhouser (2006)
instead suggests that the factors of age, sex, and urban/rural origin were better predictors of
post-Mitch movement than residence in a hurricane-affected area. Irrespective of hurricane
experience, post-Mitch migrants tended to be young, urban, and male.
Likewise, the relationship between severity and migration does not appear to be
remarkably strong at the municipal level in Honduras. The two regions with the highest
25. Cloninger 25
number of persons affected by the storm include the southern department of Choluteca
(94,013) and the northern department of Yoro (89,662) (UNDP 1998). However, Honduran
census data gathered in 2001 indicates that, of the 18 departments, Choluteca and Yoro
respectively ranked fourth and six out of in terms of net external migration. If severity were
significantly correlated to external migration, it would be logical to expect that these
departments would have ranked higher, unless perhaps the damage to Yoro and Choluteca
affected a large number of people at a relatively low-level. But the damage assessment
conducted by the Economic Commission for Latin America and the Caribbean (ECLAC)
(2001) suggests that this was not the case; infrastructural damage in Choluteca and Yoro
truly was more significant than any other region. In Choluteca, the subway station was
completely buried in mud; floodwaters washed away entire office buildings; and 19% of all
classrooms were destroyed (ECLAC 2001). In Yoro, severe infrastructural and economic
damage resulted from the destruction of approximately 100,000 cubic meters of pine timber
(a primary economic resource) and 13% of all classrooms (ECLAC 2001). By comparison,
the top three migrant-sending departments in 2001—Valle, Santa Barbara, and Olancho
(Instituto Nacional de Estadística de Honduras 2001)—experienced classroom destruction of
4%, 1%, and 2% respectively (ECLAC 2001). The fact that these three departments out-
ranked Yoro and Choluteca in terms of net migration seems to suggest that infrastructural
damage alone is not likely to account for the tripling of migration from Honduras.
There does appear to be some relationship, however, between perceived economic
severity and migration. One of the benefits of using a cost-benefit approach to migration is its
ability to illustrate the rational processes through which individuals weigh what s/he does and
does not know about the present and the future. To best measure the effect of severity on
migration, one must therefore consider what Hondurans and Nicaraguans perceived the
economic severity of Mitch to be when the decision to migrate was made, presumably by the
26. Cloninger 26
end of the first year of reconstruction. An assessment of this sort reveals that the economic
realities experienced by the Honduran and Nicaraguan publics were in fact very different one
year after Mitch. Nicaragua was experiencing higher per capita GDP growth than Honduras
and investments in social services emerged in sectors that had previously been ignored. The
opposite was true in Honduras were per capita GDP growth declined in the first year and
federal services were cut back, as opposed to strengthened. From the viewpoint of a potential
migrant, there would have been a greater incentive to leave Honduras than Nicaragua.
At first glance, this conclusion seems inconsistent with the overall GDP trends for
both countries. As observed in Figure 3, Honduras experienced particularly large spikes in
per capita GDP growth between 1998 and 2002 while Nicaragua experienced smaller but
relatively steady growth during the same period. One may therefore ask: Why would
Hondurans have left a country that was making gains of as much as 30% per capita GDP by
2000, despite surviving one of the worst hurricanes in history (World Bank 1997, 2000)?
Two points should be made with regards to this observation. First, World Bank calculations
of GDP include yearly remittances received from abroad, and with emigration doubling from
Honduras in 1999, the unusual spikes beginning in 2000 are not particularly surprising.
Figure 4Figure 3
27. Cloninger 27
Emigrants that had left Honduras the year following Mitch were (in theory) pouring capital
back into the country by 2000 alongside international aid donors, thus elevating the country’s
overall GDP. Second, considering that those able to migrate would have most likely done so
within twelve months of the storm, GDP figures from 1999—not 2000—are most useful in
understanding the economic factors migrants weighed at the time the decision to relocate was
likely to have been made. Indeed, these figures show that in the year following the storm,
per capita GDP growth stood at 3% in Nicaragua and a mere 1% in Honduras (see Figure 4)
(World Bank 1998, 1999). Viewed from this perspective, the individual economic incentive
to leave was therefore lesser in Nicaragua than Honduras in 1999.
Latino Barometer survey data gathered in 1998 and 2000 also supports the conclusion
that the perceived economic severity of the disaster was greater in Honduras than Nicaragua.
Of the approximate 900 Nicaraguans surveyed before and after Mitch, there was a decidedly
upward shift in how citizens viewed their personal economic situation after the storm.
Whereas 27% of Nicaraguans surveyed in early 1998 predicted their future family economic
situation would be “better” in 1999, as many as 34% expected their economic situation to
improve in 2000. On the opposite end of the spectrum, those expecting their economic
situation to be “worse” cut in half: 22% to 11%. A similar trend occurred in Honduras,
though to a much lesser extent. The percent of respondents predicting an improvement in
their economic situation increased from 47% in 1998 to 48% in 2000 with the number
predicting decline decreasing from 21% to 18% (see Figure 5).7
Economic optimism was
therefore much more prevalent in Nicaragua.
7
It could be argued that these figures are not perfect representations of the shift in economic perception in large
part because the surveys administered in 2000 did not capture those migrants who had already left each state.
Nonetheless, it is logical to assume that those individuals who migrated post-Mitch were probably those most
likely to have ranked their economic situation as “worse” had they been surveyed in 2000. They were, after all,
those who valued the economic benefit of relocation enough to leave. It is therefore quite possible that Latino
Barometer figures for Honduras are actually an understatement, as its respondents were merely those remaining
in Honduras (i.e. those who could not or chose not to move) after Mitch. This pool would most likely have
28. Cloninger 28
Qualitative evidence from post-Mitch USAID, NGO, and scholarly reports also
suggest that GOH’s inability to ensure gainful employment and economic recovery was a
large contributing factor to rising emigration. Just three months after the hurricane, Mauricio
Diaz Burdett of the Association for Honduran NGOs publically warned that migration would
follow if the fragile democratic system failed to respond adequately to the economic needs of
the people (Burdsal 1998). In its 2000 Congressional Presentation, USAID similarly stated
that the sudden rise in illegal Central American immigration could only be quelled by
“restoring previously positive economic growth rates, expanding employment, and
improving the quality of life.” IOM Director General Brunson McKinley echoed this
prognosis in his report, citing inadequate rehabilitation and reconstruction as the primary
drivers for external migration (IOM 1998). Even Sanchez (2008), an expert on Honduran
migration, wrote that “the weak image that the state projects before and after Mitch and its
included a minority composed of those too poor to leave, and a majority for whom Mitch did not pose a
significant economic threat warranting migration. Bearing this in mind, the 2000 survey numbers for Honduras
become even more telling. The fact that a more financially secure respondent pool registered a mere 1%
increase in economic optimism in 2000 should serve as a testament to the dismal economic perception
pervading Honduras in the years following Mitch.
Figure 5
29. Cloninger 29
inability to secure gainful employment for the majority of the population creates insecurity
among the population.”8
As this qualitative and quantitative evidence suggests, there does appear to be a
relationship between severity and migration, though its extent is unclear. Aggregate level
data indicates a possible, albeit untested, non-linear relationship between real severity and
migration (i.e. a severity ratio of 3:1 resulting in 7:1 increases in emigration); however,
municipal level data suggests that higher infrastructural damage does not necessarily lead to
greater emigration in the years following a natural disaster. The evidence more strongly
suggests that perceived severity, measured as an individual’s perceptions of her or his
economic future, may weigh heavily on the decision to migrate. This observation may speak
to the importance of media and government portrayals of recovery and reconstruction, as
opposed to infrastructural damage, though further testing of this theory is needed.
Migrant Networks
The second hypothesis posits that the tripling of Honduran emigration in 1999 may
have resulted from the existence of migrant networks that were stronger for Hondurans
compared to Nicaraguans. Such a theory suggests that the comparative strength of Honduran
networks might have lowered the cost of migration for those emigrating from Honduras, as
opposed to Nicaragua, thus explaining the variation in emigration following Hurricane
Mitch. After examining the size, density and organization of Honduran and Nicaraguan
communities abroad at the time of the hurricane, there appears to be little evidence
suggesting that pre-Mitch Honduran networks were indeed stronger than those of Nicaragua,
particularly in the U.S. (the primary destination for Honduran migrants after the storm
8
Translation by author: [L]a imagen débil que proyecta el Estado antes y despues del Mitch y su incapacidad
para garantizar un trabajo remunerado a la mayoria de la Población Económicamenta Activa (PEA) crea una
Inseguidad por parte de esta población…Provocando así la Emigración de Hondureños al extranjero. (Sanchez
2008)
30. Cloninger 30
(Blanchard et al 2006)). In fact, more Nicaraguans than Hondurans were living in the U.S. as
of 1997 with high concentrations residing in Florida and California to create strong, densely
populated networks (see Figure 6). Hondurans were, by comparison, fewer in number and
more dispersed across the U.S. at the time of Hurricane Mitch (U.S. Census Bureau 1990).
Nicaraguan migrants also tended to be wealthier and well established within their
communities compared to immigrants from Honduras, factors that again add to migrant
network strength (U.S. Census Bureau 1990).
Given the aforementioned facts, it appears as though pre-Mitch migrant network
conditions most likely do not account entirely for the spike in Honduran emigration in 1999.
If anything, one might expect to see greater Nicaraguan migration to the U.S. based on their
relative number, density, and organization; yet surprisingly, only 25,000 Nicaraguans
migrated to the U.S. after Mitch (Funkhouser 2006: 8) compared to an estimated 70,000
Hondurans between 1998 and 2000 (Muñoz 2000).9
It is also interesting that, despite there
9
There is a discrepancy between Funkhouser’s (1999) data and the statistical records of the Department of
Homeland Security (DHS) data. According to DHS, the number of immigrants arriving from Nicaragua
outstripped Honduras 3:1 in 1999. Yet it could have been the case that Hondurans—who were typically poor,
young, and single (Blanchard et al 2010)—were less likely to enter the U.S. through legal channels that required
registration with DHS. In contrast, U.S.-bound Nicaraguans who tended to be wealthier, older, and married
Number and Percentage of Central American Immigrants in the United States by
Country of Origin, 1970-2000
Figure 6
31. Cloninger 31
being more Nicaraguans living in the U.S. compared to Costa Rica prior to Hurricane Mitch,
the majority of Nicaraguans went to Costa Rica following the storm. This phenomenon can
most easily be attributed to the socioeconomic profile of post-Mitch Nicaraguan migrants
emigrating to Costa Rica and the extraordinarily high density of Nicaraguan communities
there compared to the U.S.
U.S. Networks
It is not surprising that the United States served as the primary destination for
Honduran migrants following Mitch (Blanchard et al 2010). Historically, the U.S. has
remained both the number one trading partner and number one migrant destination for
Honduras (Smagula 2010). In fact, prior to 1970, Hondurans constituted the largest
percentage of Central American immigrants (16.8%); however, conflicts in Central American
in the 1980s caused the number of non-Honduran migrants to rise (see Figure 6). Thus, by
1990, Honduras had fallen behind Nicaragua in its share of the immigration population in the
U.S., making it the fifth largest Central American group (U.S. Census Bureau 1990).
The reason for the relative switch in Honduran and Nicaraguan shares of the
immigrant population by this point is largely differences in history. Whereas Honduras
consistently sent a steady stream of economic migrants to the U.S. throughout the twentieth
century, these waves were usually no larger than several thousand. In contrast, Nicaragua’s
political history led to an enormous influx of Nicaraguan immigrants in the 1970s.
Nicaraguan communities that had originally formed in the 1950s and 60s in Los Angeles,
San Francisco, and New Orleans became more solidified with the outbreak of the Sandinista
conflict in 1979 (González-Rivera and Grossman 2011) when residents banded together to
form political organizations such as the Nicaraguan Network or “NicaNet” (NicaNet 2007).
(Blanchard et al 2010) would be those more likely to afford the expense of formal immigration. Thus, DHS
numbers could be skewed in favor of Nicaragua due to variation in migrant income.
32. Cloninger 32
The group, constructed to unite Nicaraguan-Americans in opposition to the Somoza regime,
is still active more than 30 years after its formation, and facilitated rallies and circulated
publications relaying news from home to Nicaraguan immigrants residing in the United
States. Politics therefore gave Nicaraguan communities the impetus to strengthen networks
abroad, a factor that was less formative in the creation of Honduran networks.
It was also during the 1970s that dense Nicaraguan networks begun emerging in
Miami and neighboring cities, earning the area the title of “Little Managua.” According to
Smagula (2010), wealthy families associated with the Samoza regime were among the first
Miami-bound migrants, though it is estimated that as many as 20,000 immigrants fled to
Florida during this time with another 175,000 emigrating—documented and
undocumented—to Miami in the 1980s (Smagula 2010). Miami became, in the words of
Smagula (2010), “the capital of the exile…the center of Nicaraguan American life.” Over
time, these Miami Nicaraguans began forming additional organizations, including the
Nicaraguan American Chamber of Commerce (NACC), which was formed in 1986 to
“promote the commercial, industrial, professional and cultural interests of the Nicaraguan
American Community in Florida” (NACC 2010). Nicaraguan business owners used the
NACC to bolster their presence in Miami, leading Portes and Sensenbrenner (1993: 1330) to
conclude, “The Nicaraguan immigrant community of Miami provides an excellent example
of the birth of bounded solidarity and the reactivation of a cultural repertoire brought from
the home country.” In addition to the NACC, the Nicaraguan migrant community boasts of
five newspapers, five organizations and associations, four research centers, and one museum
(Smagula 2010). By comparison, the Honduran community in the U.S. has one print media
outlet, two television shows (both in NYC), and two associations (Maxwell 2007).
One explanation for the relatively low level of Honduran migrant network affiliations
may be due to differences in the demographic make-up of Honduran and Nicaraguan
33. Cloninger 33
migrants. Demographically speaking, Nicaraguans migrating to the U.S. have historically
been older than Hondurans and have had slightly higher levels of education and income
(Blanchard et al 2010: 5).10
They are also more likely to be married and speak English,
characteristics that helped to facilitate the formation well-funded, well-publicized
organizations within the United States. Conversely, establishing large formal network
structures has been more difficult for the predominantly Spanish-speaking Honduran
immigrant population, many of whom fall at the lower end of the income spectrum (Maxwell
2007). Prior to Hurricane Mitch, 33.7% of Hondurans reported working in the service
industry (e.g. restaurant work, janitorial, laundry, and retail) (Maxwell 2007), whereas the
majority of Nicaraguans arriving to the U.S. between 1979 and 1988 were largely employed
in white-collar occupations before emigrating to the U.S. (Smagula 2010).
Another factor contributing to the overall cohesion of Nicaraguan migrant networks
relative to those of Honduras is geographic distribution. As illustrated in Figure 7,
Nicaraguan networks were highly concentrated in particular areas of the United States by
1990, namely the South Atlantic and Pacific regions (U.S. Census Bureau 1990). The largest
communities resided in Florida (70,374) and California (64,285) (U.S. Census Bureau
1990).11
This was quite unlike the distribution of Hondurans, which consisted of modest
immigrant populations dispersed across the Middle Atlantic, South Atlantic, West South
Central, and Pacific regions (U.S. Census Bureau 1990). The states populated with the most
Hondurans included California (26,834), New York (23,014), Florida (21,682), Texas
(9,614), and Louisiana (8,268) (U.S. Census Bureau 1990). Due to the more dispersed nature
10
The average annual income for a Nicaraguan in the U.S. in 2005 was $16,979 compared to $12,995 for a
Honduran immigrant (Baumeister 2008: 22).
11
It would be preferable to have statistics on the distribution of Honduran and Nicaraguan networks closer to
Hurricane Mitch; however there is simply very little data available on these population between 1990 and 1998.
The organization offering the most comprehensive assessment of current immigrant populations, the Pew
Hispanic Center, was not formed until 2001. Thus, 1990 Census data is the best pre-Mitch assessment available.
34. Cloninger 34
of the Honduran population, plugging into well-defined, dense networks would have been a
greater challenge for Hondurans entering the U.S. after Mitch.
The data examined above appears to suggest that Nicaraguan networks were as
strong, if not stronger, than those of Honduras in terms of size, concentration, and
organization prior to Hurricane Mitch. The hypothesis that stronger Honduran networks led
to a lowering of migration costs for Hondurans relative to Nicaraguans therefore seems
unlikely. Honduran migrants residing in the U.S. were largely male, single, of rural origin,
and dispersed, whereas Nicaraguans in the U.S. were typically married, of urban origin, and
living in highly concentrated areas (Funkhouser 2006). If anything, the costs of migration
would have been lower for Nicaraguans who would have benefited from larger concentrated
numbers residing in the U.S. and the high number of migrant associations formed prior to
Mitch. It is certainly interesting then that, in spite of this fact, the majority of post-Mitch
Nicaraguan migrants did not go to the U.S., but rather to Costa Rica where the number of
Figure 7
35. Cloninger 35
immigrants totaled 1.9% of Nicaragua’s 1997 population compared to the 5% residing in the
U.S. (U.S. Census Bureau 1990; DHS 1990-1997; World Bank 1997).12
To understand why
Nicaraguan migrants would have been more attracted to Costa Rica, I turn now to an
examination of the history and density of Nicaraguan networks in that region.
Costa Rica
Given the fact that more Nicaraguans lived in the U.S. when Mitch struck, it is indeed
puzzling that the majority of migrants from Mitch-affected areas went to Costa Rica and not
the United States. Such an observation is far less surprising, however, when one considers
the density of Nicaraguan networks relative to the Costa Rica population when Mitch struck.
Whereas Nicaraguans comprised 0.0009% of the U.S. population in 1997 (U.S. Census
Bureau 1990; DHS 1990-1997; World Bank 1997),13
approximately 2.4% of Costa Rica’s
overall population was Nicaraguan by 1997 (Blanchard et al 2006; World Bank 1997).14
Nicaraguans may therefore have gone to Costa Rica in greater mass due to the concentration
of migrants living in the country overall, which acted to lower relocation and information
costs between the two countries. Considering that the majority of Nicaraguan migrants to
Costa Rica were from poor rural areas (i.e. those affected most by Mitch) (Funkhouser 2006),
the lower migration cost and closer proximity of Costa Rica relative to the U.S. would have
made migration to the former logical from a cost-benefit perspective.
12
Totals from the 1990 U.S. Census indicate that 177, 077 Nicaraguans resided in the U.S. at the start of the
decade. Combining these figures with Department of Homeland Security immigration totals from 1990 to 1997,
it is reasonable to estimate that at least 245,413 Nicaraguans resided in the U.S. one year prior to Mitch. The
population of the Nicaragua was 4,849,265 in 1997 (World Bank 1997).
13
See footnote 9 for the process used to estimate the total of 245,413 Nicaraguans living in the U.S. This figure
is 0.0009% of the U.S. 1997 population of 272,657,000 (World Bank 1997).
14
A total of 90,000 Nicaraguans also resided in Costa Rica in the mid-1990s (Blanchard et al 2006), which is
roughly 2% of Costa Rica’s 1997 population of 3,658, 043 (World Bank 1997).
36. Cloninger 36
In addition to there being a high concentration of Nicaraguans in Costa Rica, the
history of Nicaraguan migration to Costa Rica would have also increased the incentive to
follow well-worn migrant paths. Whereas heavy Nicaraguan migration to the U.S. dates back
to the 1970s, immigration to Costa Rica began at the end of the nineteenth century when
Nicaraguans crossed the border to work on banana plantations and in mines (Ramos 2006).
In the 1950s, migration became seasonal with the growth of cotton farming and estimates
suggest that as many as 50,000 Nicaraguans resided in Costa Rica either permanently or
temporarily by 1980 (Ramos 2006). To this number, approximately 80,000 migrants were
added during the Samoza dictatorship (Ramos 2006), 100,000 during the Sandinista
revolution (Ramos 2006), and 10,000 following the Managua earthquake of 1972 (IOM
online 2011). As many as 200,000 Nicaraguans were believed to be residing in Costa Rica by
1997 (Marquette 2006: 3).
Figure 8
Mitch
37. Cloninger 37
This has not meant, however, that the inflow of Nicaraguans into Costa Rica has been
peaceful. For years, media and news outlets have linked such issues as poverty and crime to
increasing Nicaraguan immigration; however, Marquette (2006) argues that such tension
have acted to bond, rather than weaken, Nicaraguan communities. This was particularly true
after the Costa Rican government offered 150,000 Nicaraguan migrants legal immigrant
status following Mitch, a provision that ended on July 31, 1999 (Migration News Oct 1999).
When a number of families refused to leave, the Costa Rican public protested for stricter
immigration enforcement. Graffiti reading “Nicaraguans out” appeared on walls in San Jose
and in June 1999, the Supreme Court upheld the decision to deport 300 Nicaraguans families
(Migration News Oct 1999). And yet despite this the ruling, Nicaraguan networks continued
to hold strong after the hurricane. Marquette (2006) states that the doubling of the
Nicaraguan population since Mitch has led to changes in Costa Rican policy. For instance, in
response to the increased gathering of Nicaraguans in public squares on Sundays, the
Government of Costa Rica began revitalizing public spaces in San Jose where most
Nicaraguans in Costa Rica live (Marquette 2006). Also responding to the high density of
Nicaraguan migrants, the government included a section in its 2002-2006 National
Development Plan accounting for the welfare of Nicaraguan immigrants (Marquette 2006).
In addition to gaining government concessions through sheer size and concentration,
the 40% of Nicaraguans living in San Jose and 30% living in the northern departments have
also gained a significant occupational foothold in the country (Marquette 2006: 3). As of
2000, approximately 70% of Nicaraguans residing in Costa Rica were between the working
ages of 20 and 39 (Marquette 2006: 4). The majority of these, particularly those residing in
San Jose, are long-term permanent migrants with education levels higher than those
remaining in Nicaragua, but lower than the average Costa Rican (Marquette 2006). In terms
of occupation, Nicaraguan men in San Jose make up approximately 20% of the construction
38. Cloninger 38
workforce in Costa Rica and Nicaraguan women constitute 30% of the domestic service
workforce (Marquette 2006: 6). These high Nicaraguan concentrations in low-skilled
industries would have provided a strong pull for low-income migrants devastated by the
effects of Hurricane Mitch. Whereas rich Nicaraguans would have been able to rebuild
following the hurricane or migrate to the U.S., those at the lower end of the economic
spectrum would have been more likely to view migration to Costa Rica as the least
expensive, most logical choice. Poor Hondurans, by comparison, did not have a “Costa Rica
option” where networks were equivocally dense. Thus, they migrated en masse to the U.S.
(their best option) while Nicaraguans flooded across the border into Costa Rica. The result
was that by 2005, the percentage of those living abroad and in the U.S. was 93% for
Honduras and 38% for Nicaragua (Baumeister 2008: 19). Most Nicaraguans (46%) resided
just across the border in Costa Rica (Baumeister 2008: 19).
Government Capacity
My third and final hypothesis posits that differences in Honduran and Nicaraguan
capacities to respond to Hurricane Mitch may have resulted in variation in post-disaster
emigration. In other words, the Nicaraguan state may have been more capable in managing
relief and recovery efforts, thereby maintaining (or increasing) public confidence in the state
to the point of lowering the expected benefits of migration. Like severity, it is best to test this
hypothesis by measuring both real and perceived state capacity for Honduras and Nicaragua.
The evidence suggests that the Nicaraguan government was not necessarily more capable
than that of Honduras, but rather that it relied heavily on the work of NGOs to carry out the
recovery and reconstruction process. What little it did do, however, it did well (e.g. restoring
utilities and administering food). In contrast, the Honduran government took more direct
responsibility for the disaster recovery agenda and in doing so demonstrated its inability to
39. Cloninger 39
respond to the needs of the people. Survey data also suggests that the Honduran state
experienced drastic declines in public perceptions of state capacity following Hurricane
Mitch, whereas perceptions regarding state capacity for Nicaragua remained relatively
unchanged. This observation may be an indication that declining perceptions of state capacity
in Honduras and unchanged perceptions in Nicaragua played a role in producing the
observed emigration variation in 1999.
Real & Perceived Government Capacity: Nicaraguan Successes & Honduran Failures
To begin to understand the government response to Hurricane Mitch, it is necessary
to note that neither the government of Nicaragua nor Honduras was prepared for the
devastation wrought by Mitch as it slowly plowed its way through Central America from
October 28-30, 1998. Both countries were in a delicate period of transition away from largely
closed, military-operated states and neither boasted a strong disaster management capacity
prior to the storm. This was in large part the result of strict neoliberal reforms adopted in the
1990’s in both countries. In Honduras, efforts to decentralize the state prior to Mitch had
resulted in the financial gutting of the primary organization responsible for federal natural
disaster response: the Permanent Committee for Contingencies (COPECO). By 1998,
COPECO was operating on a budget of $200,000 per year with a total of two telephone
lines—hardly an organization capable of responding to the worst hurricane of the century
(Fuentes 2003: 126). Similar cutbacks in disaster management were mirrored in Nicaragua
where the state took steps to “slim down” the central government and, consequently, its
capacity to respond to Mitch (Christoplos et al 2009). In a review of disaster management
pre- and post-Mitch, Christoplos et al (2009: 8) states, “When Mitch struck, disaster risk
management was a relatively obscure and technical field of activity in Nicaragua.” In light of
the fact that Honduras and Nicaragua shared similarly weak disaster prevention mechanisms
40. Cloninger 40
before 1998, it is interesting that the two countries varied significantly in their response and
adaptation to Mitch when it hit.
Honduras
In the days leading up to the hurricane, Honduran President Carlos Flores was well
aware the Mitch would make landfall and took steps to warn the population. On October 28,
he sent helicopters to Islas de la Bahia to evacuate approximately 25,000 people (AFP 1998)
while instructing state personnel to issue hurricane warnings via the radio, television, and
print media (Fuentes 2003). Sadly, many of these messages failed to reach rural areas,
leaving many Hondurans at the mercy of hurricane-strength winds and rain that raged for
three full days. After the storm had passed, the country was left in pieces with citizens
stranded on rooftops and roads and electrical grids washed out across the country. At the
time, the state own 18 helicopters and 12 planes, approximately half the total needed to
facilitate rescue operations (Fuentes 2003: 126). COPECO was operating out of building
without access to computers, fax machines, or international phone lines (Hofstetter 2000). It
also lacked the authority to request additional supplies or funding from various ministries,
leading GOH to realize that both its preparatory and response efforts were woefully
insufficient; COPECO lacked the needed authority, funding, personnel, and equipment.
Confronted with a strained capability to respond to the disaster, “President
Flores…seemed to believe that the best way of responding to the crisis was by centralizing
power” (Fuentes 2003: 131). He issued Executive Decree No. 018-89 declaring a state of
emergency for the country and enforced a strict 15-day curfew in an effort to curtail looting.
On November 1, 1998, he establishes the Comisión Nacional de Emergencia (CONE), a
fairly weak organizing body intended to serve as an information hub for gathering and
distributing disaster data across government agencies. In addition, he announced that a group
41. Cloninger 41
of technocrats had begun forming a reconstruction plan on November 3, 1998, but released
few details regarding its content publically (Fuentes 2003). Finally, he advocated for the Law
for Administrative Faculty, which awarded him sole power to modify and prioritize the
national budget, as well as form a new Special Cabinet for National Reconstruction.15
Municipal governments not represented in the new cabinet were required by law to
implement the plan it would later produce (Fuentes 2003).
The formation of CONE and the Special Cabinet did little to strengthen GOH’s
capacity to respond to the disaster and, according to Fuentes (2003), merely agitated disputes
between municipalities and the central government. Citizens were left stranded upon rooftops
for as long as two weeks, and the destruction of telecommunication and transportation
systems left some communities incapable of reaching Flores’ administration for as many as
three (Fuentes 2003). As a result, municipal governments were forced to fill in the gaps left
by the central government in disaster response. Ironically, the same neoliberal reforms that
had crippled the federal disaster response capability of COPECO (and subsequently
exacerbated the disaster) had also resulted in the slight strengthening of municipal
governments in the years prior to Mitch. Still financially and institutionally strained,
municipal government responded in what ways they could, meaning rescue efforts were
largely attempted out of desperation rather than capability. To quote one mayor, “If we had
waited for the [national] government, the people of Morolica would still be living in tents”
(Fuentes 2003: 128).
Meanwhile, President Flores continued to resist post-Mitch decentralization, a fact
that exacerbated the crippling of the municipal level capacity to respond to the disaster. He
ordered the release of a 1.7% of the national budget to municipalities for reconstruction, as
15
The Reconstruction Cabinet consisted of the Minister of the President, Minister of Finance, Minister of
Public Works, Transportation and Housing, Minister of Agriculture and Livestock, and the Minister of
International Cooperation (Fuentes 2003).
42. Cloninger 42
opposed to the 5% mandated by law (Fuentes 2003: 136). According to the Minister of
Finance, Flores believed municipal governments lacked the capacity to administer the funds
in full, an assertion that civil society organizations (CSOs) adamantly rejected (Fuentes
2003). With the central government failing to reach those affected by the hurricane even
weeks after the disaster, CSOs argued, funds should at least be released to municipalities to
assess and respond to local needs. The Flores administration disagreed and in doing so left
many towns to handle the disaster without the needed equipment or funds. In response,
citizens began stepping in for the government and gathering the types of data COPECO
failed collect. In one case, a geographic information systems (GIS) specialist by the name of
Arturo Corrales began generating data on Mitch damage through his company Ingenieria
Gerencia (Fuentes 2003). Unlike GOH-operated COPECO, which lacked access to the
equipment needed to manage the response, Ingenieria Gerencia relayed Mitch-related
information to the rest of the world through the internet, phone, and fax (Fuentes 2003).
Disputes regarding decentralization and GOH’s capacity to respond to Mitch came to
a head on May 28, 1999 when the five largest donors—Canada, Germany, Spain, Sweden,
and the United States—came together in Stockholm, Sweden to discuss next steps in the
recovery process. The purpose of the meeting was to outline the future of reconstruction with
respect to three elements: decentralization, transparency, and civil society representation.
Representatives from civil society groups attended the meeting, though their relationship
with GOH remained tense. Nonetheless, the consultation resulted in a set of goals and
principles known as the Stockholm Declaration (1999). The agreement pledged $2.8 billion
of conditional funding for both Honduras and Nicaragua and set forth the following goals:
• Reduce social and ecological vulnerability in the region.
• Reconstruct and transform Central American on the basis of an integrated
approach to transparency and good governance.
43. Cloninger 43
• Consolidate democracy and good governance, reinforcing the process of
decentralization of governmental functions and powers, with the active
participation of civil society.
• Promote respect for human rights as a permanent objective. The
promotion of equality between women and men, the rights of children, of
ethnic groups and other minorities should be given special attention.
• Coordinate donor efforts, guided by priorities set by the recipient
countries.
• Intensify efforts to reduce the external debt burden of the countries in the
region.
The formation of these objectives nearly seven months after the hurricane changed
the course of reconstruction and loosened Flores’ insistence that the recovery be managed by
an institutionally constrained central government. At the end of 1999, he transferred 100
million lempiras to municipal governments to aid local responses to the disaster (Fuentes
2003). In October 2000, he reinvigorated the Technical Decentralizing Unit that had lain
dormant for nearly four years, and created a new civil society group that would consist of
two representatives from a wider assortment of CSOs (Fuentes 2003). Lastly, in an effort to
gain further international confidence in GOH efforts, he created the National Anti-Corruption
Council in 2001, followed by a poverty reduction strategy in April 2002 (Fuentes 2003).
Each of these reforms was, in theory, keeping with the tenets of the Stockholm
Declaration and was believed to improve the government’s capacity to respond to the
disaster; however, it is essential to note that many were short-lived and/or illusory. The new
civil society group was largely conceptual and dissolved at the end of Flores’ term in office;
the transferring of funds from central to municipal governments was the product of a law suit
brought against the government by civil society groups, not a genuine desire within GOH to
decentralize; and international donors continued to emphasize transparency in reconstruction,
as opposed to transformation in the political and economic sphere (Fuentes 2003).
Furthermore, to the people of Honduras, these temporary and often forced GOH responses to
the hurricane did not take place until more than a year had passed. By that point, it is likely
44. Cloninger 44
that the majority of dissatisfied Hondurans would have left the country, seeing mostly
government failure in terms of disaster recovery within the first 12 months.
An assessment report issued by the World Bank in 2004 also confirms the lack of
disaster response capability on the part of GOH in the years following the hurricane. The
report, written by Telford et al (2004), delivers a scathing assessment of the government
response. Telford et al (2004: iv) states:
“National coordination for recovery was weak. Countrywide needs and
recovery project mapping has been inadequate. The presence and activities
of NGOs in municipalities was determined on an ad hoc basis. Monitoring
was also piecemeal. The government has shown a low rate of execution
for repairing or constructing services for new housing.”
The same report goes on to state that the government lacked the capacity to respond
to the disaster when it came to securing livelihoods, housing, and infrastructural repair for the
affected population. Telford et al (2004: v) writes that “few positive experiences of recovery
were encountered” in terms restoring rural livelihoods in agriculture or livestock five years
after the hurricane, and “In the urban sector…no initiatives for livelihood creation were
found.” With regard to housing, difficulties concerning location, price, building codes, and
citizen participation led to the construction of homes that were “seriously inadequate”
(Telford et al 2004: vi). This was largely the result of land shortages in and around
Tegucigalpa that resulted in the construction of GOH-sponsored housing projects in the
Amarateca valley located an hour outside the capital by bus. Many of these settlements
lacked basic amenities such as water, sanitation, and paved footpaths. Only half of the homes
were properly registered due to inefficiencies in administering deeds to citizens. According
to Telford et al (2004), these factors combined to make the settlements virtually
uninhabitable for as many as four years after Mitch. Citizens preferred to return to high-risk
areas or migrate than relocate to inadequate government-sponsored housing.
45. Cloninger 45
Media reports issued 10 years after Hurricane Mitch also echo citizen frustration
regarding GOH capacity to handle the storm. Marco Burgos, the national commissioner of
the Honduran emergency response center, lamented the fact that, should another hurricane
strike the country, GOH would be as under-prepared in 2008 as it was in 1998. He told BBC
news (2008), “The national congress has never taken [disaster management]
seriously…Without doubt, we aren't sufficiently prepared.” According to Burgos, GOH only
established a formal disaster emergency fund in 2008 and the fund held an alarmingly low
amount of $250,000 (BBC News 2008). Despite the fact that GOH spent over $1 million on
housing reconstruction following Mitch, Burgos argues that the majority of the homes were
not built to a code sufficient to withstand another storm. Hector Espinal of UNICEF echoes
these fears in his interview with BBC News (2008) as well. He states, "If the state suffered
another Mitch, more people would definitely die. The country hasn't learnt its lessons. The
state institutions still don't have the capability."
Nicaragua
In contrast to President Flores’ assumption of government responsibility for relief and
recovery operations, Nicaraguan President Arnoldo Alemán’s reaction to the storm was
initially diffident. For a period of four days following the storm, President Alemán refused to
assist departments most affected by Mitch, referring to municipal pleas for assistance as
“crazy” and a potential drain on already strained state resources (Christoplos et al 2009: 12).
GON could not, he argued, meet both the fiscal requirements of the Highly Indebted Poor
Countries (HIPC) initiative and the needs of hurricane victims; international actors would
simply have to manage the response. However, on the fifth day, when donor pledges began
accruing, a previously aloof Alemán changed course. Judging that Mitch might serve as a net
46. Cloninger 46
gain for the state, rather than a net loss, he became the de jure leader of the recovery agenda
and moved the cogs of the Nicaraguan government into action (Christoplos et al 2009).
He began by declaring those departments hit hardest by the disaster—Chinandega,
León, Estelí, Nueva Segovia, Madriz, Jinotega, Matagalpa, Granada and Rivas—disaster
zones (ECLEC 1999). On November 7, 1998, he established a temporary organizational body
known as the National Emergency Committee (NEC) to coordinate aid and set up an
emergency fund that received as much as US$1 million by November 19 (ECLAC 1999: 15).
By that date, the NEC had distributed over 175,500 tons of medicine and one million tons of
food (ECLAC 1999: 15). The National Electricity Company (ENEL) had also restored power
to those communities affected by the storm, a task the Honduran government had yet to
accomplish (ECLAC 1999).16
Yet while demonstrating the capacity to provide food, medicine, and power to some
extent, the Nicaraguan government was also quick to convey the limitations of its disaster
response capability. Statements released by GON on November 7, 1998 confess that
government response teams had yet to reach 140 communities in need. Similar messages
conveying GON deficiencies also made their way into OCHA reports issued around the same
time. With regards to Honduras, OCHA (1998) states, “The overall responsibility for repair
and reconstruction belongs to the Government through its different designated authorities,
notably the municipal authorities which will be responsible for planning and coordination.”
With regards to Nicaragua, the same OCHA report (1998) states that IOM will be responsible
for contracting, organizing, and monitoring technical staff and UNDP will be responsible for
supplying the materials necessary for repair and reconstruction. Unlike the government of
Honduras, GON is only mentioned here in a directive to international organizations and
16
It should be noted, however, that the severity of power outages and food scarcity were greater in Honduras
compared to Nicaragua; thus, it is difficult to assess whether the Government of Nicaragua was more capable or
if damage was simply more manageable.
47. Cloninger 47
NGOs, which are instructed to “cooperate closely with local authorities” in the
implementation of reconstruction efforts. In other words, GON was not considered a key
player in the reconstruction agenda, despite its small successes noted by ECLAC (1999).
An additional report issued by Oxfam in 2001 reiterates the fact that GON was
largely replaced by NGOs in the recovery process. The report (2001) states that, despite
signing onto the Stockholm principles of increasing transparency and civil society
participation in Nicaragua, such efforts were “significantly hampered” by limited resources
and difficulties surrounding central government coordination. Thus, where the weight of
responsibility for disaster response fell to institutionally constrained municipalities in
Honduras, NGOs quickly stepped in to fill in gaps in central state capacity in Nicaragua.
Christoplos et al (2009) summarizes this phenomenon in an IFRC-commissioned report
concerning Nicaraguan reconstruction. The report (2009: 14) refers to the growing perception
of Nicaragua as “a country where the humanitarian community could do as it pleased” and
states:
“…[T]here was little acknowledgement among the operational agencies on the
ground in the first years after the hurricane that participation of the institutions
of the state and civil society was part and parcel of this recovery. The
recovery phase was interpreted as primarily consisting of ‘bricks and mortar’
projects chosen and implemented by international agencies.”
The years following Hurricane Mitch were subsequently—and not surprisingly—rife
with debate over the role international actors should play in the recovery process. Christoplos
et al (2009) states that such debates were ultimately moot, however, as the slimming down of
Nicaragua’s central government via early 1990s neoliberal and HIPC reforms had stripped
the country of any real ability to act apart from the international community. Many NGOs
simply equated efforts to increase local ownership over the recovery agenda to increasing the
involvement of national NGOs rather than the national government. This frequent bypassing
of both central and municipal government structures resulted in the continued decline of risk
48. Cloninger 48
management within the GON agenda. Despite the post-Mitch formation of a body charged
with managing disaster risk reduction and response, SINAPRED (Sistema Nacional para la
Prevención, Mitigación y Atención de Desastres), GON funding with regard to disaster
management was consistently unreliable in the decade following Mitch. Often one mid-level
staff person was assigned the task of disaster mitigation within the municipal bureaucracy
and frequent turnover made the development of institutional knowledge difficult (Christoplos
2009). In addition, clientelism and political polarization often emerged in those areas where
decentralization did occur (Christoplos 2009).
This is not to say, however, that the reconstruction efforts involving GON were
altogether ineffective. On the contrary, the large inflow of foreign aid made possible an
unprecedented increase in public expenditures for housing. Between 1998 and 1999 alone,
the federal housing budget increased from C$0 in 1997 to C$78,705 in 1999 (Christoplos
2009: 13). Many Nicaraguans living in improvised dwellings, crowded homes with relatives,
or residential farm units prior to Mitch received homes for the first time after the hurricane.
Thus, unlike Hondurans whose homes were destroyed and replaced with sub-standard
government-issued units (Telford et al 2004), Nicaraguans experienced an improvement in
their living conditions as of 1999 with the help of GON and NGOs (Christoplos 2009).
While the central Nicaraguan government did formally administer the funds used in
housing reconstruction efforts, it is worth stating that NGOs and international actors (e.g.
IRFC, UNDP, USAID and IOM) implemented construction efforts, not the government
(IRFC 2006). Unlike Hondurans who “continued to live in old houses or in other
accommodations” (IRFC 2006: 3), Nicaraguans were provided temporary shelters by USIAD
and IOM while other NGOs built houses strong enough to withstand hurricane-force winds.
In contrast to the GOH-constructed Amarateca valley homes lacking access to potable water
(Telford et al 2004), the national water company of Nicaragua also supplied NGO-
49. Cloninger 49
constructed homes with a permanent water supply (IRFC 2006). If this was not possible,
gravity-fed systems were put in place (IRFC 2006). Reports indicated that all 832 houses
were still standing and occupied nearly eight years after the storm (IRFC 2006: 3), whereas
many Amarateca homes in Honduras were empty as of 2004 (Telford et al 2004).
Clearly, NGO involvement in Nicaragua was substantial, making it difficult to assess
whether government capacity was truly greater than that of Honduras, or whether NGO
involvement merely made the state appear more capable. For instance, IRFC programs
consistently reached more Nicaraguans than Hondurans (see Figure 9), despite the fact that
damage and population displacement were greater in Honduras. For citizens unaware of the
source of many relief and recovery supplies, this outpouring of assistance in Nicaragua could
have been attributed to GON. Alternatively, citizens could have known that NGOs were
responsible for the majority of reconstruction efforts, but did not attribute this fact to
Figure 9
50. Cloninger 50
deficiencies in government capacity. With both their livelihoods and living conditions
improving by 1999, blaming the government would have simply been less likely.
Latino Barometer surveys conducted months before Hurricane Mitch and again in
2000 seem to support this hypothesis. As illustrated in Figure 10, public opinion of state
capacity in Honduras declined remarkably between 1998 and 2000 with the percentage of
those indicating that the state could solve “few” or “none” of the country’s problems
increasing from 56% in 1998 to over 78% in 2000 and the percentage indicating “all” or “the
majority” decreasing from 24% to 10% (Latino Barometer 1998, 2000). In stark contrast, the
distribution of Nicaraguan perceptions of state capacity generally improved. Whereas 30% of
those surveyed believed that the state could solve “all” or “the majority” of Nicaragua’s
problems in 1998, 36% reported full faith in the government by 2000. These results suggest
remarkable differences in how Hondurans and Nicaraguans perceived the capacity of their
respective governments following Mitch. As was the case with individual economic futures
and perceived severity, Hondurans were far more pessimistic.
This overall Honduran pessimism may be one contributing factor to the remarkable
increase in migration observed in 1999 and the years following. Whereas both Nicaragua and
Honduras were part of the same $2.8 billion aid package (Stockholm Declaration 1999), the
Figure 10
51. Cloninger 51
extent to which international actors and NGOs were involved in the recovery agenda was
much greater in Nicaragua (Christoplos et al 2009). This meant that where GOH efforts to
construct homes, deliver supplies, and coordinate were supplemented by even weaker
municipal attempts to mitigate the disaster, GON efforts to engage in these activities were
largely supported by well-funded non-governmental groups and international agencies.
Consequently, Hondurans received painstakingly slow aid delivery, sub-standard homes to
replace those damaged by the hurricane, and the difficulties of an unresponsive
administration under Flores. Many Nicaraguans, on the other hand, received food, power,
and medicine from their government at the start of the recovery and improved NGO-
constructed homes during reconstruction.
From the viewpoint of a potential migrant, the inability of GOH to respond to citizen
needs would have offered an increased incentive for migration, thus explaining the 286%
increase (FOA 2001: 103), whereas the moderately successful GON response, combined with
the help of international and NGO actors where the response was lacking (e.g. housing),
would have offered an incentive to stay. This would explain why post-Mitch emigration rates
in Nicaragua were lower than those of Honduras. This is not to say, however, that migration
would have been an irrational choice for some Nicaraguans. Indeed, Latino Barometer (1998,
2000) data may explain why the notable 37% increase in emigration occurred in Nicaragua
(FAO 2001: 103) in 1999. As Figure 10 illustrates, the percentage of Nicaraguan
respondents indicating complete dissatisfaction with government capacity did increase by 6%
between 1998 and 2000, indicating a loss of faith in the government on the part of some. It is
therefore possible that the dissatisfied minority would have perceived government efforts as
falling short in the first year of reconstruction and decided to emigrate. The number of
dissatisfied individuals, however, may have been lower overall compared to Honduras—