
Recommended
Recommended
More Related Content
Similar to class-3-nutrition-assessment-24may2017-for-connect-colour.pdf
Similar to class-3-nutrition-assessment-24may2017-for-connect-colour.pdf (20)
More from pashblessings
More from pashblessings (15)
Recently uploaded
Recently uploaded (20)
class-3-nutrition-assessment-24may2017-for-connect-colour.pdf
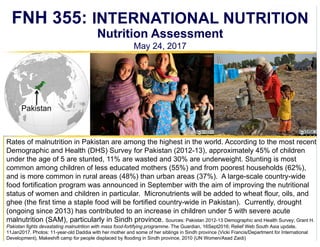
- 1. Nutrition Assessment May 24, 2017 Rates of malnutrition in Pakistan are among the highest in the world. According to the most recent Demographic and Health (DHS) Survey for Pakistan (2012-13), approximately 45% of children under the age of 5 are stunted, 11% are wasted and 30% are underweight. Stunting is most common among children of less educated mothers (55%) and from poorest households (62%), and is more common in rural areas (48%) than urban areas (37%). A large-scale country-wide food fortification program was announced in September with the aim of improving the nutritional status of women and children in particular. Micronutrients will be added to wheat flour, oils, and ghee (the first time a staple food will be fortified country-wide in Pakistan). Currently, drought (ongoing since 2013) has contributed to an increase in children under 5 with severe acute malnutrition (SAM), particularly in Sindh province. Sources: Pakistan 2012-13 Demographic and Health Survey; Grant H. Pakistan fights devastating malnutrition with mass food-fortifying programme. The Guardian, 16Sept2016; Relief Web South Asia update, 11Jan2017. Photos: 11-year-old Daddia with her mother and some of her siblings in Sindh province (Vicki Francis/Department for International Development), Makeshift camp for people displaced by flooding in Sindh province, 2010 (UN Women/Asad Zaidi) FNH 355: INTERNATIONAL NUTRITION Pakistan funded through USAID people selected to represent population as a whole loss of muscle mass and weight vitamin D added to milk in western countries is chronic or acute malnutrition more common in pakistan?
- 2. Objectives for today 1. Define nutrition assessment 2. Describe, with specific examples, how anthropometric measurements can be used to classify malnutrition 3. Clearly define, describe, and evaluate stunting, wasting, underweight, and body mass index (BMI) 4. Briefly describe how biochemical measurements can be used in nutrition assessments 5. Differentiate between clinical signs and symptoms
- 3. Objectives for today, cont’d 6. Identify and explain important clinical signs of malnutrition (including bilateral pitting edema) 7. Summarize the limitations of a physical examination in the assessment of nutritional status 8. Describe strategies for assessing dietary intake (including 24-hour recalls, food records, food frequency questionnaires) and, based on your consideration of their strengths and limitations, determine which method would be most appropriate to use to assess dietary intake in various settings 9. Apply what you have learned so far about nutrition and nutrition assessment to evaluate a recent study from Nigeria
- 4. Nutrition Assessment: How we measure nutritional status Why conduct nutrition assessments? To determine who is malnourished – and to evaluate the _______ of any program or other change – we need to measure nutritional status Mothers waiting for children to be weighed as part of outpatient therapeutic feeding program. UNICEF Ethiopia impact Text
- 5. What is Nutrition Assessment? • The science of determining nutritional status by analyzing individual’s… …history and current data. A measurement of the extent to which the individuals physiologic need for nutrients is being met. Anthropometric Biochemical Clinical Dietary is the person getting what they need in terms of nutrients and energy
- 6. Optimal nutritional status is a balance depends on if we are growing, lactating, sick, pregnant, etc. Nutrient Requirements (what our body needs) Nutrient Intake (what we eat) Nutritional status
- 7. Optimal nutritional status is a balance Krauses Food, Nutrition Diet Therapy, 10th ed. Fig 16-1, p. 354 what we eat need to consider bioavailability stress disturbs the equilibrium in the body need more nutrients relative to body size someone who exercises more would need more nutrients than a sedentary individual
- 8. Conducting Nutrition Assessments in Laos Video Tests: Ñ measured height, weight, wasting Ñ blood tests to measure Hb (iron status) Ñ compare these to DHS data Who was IdentiÞed as undernourished? Ñ children Ñ women Ñ usually those who were poorest (crops wiped out) -marginalized people Ñ responses need 2 branches of activity 1. Health activity Ñ address infection, sickness etc. 2. Livelihood opportunities Ñ canÕt only give micronutrients etc. wonÕt help over time Ñ try to increase economies
- 9. Anthropometry: Measurement of ___________ ___________ and gross composition of the body Key measurements of gross body size: Height, weight, mid upper arm circumference (MUAC) (Results compared to ______________in order to interpret them) Photo: Geno Teofilo/Oxfam Photo: EC/ECHO/Anouk Delafortrie Photo: UNICEF Ethiopia/Getachew dimensions physical standard values can use calipers to measure fat mass measure then compare these to a standard Ñ important
- 10. World Health Organization (WHO) Multicentre Growth Reference Study • Tracked growth of children raised in Brazil, Ghana, India, Norway, Oman, USA • Created international reference values for growth • Infants ___________ Anthropometric measurements are compared to “standard values”… where do standard values come from? people from various countries were monitored for many years measure weight and length of those who were breastfed from birth to 24 months breastfed only
- 11. Do children from different ethnic groups grow differently? Figure source: WHO Multicentre Growth Reference Study Group. Assessment of differences in linear growth among populations in the WHO Multicentre Growth Reference Study. Acta Paediatr Suppl 2006;450:56--65. lines essentially overlap because growth of children and babies in early life do not depend on where theyÕre from, but what they eat and what affects their growth Ñ young children should have similar growth patterns no difference in growth pattern birth to ~2 years of age
- 12. Wasting: ___________________ • Reflects ______ malnutrition • Generally result of weight loss due to recent period of starvation or severe disease • Severe Acute Malnutrition (SAM): weight-for-height is -3 SD or more below WHO standard • Moderate acute malnutrition (MAM): between -2 and -3 SD Figure: Mwtoews via Wikimedia Commons Source: WHO child growth standards and the identification of severe acute malnutrition in infants and children (2009) low weight for height acute undernutrition that occured in the relatively recent past 2.1% of children decisions based on a normal distribution of values 0.1% of children have seveere acute malnutrition ÒwastedÓ 10x likelihood of death wasting = emergency
- 13. Mid upper arm circumference (MUAC) • Measures ____________, correlates with total muscle mass – reflects _______________ – Common for field assessment (measurement is quick, easy, informative) – MAM = 12.5 cm – SAM = 11.5 cm Another way to measure wasting and detect acute malnutrition: MUAC being measured on Shegitu, an 18-month-old girl undergoing treatment for SAM (Ethiopia, 2012) protein status muscle conent simple, mobile measurement with minimal discomfort cut off used to be 11cm
- 14. • Major determinants of MUAC: arm muscle, subcutaneous fat • More _______ measure of malnutrition than low body weight • Strong predictor of risk for death • __________ measurement to perform • Primarily used for children aged 6 – 59 months of age Mid upper arm circumference (MUAC) Photo: Geno Teofilo/Oxfam green: OK yellow: MAM Red: SAM sensitive can predict things earlier than other measurements Easy just before 5 y/o
- 15. Can MUAC be used to assess malnutrition in adolescents and adults? • Some studies have shown low MUAC is correlated with poor outcomes among adolescents and adults – Example: MUAC 23.5 cm in pregnant women associated with higher risk of having baby born with ______________in Guatemala • No international cut-offs exist • Additional research is needed Woman and child in Guatemala. Photo: Chris Serour do not have the same international standard for this measurement low birth weight
- 16. Young girl being screened for malnutrition in Sindh, Pakistan, 2012. Photo: Dan Casperz/DFID
- 17. Stunting: ___________________ • Failure to reach linear growth potential • Reflects chronic malnutrition (sustained and cumulative episodes of undernutrition) • Child considered “stunted” if height-for-age is -2 SD below WHO standard Photo: Mercedes de Onis, WHO. AT Technical Brief, Issue 2, Sept 2010 low height for age height they could have achieved LT gap in caloric intake that isnÕt incapacitating them proportions are appropriate, but overall height is not where it should be 26 months 52 months (stunted) issue because not just a lack of height, but lack of internal development (organs), other body parts, less cognitive development ex: pelvis not properly formed = difÞcult to give birth
- 18. Recumbent length: measured if child cannot ______________________________ Photo credit: Zoriah (www.zoriah.net) Child assessed for malnutrition at Kakuma Refugee Camp in Kenya, February 1, 2009 stand erect without assistance not an easy measurement to do very important to do this test
- 19. “Our work is taking place in the context of a malnutrition crisis in Pakistan, where nearly half of children are stunted and won’t be able to participate in the economy… Stunted kids are at a disadvantage cognitively as well as often being the height of a child two or even four years younger… When these children become adults they are more susceptible to communicable diseases, they are generating less money for their families – and the overall net effect on GDP is 3% a year for Pakistan. So it is a much cheaper problem to fix than to allow to continue.” - John Spicer, President of the Micronutrient Initiative Regarding the large-scale fortification program being implemented in Pakistan (mentioned on the title slide): Children returning home from school in Pakistan. Photo: Adeel Anwer Quoted in Grant H. Pakistan fights devastating malnutrition with mass food-fortifying programme. The Guardian, 16Sept2016 wont be able to provide for families decrease
- 20. But aren’t different ethnic groups just naturally shorter? Is it appropriate to compare height to an international standard? Maya children in rural Guatemala Maya American children in Florida Image source: ABC and Wuqu’ Kawoq via Flood D. Height and herencia in rural Guatemala. GlobalHealthHub.org, 2014 • Race/ethnicity has a _________ impact on preschool growth, compared to _______________effects environmental SMALL especially the case in childrenÕs growth these children would be in normal distribution
- 21. Maya children in rural Guatemala Maya American children in Florida
- 23. Source: Victoria et al. Worldwide Timing of growth Faltering: Revisiting Implications for Interventions. Pediatrics 2010 ÒstuntedÓ children stunting occurs early in life -typically by ~age 2 Þrst 1000 days = when people are most vulnerable
- 24. “Failing to grow” vs. “having failed to grow” Boy in Changu Narayan, Nepal. Photo: Jean-Marie Hullot Dalit girls in Kanakpur Village, Nepal. Photo: Heather Webb, 2012 Advocacy Project Peace Fellow, WRRP, Nepal. ÒstuntingÓ - it is happening right now -chronic, over long period of time ÒstuntedÓ - already happened by this age
- 25. Stunting and wasting can occur together or independently going on over a period of months going on over a period of years
- 26. Underweight: ___________________ • Influenced by both height- for-age and weight-for- height, so interpretation can be difficult • Reflects chronic or acute malnutrition (or combination) 8-month old Hassan Hussein is weighed as part of outpatient feeding treatment in Ethiopia, 2012. Photo: UNICEF Ethiopia/2012/Getachew low weight for age in children Òred ßagÓ
- 27. Body mass index (BMI) Classification BMI Category Risk of developing (kg/m2) health problems Underweight 18.5 Increased Normal Weight 18.5 Ð 24.9 Least Overweight 25.0 Ð 29.9 Increased Obese Class I 30.0 Ð 34.9 High Class II 35.0 Ð 39.9 Very high Class III ≥ 40.0 Extremely high Note: For persons 65 years and older the ‘normal’ range may begin slightly above BMI 18.5 and extend into the ‘overweight’ range. Adapted from: WHO (2000) Obesity: Preventing and Managing the Global Epidemic: Report of a WHO Consultation on Obesity. From: Canadian Guidelines for Body Weight Classification in Adults how we classify weight in adults (20 y/o)
- 28. Anthropometric measurements enable us to identify: How do we identify it? What does it mean? Why does it matter? Wasting Low weight for height Stunting Low height for age Underweight Low weight for age review slide
- 29. Biochemical methods • Measure a nutrient or its metabolite in blood, urine, feces… or measure other components related to nutritional status B Kazakhstan, 2012. Photo: Maxim Zolotukhin/World Bank ex: look at blood to detect Hb and iron levels
- 30. Clinical methods • Use medical history and physical examination to detect and interpret the signs and symptoms of malnutrition Angola, 2009. Photo: mp3ief Sign Observations made by qualiÞed examiner; patient usually unaware of them objective Symptom Reported by patient, more subjective
- 31. Hair • Depigmentation of hair suggests protein deficiency • _________ = traverse depigmentation of hair (reflects period of undernutrition and then improvement) Flag sign hair that would be dark turns more orange/reddish because pigments are protein based Ñ shows lack of protein band depigmentation shows inadequate nutrition for a period of time overall dull hair/loss of colouration are signs of protein deÞciency, but not a clear indicator
- 32. A child with severe acute malnutrition in Mazrak IDP camp in north-west Yemen, close to border with Saudi Arabia, September 2009. Photo: Hugh Macleod/IRIN 2 video clips: Ñ Newest to life are the closest to death Ñ a child dies every 6-10 min in Yemen
- 33. Mouth • Swollen, retracted, bleeding gums • Possible deficiency: __________________ Photo: Centers for Disease Control and Prevention vitamin C
- 34. Eyes • Xeropthalmia: night blindness, photophobia, Bitots spots, corneal ulceration or scarring • Possible deficiency: vitamin _____ Photo: Community Eye Health Journal Vol. 23 No. 72, March 2010 Distinct white-grey __________ plaques lateral to cornea A foamy only on side white part of the eye lateral = beside
- 35. Bitot’s spot: Distinct white-grey foamy plaques lateral to cornea
- 36. Skin • Pallor (___________) of skin and conjunctiva • Consider iron deficiency anemia paleness blood vessels are close to surface, so should be pink not this pale can also look at inner part of lip where it joins to gum area, if that part is pale/white = iron deÞciency mucous membrane lines inside of eyelids
- 37. Nails • Traverse ridging: consider protein deficiency across similar to ßag sign, period of protein insufÞciency
- 38. Nails • Koilonychia (spoon-shaped nails): consider iron deficiency anemia Photo: NHS Choices
- 39. Nails • Koilonychia (spoon-shaped nails): consider iron deficiency anemia
- 40. Edema = swelling due to __________________________ Bilateral pitting edema is a sign of severe acute malnutrition (SAM) • How to check for bilateral pitting edema: Photos: Somalia 2011 Geno Teofilo/Oxfam excess ßuid accumulation press down and see if the skin bounces back independent of anything else 1. press gently with thumbs and hold for 3 sec 2. remove thumbs. If indent remains = pitting edema Ñ bilateral = both sides, if pit is only on ONE side it is NOT bilateral pitting
- 41. Somalia 2011 Photo: Geno Teofilo/Oxfam How to check for bilateral pitting edema
- 42. Somalia 2011 Photo: Geno Teofilo/Oxfam
- 44. August 25, 2016: 11-month-old Bedru had severe acute malnutrition (SAM). This follow- up MUAC measurement indicates his nutritional status has improved, and he is now classified as having moderate acute malnutrition (MAM). Photo: UNICEF Ethiopia/2016/Ayene Example: Using MUAC and checking for bilateral edema to screen for acute malnutrition in Ethiopia
- 45. Using MUAC and checking for bilateral edema to screen for acute malnutrition in Ethiopia Video: Clicker Q Which of the ßoowing is (are) the most appropriate measurement(s) to detect severe acute malnutrition in a Ôhealth postÕ context? A. MUAC B. Bilateral pitting edema C. Weight D. A B Ñ E. All of the above A B are quick and good detectors
- 46. 1. Physical signs are often __________ (especially if deficiency is mild or moderate) • Same sign could be caused by different deficiencies • Signs may be caused by non-nutritional factors 2. Examiner inconsistencies 3. Inter-individual _________________ Limitations of physical exam not speciÞc example: one person may pull the band more than the other = different interpretations variability individual variability can change some results *Can be hard to interpret, not using a single sign as a single indicator.
- 47. Dietary methods • Measurements of foods and beverages consumed in one day, several days, or longer (months – years) It can be extremely difÞcult to accurately assess diet
- 48. 1) 24-hr recalls 1. Participant asked for quick list of foods/beverages consumed in the past _______________ 2. Starting with the first item on the list, the interviewer probes for details (type, amounts, additions or condiments, preparation method) 3. Review details and amounts and correct any inaccuracies 24 hours *Multiple pass method*
- 49. Strengths and Limitations of 24-hr Recall Strengths 1. Quick 2. Inexpensive 3. Easy for person to complete 4. Can be used in variety of settings 5. Does not _______ diet Limitations 1. Under/over-reporting of certain foods 2. Relies on ___________ 3. Labour-intensive data entry 4. One recall does not represent individuals typical intake memory alter depends on diet diversity of individual Ñ some people eat the same thing everyday Ñ others have a wider variety of what they eat * depends on dietary diversity*
- 50. An example of using 24-hour recalls to assess dietary intake: Estimating cassava intakes and prevalence of vitamin A deficiency in Akwa Ibom, Nigeria • HarvestPlus (an international initiative to develop and promote biofortified food crops) has a provitamin A-biofortified cassava program in Nigeria • Biofortification: using genetics (e.g., selective breeding) to increase _____________ in crop (usually staple crop) Biofortified (yellow) cassava containing vitamin A and traditional (white) variety. Photo: Harvest Plus micronutrients yellow casava = can eat more vitamin A through fortiÞcation
- 51. Women selling fufu in market, June 2015. Photo: IFPRI/Milo Mitchell
- 52. Using multiple pass 24-hour recalls to assess dietary intake of women and children in Akwa Ibom, Nigeria • Typical dietary intake estimated in mother-child pairs from 587 households (mothers: 18-49 y, children: 6-59 mths) • “Mother trainers” visited 2 days before data collection to: - explain procedure - distribute plates/cups (to encourage “individual eating” so that individual portions could be estimated) - emphasize the importance of not changing eating habits • 5 mL blood samples provided by women and children Mother and child, Nigeria (2011). Photo: Lindsay Mgbor/DFID De Moura et al. 2015 if donÕt see much undernutrition in children under 5, then generally the whole population has good nutrition status can reßect typical intake would vitamin A be a Dietary method Biochemical Method
- 53. What did they find? • 57% of daily kcal came from _________________ • 30% of women and 8% of children had low _________ intakes • Cassava is widely consumed: 95% of women, 92% of children 24–59 aged months, and 66% of children aged 6–23 months had cassava on the day of the 24-hr recall • Red palm oil consumed by vast majority, made a substantial contribution to vitamin A intake • Overall dietary intakes of vitamin A were ___________ De Moura et al. Cassava intake and vitamin A status among women and preschool children in Akwa-Ibom, Nigeria. PLoS ONE. 2015:10(6);e0129436 PRO CHO adequate 45-65% according to AMDR, so this amount is alright children need smaller amounts of calories than adults, so are not as great of a risk as the women younger children (6-23 months) consume less due to breastfeeding only 1 of 2 sources of saturated fats (coconut oil is another) do not need the enriched casavaÕs in this region Ñ note: biochemical indicator very important as well as dietary assessment Ñ 24 hour recalls are difÞcult to get an accurate assessment
- 54. 2) Food Records • Person records type and amount of food/beverage consumed for a period of time • Typically lasts ________________ • Foods and beverages are written down right after they are eaten 1-7 days addresses memory bias, but writing down what you eat may affect results 3 day food records are most popular (2 weekdays, 1 weekend)
- 55. Strengths and Limitations of Food Records Strengths 1. Do not rely on memory 2. Can provide great detail 3. Can give insight into eating habits/patterns 4. Multiple days more _______________ of individual’s usual intake Limitations 1. Takes time and effort to complete accurate record 2. Requires literacy 3. Recording diet ______diet 4. Labour-intensive data entry and analysis 5. May not represent usual intake alters representative such as brands of beverages and cereal food record is too much for village, is a good Þt for elite athletes may worry what people thing, too lazy to write down etc.
- 56. 3) Food Frequency Questionnaires (FFQs) • Can determine how often person consumes a limited number of foods • Usually 150 or fewer items survey administrered individually, but can be donw as an interview portion sizes are not always indicated indicate how often they consume the food, goes up to one year = greater scope of # of days being assessed
- 57. Strengths and Limitations of FFQ Strengths 1. Can be self-administered 2. Machine-readable 3. Inexpensive 4. May be more representative of ______ intake Limitations: 1. May not include foods usually consumed by participants 2. May not include information on portion size 3. Requires ___________ 4. If self-administered, cannot ask clarifying questions literacy usual
- 58. Other tools in dietary assessment • 24-hour recall/dietary diversity instrument • Local foods • Grouped according to key ____________ – e.g. Vitamin A FOOD OR BEVERAGE CHILD MOTHER 1. Milk – fresh, tinned or powdered Y N Y N 2. Tea or coffee Y N Y N 3. Coke, Sprite, Fanta or other soft drink Y N Y N 4. Juice Y N Y N 5. Beer or other alcoholic beverages Y N Y N 6. Any other liquids (e.g. broth or soup) Y N Y N 7. Maize, sorghum, millet, rice, noodles, bread Y N Y N 8. Pumpkin, yellow sweet potatoes (yams), squash or carrots Y N Y N 9. White potatoes, cassava or white sweet potatoes (yams) Y N Y N 10. Any dark green leaves (e.g. isombe or dodo) Y N Y N 11. Ripe (orange) mangoes or papayas Y N Y N 12. Any other fruits or vegetables (e.g. tomatoes, onions, bananas, cabbages, pineapples, lychee) Y N Y N 13. Liver, kidney, heart, blood, intestine or other organs Y N Y N 14. Meat such as pork (pig), cow, chicken, goat, duck (other fowl) or other animal flesh Y N Y N 17. Eggs Y N Y N 18. Fresh or dried fish or shellfish Y N Y N 19. Beans or foods made from beans, lentils, other pulses or nuts (e.g. cashews or peanuts) Y N Y N 20. Any oil, fats, butter (including foods made with any of these) Y N Y N 21. Red palm oil, palm nut oil Y N Y N 21. Sugar or sugary foods such as sweets, candies, cakes, or biscuits Y N Y N 22. Any condiments (e.g. ketchup) Y N Y N 23. Any other solid or semi-solid food Y N Y N List other if yes to #23 nutrients hybrid of recall and FFQ want to include foods that reßect vitamin A status
- 59. Which method is best for measuring dietary intake? resources respondents goal setting
- 60. Next Class: Malnutrition in Nepal Sociocultural Aspects of Food Reminders: 1. Quizzes for Readings 1 2 available until Sun May 28 at 11:59 PM 2. If you want to change the proposed grade distribution, deadline for doing so is the end of the day today (Wednesday May 24 at 11:59 PM); see syllabus for details “We call upon all governments to ensure free, compulsory education all over the world for every child. We call upon all the governments to fight against terrorism and violence. To protect children from brutality and harm. We call upon the developed nations to support the expansion of education opportunities for girls in the developing world. We call upon all communities to be tolerant, to reject prejudice based on caste, creed, sect, color, religion or agenda to ensure freedom and equality for women so they can flourish. We cannot all succeed when half of us are held back.” -Malala Yousafzai, Pakistani activist for human rights and education and youngest ever Nobel Prize laureate, in her speech to the United Nations, July 2013 (full text: www.ibtimes.com/malala-yousafzais-speech-un-full-text-1344117)