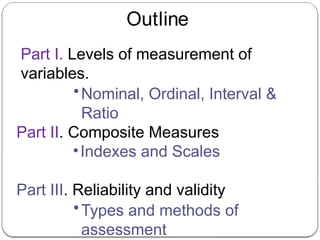
Outline
Part I. Levelsof measurement of
variables.
•Nominal, Ordinal, Interval &
Ratio
Part II. Composite Measures
•Indexes and Scales
Part III. Reliability and validity
•Types and methods of
assessment
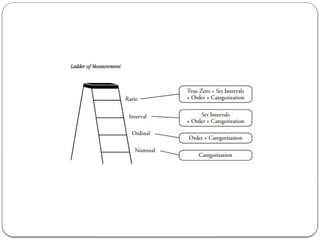
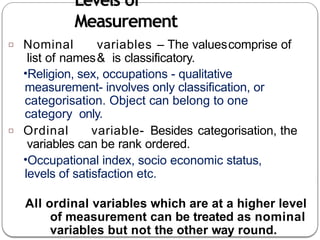
Levels of
Measurement
□ Nominalvariables – The valuescomprise of
list of names& is classificatory.
•Religion, sex, occupations - qualitative
measurement- involves only classification, or
categorisation. Object can belong to one
category only.
□ Ordinal variable- Besides categorisation, the
variables can be rank ordered.
•Occupational index, socio economic status,
levels of satisfaction etc.
All ordinal variables which are at a higher level
of measurement can be treated as nominal
variables but not the other way round.
7.
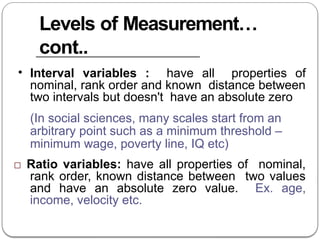
Levels of Measurement…
cont..
•Interval variables : have all properties of
nominal, rank order and known distance between
two intervals but doesn't have an absolute zero
(In social sciences, many scales start from an
arbitrary point such as a minimum threshold –
minimum wage, poverty line, IQ etc)
□ Ratio variables: have all properties of nominal,
rank order, known distance between two values
and have an absolute zero value. Ex. age,
income, velocity etc.
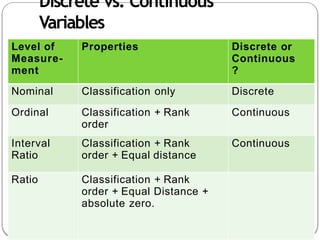
8.
Discrete vs. Continuous
Variables
Levelof
Measure-
ment
Properties Discrete or
Continuous
?
Nominal Classification only Discrete
Ordinal Classification + Rank
order
Continuous
Interval
Ratio
Classification + Rank
order + Equal distance
Continuous
Ratio Classification + Rank
order + Equal Distance +
absolute zero.
9.
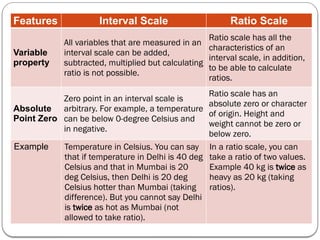
Features Interval ScaleRatio Scale
Variable
property
All variables that are measured in an
interval scale can be added,
subtracted, multiplied but calculating
ratio is not possible.
Ratio scale has all the
characteristics of an
interval scale, in addition,
to be able to calculate
ratios.
Absolute
Point Zero
Zero point in an interval scale is
arbitrary. For example, a temperature
can be below 0-degree Celsius and
in negative.
Ratio scale has an
absolute zero or character
of origin. Height and
weight cannot be zero or
below zero.
Example Temperature in Celsius. You can say
that if temperature in Delhi is 40 deg
Celsius and that in Mumbai is 20
deg Celsius, then Delhi is 20 deg
Celsius hotter than Mumbai (taking
difference). But you cannot say Delhi
is twice as hot as Mumbai (not
allowed to take ratio).
In a ratio scale, you can
take a ratio of two values.
Example 40 kg is twice as
heavy as 20 kg (taking
ratios).
10.
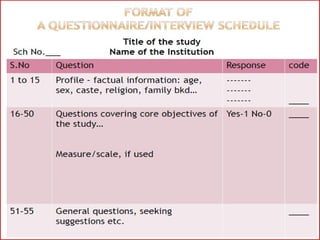
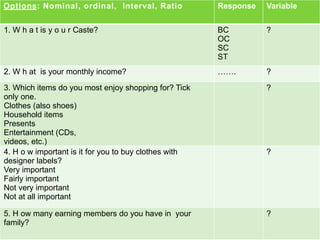
Options: Nominal, ordinal,Interval, Ratio Response Variable
1. W h a t is y o u r Caste? BC
OC
SC
ST
?
2. W h at is your monthly income? ……. ?
3. Which items do you most enjoy shopping for? Tick
only one.
Clothes (also shoes)
Household items
Presents
Entertainment (CDs,
videos, etc.)
?
4. H o w important is it for you to buy clothes with
designer labels?
Very important
Fairly important
Not very important
Not at all important
?
5. H ow many earning members do you have in your
family?
?
11.
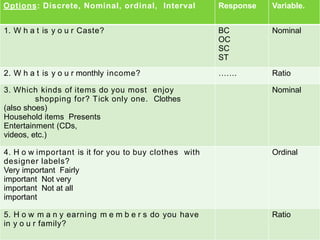
Options: Discrete, Nominal,ordinal, Interval Response Variable.
1. W h a t is y o u r Caste? BC
OC
SC
ST
Nominal
2. W h a t is y o u r monthly income? ……. Ratio
3. Which kinds of items do you most enjoy
shopping for? Tick only one. Clothes
(also shoes)
Household items Presents
Entertainment (CDs,
videos, etc.)
Nominal
4. H o w important is it for you to buy clothes with
designer labels?
Very important Fairly
important Not very
important Not at all
important
Ordinal
5. H o w m a n y earning m e m b e r s do you have
in y o u r family?
Ratio
12.
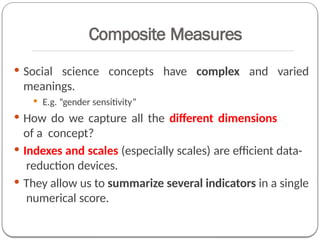
Composite Measures
Socialscience concepts have complex and varied
meanings.
E.g. “gender sensitivity”
How do we capture all the different dimensions
of a concept?
Indexes and scales (especially scales) are efficient data-
reduction devices.
They allow us to summarize several indicators in a single
numerical score.
13.
Composite Measure
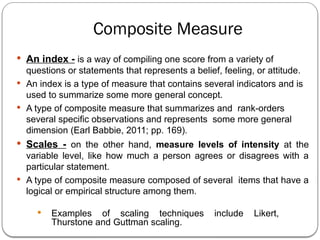
Anindex - is a way of compiling one score from a variety of
questions or statements that represents a belief, feeling, or attitude.
An index is a type of measure that contains several indicators and is
used to summarize some more general concept.
A type of composite measure that summarizes and rank-orders
several specific observations and represents some more general
dimension (Earl Babbie, 2011; pp. 169).
Scales - on the other hand, measure levels of intensity at the
variable level, like how much a person agrees or disagrees with a
particular statement.
A type of composite measure composed of several items that have a
logical or empirical structure among them.
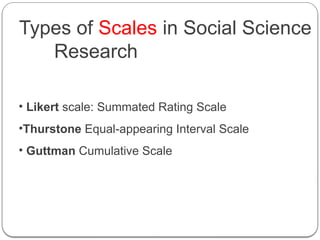
Examples of scaling techniques include Likert,
Thurstone and Guttman scaling.
14.
Index
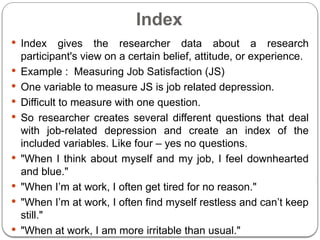
Index givesthe researcher data about a research
participant's view on a certain belief, attitude, or experience.
Example : Measuring Job Satisfaction (JS)
One variable to measure JS is job related depression.
Difficult to measure with one question.
So researcher creates several different questions that deal
with job-related depression and create an index of the
included variables. Like four – yes no questions.
"When I think about myself and my job, I feel downhearted
and blue."
"When I’m at work, I often get tired for no reason."
"When I’m at work, I often find myself restless and can’t keep
still."
"When at work, I am more irritable than usual."
15.
Index
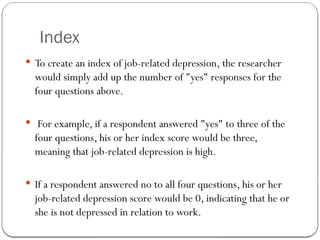
To createan index of job-related depression, the researcher
would simply add up the number of "yes" responses for the
four questions above.
For example, if a respondent answered "yes" to three of the
four questions, his or her index score would be three,
meaning that job-related depression is high.
If a respondent answered no to all four questions, his or her
job-related depression score would be 0, indicating that he or
she is not depressed in relation to work.
17.
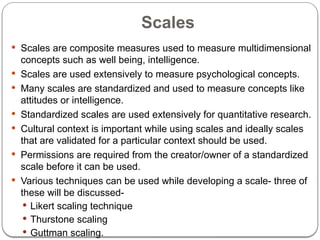
Scales
Scales arecomposite measures used to measure multidimensional
concepts such as well being, intelligence.
Scales are used extensively to measure psychological concepts.
Many scales are standardized and used to measure concepts like
attitudes or intelligence.
Standardized scales are used extensively for quantitative research.
Cultural context is important while using scales and ideally scales
that are validated for a particular context should be used.
Permissions are required from the creator/owner of a standardized
scale before it can be used.
Various techniques can be used while developing a scale- three of
these will be discussed-
Likert scaling technique
Thurstone scaling
Guttman scaling.
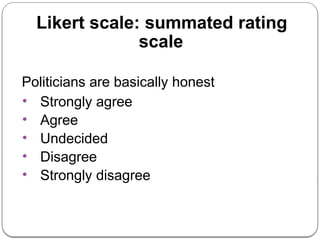
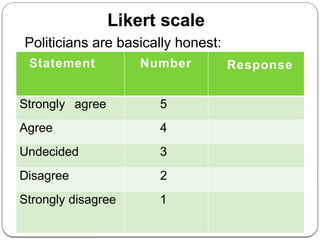
Statement Number Response
Stronglyagree 5
Agree 4
Undecided 3
Disagree 2
Strongly disagree 1
Likert scale
Politicians are basically honest:
22.
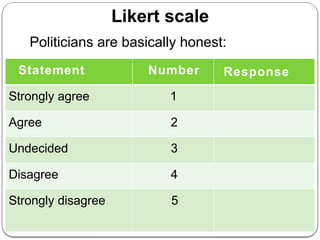
Statement Number Response
Stronglyagree 1
Agree 2
Undecided 3
Disagree 4
Strongly disagree 5
Politicians are basically honest:
Likert scale
23.
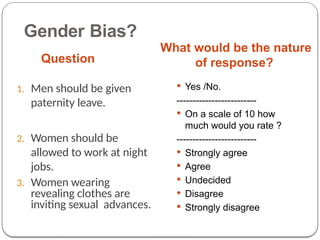
Gender Bias?
Question
What wouldbe the nature
of response?
1. Men should be given
paternity leave.
2. Women should be
allowed to work at night
jobs.
3. Women wearing
revealing clothes are
inviting sexual advances.
Yes /No.
-------------------------
On a scale of 10 how
much would you rate ?
-------------------------
Strongly agree
Agree
Undecided
Disagree
Strongly disagree
24.
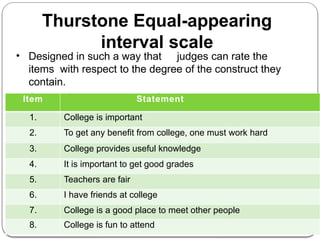
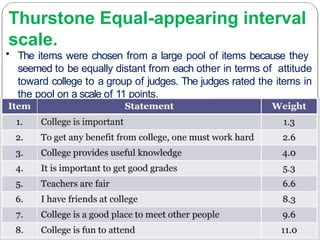
Thurstone Equal-appearing
interval scale
•Designed in such a way that judges can rate the
items with respect to the degree of the construct they
contain.
• Chosen from a large pool of items.
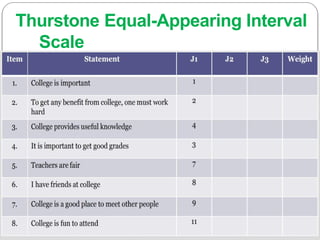
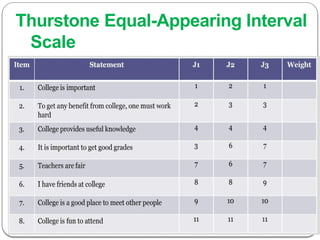
Item Statement
1. College is important
2. To get any benefit from college, one must work hard
3. College provides useful knowledge
4. It is important to get good grades
5. Teachers are fair
6. I have friends at college
7. College is a good place to meet other people
8. College is fun to attend
25.
Thurstone Equal-Appearing Interval
Scale
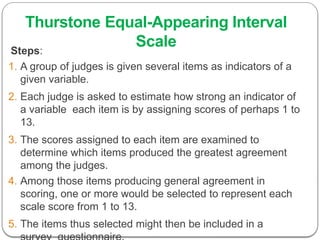
Steps:
1.A group of judges is given several items as indicators of a
given variable.
2. Each judge is asked to estimate how strong an indicator of
a variable each item is by assigning scores of perhaps 1 to
13.
3. The scores assigned to each item are examined to
determine which items produced the greatest agreement
among the judges.
4. Among those items producing general agreement in
scoring, one or more would be selected to represent each
scale score from 1 to 13.
5. The items thus selected might then be included in a
Thurstone Equal-appearing interval
scale.
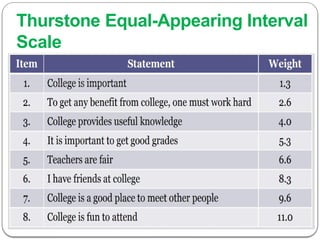
•The items were chosen from a large pool of items because they
seemed to be equally distant from each other in terms of attitude
toward college to a group of judges. The judges rated the items in
the pool on a scale of 11 points.
30.
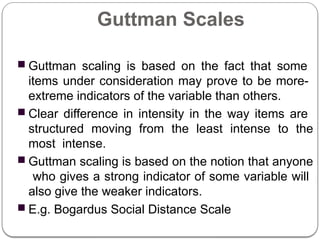
Guttman Scales
■ Guttmanscaling is based on the fact that some
items under consideration may prove to be more-
extreme indicators of the variable than others.
■ Clear difference in intensity in the way items are
structured moving from the least intense to the
most intense.
■ Guttman scaling is based on the notion that anyone
who gives a strong indicator of some variable will
also give the weaker indicators.
■ E.g. Bogardus Social Distance Scale
31.
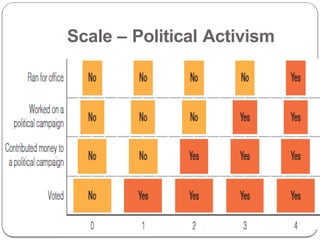
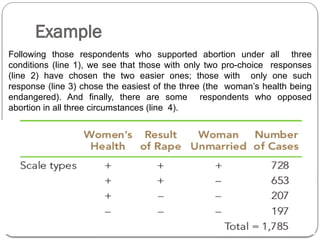
Example
Following those respondentswho supported abortion under all three
conditions (line 1), we see that those with only two pro-choice responses
(line 2) have chosen the two easier ones; those with only one such
response (line 3) chose the easiest of the three (the woman’s health being
endangered). And finally, there are some respondents who opposed
abortion in all three circumstances (line 4).
32.
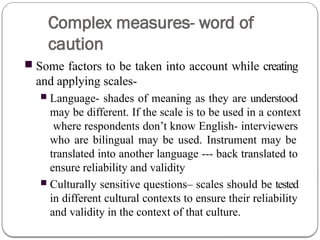
Complex measures- wordof
caution
■ Some factors to be taken into account while creating
and applying scales-
■ Language- shades of meaning as they are understood
may be different. If the scale is to be used in a context
where respondents don’t know English- interviewers
who are bilingual may be used. Instrument may be
translated into another language --- back translated to
ensure reliability and validity
■ Culturally sensitive questions– scales should be tested
in different cultural contexts to ensure their reliability
and validity in the context of that culture.
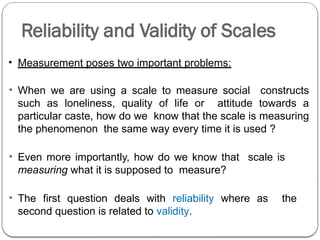
Reliability and Validityof Scales
• Measurement poses two important problems:
• When we are using a scale to measure social constructs
such as loneliness, quality of life or attitude towards a
particular caste, how do we know that the scale is measuring
the phenomenon the same way every time it is used ?
• Even more importantly, how do we know that scale is
measuring what it is supposed to measure?
• The first question deals with reliability where as the
second question is related to validity.
35.
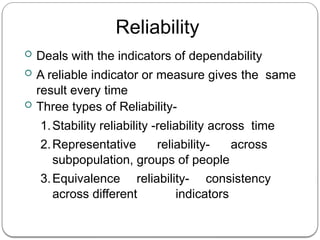
Reliability
Deals withthe indicators of dependability
A reliable indicator or measure gives the same
result every time
Three types of Reliability-
1.Stability reliability -reliability across time
2.Representative reliability- across
subpopulation, groups of people
3.Equivalence reliability- consistency
across different indicators
36.
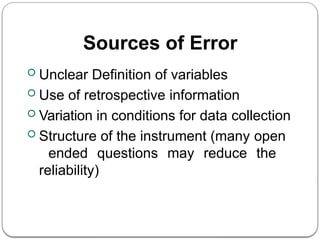
Sources of Error
Unclear Definition of variables
Use of retrospective information
Variation in conditions for data collection
Structure of the instrument (many open
ended questions may reduce the
reliability)
37.
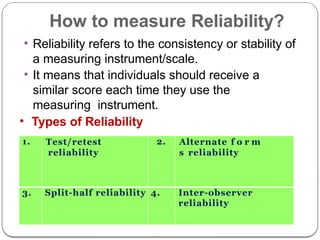
How to measureReliability?
• Reliability refers to the consistency or stability of
a measuring instrument/scale.
• It means that individuals should receive a
similar score each time they use the
measuring instrument.
• Types of Reliability
1. Test/retest
reliability
2. Alternate f o r m
s reliability
3. Split-half reliability 4. Inter-observer
reliability
38.
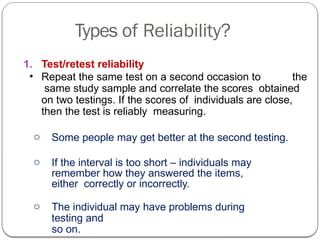
Types of Reliability?
1.Test/retest reliability
• Repeat the same test on a second occasion to the
same study sample and correlate the scores obtained
on two testings. If the scores of individuals are close,
then the test is reliably measuring.
o Some people may get better at the second testing.
o If the interval is too short – individuals may
remember how they answered the items,
either correctly or incorrectly.
o The individual may have problems during
testing and
so on.
39.
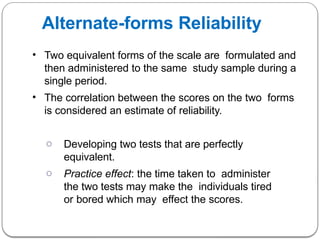
Alternate-forms Reliability
• Twoequivalent forms of the scale are formulated and
then administered to the same study sample during a
single period.
• The correlation between the scores on the two forms
is considered an estimate of reliability.
o Developing two tests that are perfectly
equivalent.
o Practice effect: the time taken to administer
the two tests may make the individuals tired
or bored which may effect the scores.
40.
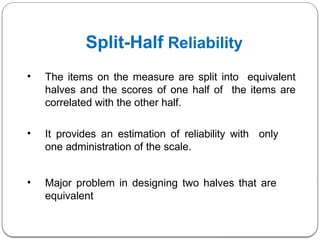
Split-Half Reliability
• Theitems on the measure are split into equivalent
halves and the scores of one half of the items are
correlated with the other half.
• It provides an estimation of reliability with only
one administration of the scale.
• Major problem in designing two halves that are
equivalent
41.
Inter-Observer Reliability
Comparingadministration of an
instrument done by different observers
or interviewers
The observers need to be thoroughly
trained
At least two people will code the content of
the responses according to certain
criterion
42.
Validity
• Validity isdefined as ‘the degree to which a scale
measures what it says it measures’.
• In addition to being reliable, a measure/scale
should also be valid.
• There are three fundamental approaches to
understand validity.
1. Face Validity
2. Content validity
3. Construct validity
4. Criterion-related validity
43.
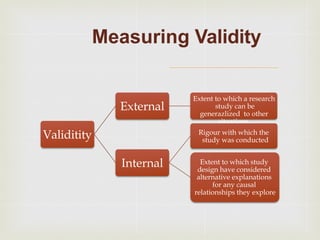
Validitity
External
Extent to whicha research
study can be
generazlized to other
situations.
Internal
Rigour with which the
study was conducted
Extent to which study
design have considered
alternative explanations
for any causal
relationships they explore
Measuring Validity
44.
Face Validity
Theeasiest type of validity to achieve and most
basic
It is the judgment by the scientific community
that the indicator really measures the
construct
45.
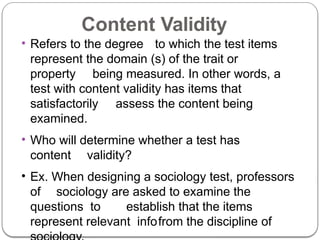
Content Validity
• Refersto the degree to which the test items
represent the domain (s) of the trait or
property being measured. In other words, a
test with content validity has items that
satisfactorily assess the content being
examined.
• Who will determine whether a test has
content validity?
• Ex. When designing a sociology test, professors
of sociology are asked to examine the
questions to establish that the items
represent relevant infofrom the discipline of
46.
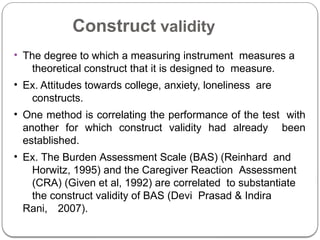
Construct validity
• Thedegree to which a measuring instrument measures a
theoretical construct that it is designed to measure.
• Ex. Attitudes towards college, anxiety, loneliness are
constructs.
• One method is correlating the performance of the test with
another for which construct validity had already been
established.
• Ex. The Burden Assessment Scale (BAS) (Reinhard and
Horwitz, 1995) and the Caregiver Reaction Assessment
(CRA) (Given et al, 1992) are correlated to substantiate
the construct validity of BAS (Devi Prasad & Indira
Rani, 2007).
47.
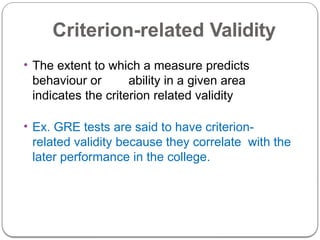
Criterion-related Validity
• Theextent to which a measure predicts
behaviour or ability in a given area
indicates the criterion related validity
• Ex. GRE tests are said to have criterion-
related validity because they correlate with the
later performance in the college.
48.
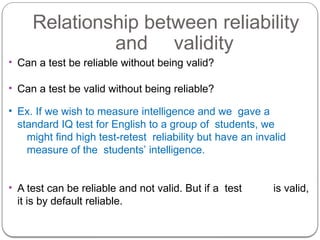
Relationship between reliability
andvalidity
• Can a test be reliable without being valid?
• Can a test be valid without being reliable?
• Ex. If we wish to measure intelligence and we gave a
standard IQ test for English to a group of students, we
might find high test-retest reliability but have an invalid
measure of the students’ intelligence.
• A test can be reliable and not valid. But if a test is valid,
it is by default reliable.
49.
References
• Given, C.W.et al. (1992). The caregiver reaction assessment for caregivers to
persons with chronic physical and mental impairments. Research in Nursing
and Health, 15: 271-83.
• Reinhard, S.C and Horwitz, A.V. (1995). Caregiver burden: Differentiating the
content and consequences of family care giving. Journal of Marriage and the
Family, 57: 741-50.
• Devi Prasad, B and Indira Rani, N (2007). Older persons, caregiver burden and
satisfaction in rural family context. Indian Journal of Gerontology, 21 (2): 216-
232.
• Newton, R.R (1999). Your statistical consultant- answers to your data
analysis questions, New Delhi: Sage.
• Jackson, S.L. (2009). Research methods and statistics- a critical thinking
approach, Belmont, CA: Wadsworth.
• Spanier, G.B.(1976). Measuring dyadic adjustment. New scales for assessing the
quality of marriage and similar dyads. JMF, 38(1):15-28.
• Busby, D.M. et al.(1995). A revision of the dyadic adjustment scale for use with
distressed and non-distressed couples: Construct hierarchy and multidimensional
scales. JMF, 21(3):289-308.