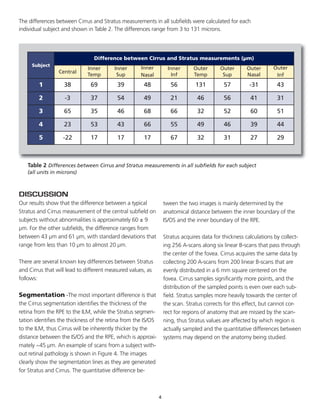
1
abnormalities and five subjects with known retinal abnor-
malities. We hope this will pave the way for us to under-
stand the sources of the differences. Future studies will
provide the means to enable quantitative conversions that
will allow measurements to be easily interpreted between
the two systems.
METHODS
We reviewed the scans of subjects with no known retinal
abnormalities imaged in a single session with both the
Stratus and the Cirrus during an in-house CZMI study. The
Bascom Palmer Eye Institute provided retrospective Stratus
and Cirrus data from several subjects with known retinal
abnormalities enrolled in a separate study.
Retinal Measurements:
Comparison Between Cirrus HD-OCT and Stratus OCT
Mary Durbin PhD, Teresa Abunto MD, Margaret Chang MD, Brandon Lujan MD
INTRODUCTION
Carl Zeiss Meditec Inc. (CZMI) manufactures and distrib-
utes the Stratus OCT, an optical coherence tomography
(OCT) instrument that uses a beam of light to rapidly scan
the eye and provides a very detailed cross-sectional image
of various retinal structures of the eye. It is currently the
standard of care for aiding in the diagnosis and monitor-
ing of a variety of ophthalmic diseases.1-6
CZMI has also developed a spectral domain optical coher-
ence tomography (SD-OCT) instrument that incorporates
aspects of the Stratus OCT. Named the Cirrus HD-OCT, it
has a scanning beam very similar to the Stratus OCT but
with better axial resolution and a higher scanning speed
(50x faster) allowing for scanning of a much greater area
of the retina.
The Cirrus HD-OCT system was recently released with
Macular Thickness Analysis package (software version
2.0). Both the Stratus and Cirrus systems image retinal
anatomy and identify the retinal layers by using segmen-
tation algorithms to mark the internal limiting membrane
(ILM), the inner segment/outer segment junction (IS/OS)
for Stratus and the retinal pigment epithelium (RPE) in
Cirrus. From these layer positions the instruments calcu-
late retinal thickness and summarize the thickness results
according to the Age Related Eye Disease Study (AREDS)
subfields, as shown in Figure 1.7
Because both systems report values in the same manner, it
is essential to understand any differences between the ac-
tual values measured. In order to understand these differ-
ences, we reviewed study records of subjects scanned
with both Cirrus and Stratus instruments. We now report
our preliminary findings on eleven subjects without retinal
Fig. 1 AREDS grid used for reporting retinal
thickness in both Cirrus and Stratus OCT systems.
All images obtained were reviewed for quality. Those with
signal strength of 5 and below were excluded. Also ex-
cluded were cases where the segmentation algorithm
could not identify the layers thus preventing a meaningful
thickness map from being generated.
Stratus data was processed using the Beta release of soft-
ware version 5.0. Cirrus data was processed using the 2.0
release of the Macular Thickness Analysis package. Aver-
age thickness in nine retinal subfields were calculated and
compared for both Stratus and Cirrus. Data were com-
pared qualitatively and quantitatively. By reviewing the
segmented layers with the OCT image outputs, we at-
tempted to evaluate the primary and secondary reason for
any differences in measured average retinal thickness.
2
Measurement Area Stratus 5.0 (SD)
(µm)
Cirrus 2.0 (SD)
(µm)
Mean Paired
Difference (SD)(µm)
Central 198.10 (17.3) 258.08 (16.8) 60.0 (9.0)
Outer Temporal 221.87 (20.3) 267.92 (17.0) 47.4 (10.2)
Outer Superior 242.48 (17.3) 288.42 (16.5) 47.5 (6.8)
Outer Nasal 262.98 (25.6) 309.17 (18.9) 46.9 (14.3)
Outer Inferior 236.65 (20.5) 278.83 (19.9) 43.7 (7.9)
Inner Temporal 265.67 (22.7) 320.08 (15.2) 54.5 (16.8)
Inner Superior 279.63 (15.3) 332.33 (14.4) 53.0 (10.2)
Inner Nasal 275.93 (23.9) 335.83 (12.6) 61.1 (19.6)
Inner Inferior 279.11 (16.8) 330.67 (15.9) 52.9 (11.6)
RESULTS
Subjects without retinal abnormalities
The mean retinal thickness values for each instrument and the mean difference and standard deviation for paired data
are shown in table 1.
Table 1 Mean and standard deviation for each subfield. All units are in microns (µm).
Differences between the Stratus and
the Cirrus average retinal thickness
measurements range from 43.7 to
61.1 microns, with the difference
being more pronounced in the central
and inner nasal subfields. A Bland Alt-
man plot was generated for the cen-
tral subfield differences, as seen in the
figure 2. This shows that in all sub-
jects, the differences were all within a
40 to 80 micron range.
Subjects with Retinal
Abnormalities
Due to the varying anatomical
configuration of subjects with retinal
abnormalities, mean thickness meas-
urements calculation across the sub-
ject population was not done. The
graphical representation shown
below highlights the differences from
subject to subject.
3
0
20
40
60
80
100
170 190 210 230 250 270
Average (Microns)
Difference(Cirrus-Stratus,inmicrons)
Fig. 2 Bland Altman plot comparing Stratus central subfield
thickness measurements to Cirrus 2.0
Fig. 3 Average retinal thickness in the central subfield for all
abnormal subjects
296
258
281 284
478
413
217
194
478
500
600
500
400
300
200
100
0
Subject 1 Subject 2 Subject 3 Subject 4 Subject 5
Cirrus 2.0
Stratus 5.0
CentralFieldThickness(Microns)
DISCUSSION
Our results show that the difference between a typical
Stratus and Cirrus measurement of the central subfield on
subjects without abnormalities is approximately 60 ± 9
µm. For the other subfields, the difference ranges from
between 43 µm and 61 µm, with standard deviations that
range from less than 10 µm to almost 20 µm.
There are several known key differences between Stratus
and Cirrus that will lead to different measured values, as
follows:
Segmentation -The most important difference is that
the Cirrus segmentation identifies the thickness of the
retina from the RPE to the ILM, while the Stratus segmen-
tation identifies the thickness of the retina from the IS/OS
to the ILM, thus Cirrus will be inherently thicker by the
distance between the IS/OS and the RPE, which is approxi-
mately ~45 µm. An example of scans from a subject with-
out retinal pathology is shown in Figure 4. The images
clearly show the segmentation lines as they are generated
for Stratus and Cirrus. The quantitative difference be-
tween the two images is mainly determined by the
anatomical distance between the inner boundary of the
IS/OS and the inner boundary of the RPE.
Stratus acquires data for thickness calculations by collect-
ing 256 A-scans along six linear B-scans that pass through
the center of the fovea. Cirrus acquires the same data by
collecting 200 A-scans from 200 linear B-scans that are
evenly distributed in a 6 mm square centered on the
fovea. Cirrus samples significantly more points, and the
distribution of the sampled points is even over each sub-
field. Stratus samples more heavily towards the center of
the scan. Stratus corrects for this effect, but cannot cor-
rect for regions of anatomy that are missed by the scan-
ning, thus Stratus values are affected by which region is
actually sampled and the quantitative differences between
systems may depend on the anatomy being studied.
4
The differences between Cirrus and Stratus measurements in all subfields were calculated for each
individual subject and shown in Table 2. The differences range from 3 to 131 microns.
Subject
Difference between Cirrus and Stratus measurements (µm)
Central
Inner
Temp
Inner
Sup
Inner
Nasal
Inner
Inf
Outer
Temp
Outer
Sup
Outer
Nasal
Outer
Inf
1 38 69 39 48 56 131 57 -31 43
2 -3 37 54 49 21 46 56 41 31
3 65 35 46 68 66 32 52 60 51
4 23 53 43 66 55 49 46 39 44
5 -22 17 17 17 67 32 31 27 29
Table 2 Differences between Cirrus and Stratus measurements in all subfields for each subject
(all units in microns)
Axial Resolution and Calibration – The effect
of these differences are expected to be negligible. Cirrus
has improved axial resolution over Stratus. However, this is
not expected to affect the measured thickness values.
Calibration in the axial and lateral directions between the
two systems are expected to be the same to within 1%,
so we do not expect calibration differences to contribute
to differences between Cirrus and Stratus in excess of the
expected differences between one Stratus and another.
The comparison between Stratus and Cirrus measure-
ments of the central subfield on subject with abnormali-
ties is not as straightforward as for subjects without
abnormalities. In some subjects, the difference is entirely
the same as for normals. When the IS/OS is not visible due
to pathology, both systems may find a similar boundary,
and the difference is reduced (Fig. 10). Also, in subjects
with drusen (Fig. 9), the thickness may be dominated by
the pathology, and the difference in thickness found by
the two segmentation strategies will be reduced. The fig-
ures 6-10 show the scans and maps of the subjects with
retinal abnormalities.
5
Fig. 4 Horizontal B-scan through the fovea for a subject with no retinal pathology imaged on the same
day on Stratus (left) and Cirrus (right).
Subfield Averaging - Another impor-
tant difference between the Cirrus and Stratus
reported values arises because the two systems
of necessity sample the retina in two different
ways, which are illustrated in Figure 5.
Fig. 5 Illustration of how Cirrus and
Stratus samples the retina differently.
Cirrus sampling is on the left, and Stratus
is on the right.
6
Fig. 6 Cirrus (top row) and Stratus (bottom row) scans and maps of a subject with non-neovascular Age re-
lated Macular Degeneration (AMD) with epiretinal membrane.
Fig. 7 Cirrus (top row) and Stratus (bottom row) scans and maps of a subject with noeovascular AMD.
ILM-RPE Thickness (µm)
7
Fig. 8 Cirrus (top row) and Stratus (bottom row) scans and maps of a subject with epiretinal
membrane and macular edema.
Fig. 9 Cirrus (top row) and Stratus (bottom row) scans and maps of a subject with drusen.
ILM-RPE Thickness (µm)
REFERENCES
1. Jaffe G, Caprioli C. Optical Coherence Tomography to Detect and Manage Retinal Disease and Glaucoma. Am J Ophthal. 2004 Jan; 137(1): 156-169.
2. Otani T, Kishi S, Maruyama Y. Patterns of Diabetic Macular Edema with Optical Coherence Tomography. Am J Ophthal 1999 June;127(6):688-693.
3. Haouchine B, Massin P, Tadayoni R, Erginay A, Gaudric A. Diagnosis of macular pseudoholes and lamellar macular holes by optical
coherence tomography. Am J Ophthalmol 2004 Nov;138(5):732-9.
4. Sanchez-Tocino H, Valdez-Vidal A, Maldonado M, Moreno-Montanes J, Garcia –Layana A. Retinal Thickness Study with Optical
Coherence Tomography in Patients with Diabetes. Inves Ophthal Visc Sci 2002 Oct;43:1588-1594.
5. Polito A, Napolitano MC, Bandello F, Chiodini R. The Role of Optical Coherence Tomography in the Diagnosis and Management of
Retinal Angiomatous Proliferation (RAP) in Patients with Age-related Macular Degeneration. Ann Acad Med 2006 June; 35(6):420-424.
6. Puliafito C, Hee M, Schuman J, Fujimoto J. Optical Coherence Tomography of Ocular Diseases. 1996, Slack Inc., Thorofare, NJ.
7. Age-Related Eye Disease Study Group. The Age-Related Eye Disease Study Sevberity Scale for Age Related Macular Degenration: Areds Report No. 17.
Arch Ophthalmol. 2005 Nov; 123 (11) 1484-1498.
8. Gregori G, Knighton R.W., Jiao S, et al. 3-D OCT Maps of Retinal Pathologies. Invest. Ophthalmol. Vis. Sci. 46: E-Abstract 1055 (2005).
CONCLUSION
For subjects without retinal abnormalities, Stratus OCT data can be related to Cirrus HD-OCT data by a linear
formula. For abnormal subjects, the relationship between subfields may vary according to pathology. When
comparing Cirrus data to Stratus data, it is essential to examine carefully the OCT tomograms and to look at
the morphology. Any reported quantitative changes should be confirmed by looking at the images.
Fig. 10 Cirrus (top row) and Stratus (bottom row) scans and maps of a subject with Central Retinal Vein
Occlusion (CRVO) and macular edema.
Carl Zeiss Meditec Inc.
5160 Hacienda Drive
Dublin, CA 94568
USA
Phone: 1-800-342-9821
Fax: 1-925-557-4101
info@meditec.zeiss.com
www.meditec.zeiss.com
RET.1672
©2007,CarlZeissMeditec,Inc.Allrightsreserved.Specificationssubjecttochange.PrintedinUSA.11071M
ILM-RPE Thickness (µm)

RETINAL MESURAMENTS

  • 1.
    1 abnormalities and fivesubjects with known retinal abnor- malities. We hope this will pave the way for us to under- stand the sources of the differences. Future studies will provide the means to enable quantitative conversions that will allow measurements to be easily interpreted between the two systems. METHODS We reviewed the scans of subjects with no known retinal abnormalities imaged in a single session with both the Stratus and the Cirrus during an in-house CZMI study. The Bascom Palmer Eye Institute provided retrospective Stratus and Cirrus data from several subjects with known retinal abnormalities enrolled in a separate study. Retinal Measurements: Comparison Between Cirrus HD-OCT and Stratus OCT Mary Durbin PhD, Teresa Abunto MD, Margaret Chang MD, Brandon Lujan MD INTRODUCTION Carl Zeiss Meditec Inc. (CZMI) manufactures and distrib- utes the Stratus OCT, an optical coherence tomography (OCT) instrument that uses a beam of light to rapidly scan the eye and provides a very detailed cross-sectional image of various retinal structures of the eye. It is currently the standard of care for aiding in the diagnosis and monitor- ing of a variety of ophthalmic diseases.1-6 CZMI has also developed a spectral domain optical coher- ence tomography (SD-OCT) instrument that incorporates aspects of the Stratus OCT. Named the Cirrus HD-OCT, it has a scanning beam very similar to the Stratus OCT but with better axial resolution and a higher scanning speed (50x faster) allowing for scanning of a much greater area of the retina. The Cirrus HD-OCT system was recently released with Macular Thickness Analysis package (software version 2.0). Both the Stratus and Cirrus systems image retinal anatomy and identify the retinal layers by using segmen- tation algorithms to mark the internal limiting membrane (ILM), the inner segment/outer segment junction (IS/OS) for Stratus and the retinal pigment epithelium (RPE) in Cirrus. From these layer positions the instruments calcu- late retinal thickness and summarize the thickness results according to the Age Related Eye Disease Study (AREDS) subfields, as shown in Figure 1.7 Because both systems report values in the same manner, it is essential to understand any differences between the ac- tual values measured. In order to understand these differ- ences, we reviewed study records of subjects scanned with both Cirrus and Stratus instruments. We now report our preliminary findings on eleven subjects without retinal Fig. 1 AREDS grid used for reporting retinal thickness in both Cirrus and Stratus OCT systems.
  • 2.
    All images obtainedwere reviewed for quality. Those with signal strength of 5 and below were excluded. Also ex- cluded were cases where the segmentation algorithm could not identify the layers thus preventing a meaningful thickness map from being generated. Stratus data was processed using the Beta release of soft- ware version 5.0. Cirrus data was processed using the 2.0 release of the Macular Thickness Analysis package. Aver- age thickness in nine retinal subfields were calculated and compared for both Stratus and Cirrus. Data were com- pared qualitatively and quantitatively. By reviewing the segmented layers with the OCT image outputs, we at- tempted to evaluate the primary and secondary reason for any differences in measured average retinal thickness. 2 Measurement Area Stratus 5.0 (SD) (µm) Cirrus 2.0 (SD) (µm) Mean Paired Difference (SD)(µm) Central 198.10 (17.3) 258.08 (16.8) 60.0 (9.0) Outer Temporal 221.87 (20.3) 267.92 (17.0) 47.4 (10.2) Outer Superior 242.48 (17.3) 288.42 (16.5) 47.5 (6.8) Outer Nasal 262.98 (25.6) 309.17 (18.9) 46.9 (14.3) Outer Inferior 236.65 (20.5) 278.83 (19.9) 43.7 (7.9) Inner Temporal 265.67 (22.7) 320.08 (15.2) 54.5 (16.8) Inner Superior 279.63 (15.3) 332.33 (14.4) 53.0 (10.2) Inner Nasal 275.93 (23.9) 335.83 (12.6) 61.1 (19.6) Inner Inferior 279.11 (16.8) 330.67 (15.9) 52.9 (11.6) RESULTS Subjects without retinal abnormalities The mean retinal thickness values for each instrument and the mean difference and standard deviation for paired data are shown in table 1. Table 1 Mean and standard deviation for each subfield. All units are in microns (µm).
  • 3.
    Differences between theStratus and the Cirrus average retinal thickness measurements range from 43.7 to 61.1 microns, with the difference being more pronounced in the central and inner nasal subfields. A Bland Alt- man plot was generated for the cen- tral subfield differences, as seen in the figure 2. This shows that in all sub- jects, the differences were all within a 40 to 80 micron range. Subjects with Retinal Abnormalities Due to the varying anatomical configuration of subjects with retinal abnormalities, mean thickness meas- urements calculation across the sub- ject population was not done. The graphical representation shown below highlights the differences from subject to subject. 3 0 20 40 60 80 100 170 190 210 230 250 270 Average (Microns) Difference(Cirrus-Stratus,inmicrons) Fig. 2 Bland Altman plot comparing Stratus central subfield thickness measurements to Cirrus 2.0 Fig. 3 Average retinal thickness in the central subfield for all abnormal subjects 296 258 281 284 478 413 217 194 478 500 600 500 400 300 200 100 0 Subject 1 Subject 2 Subject 3 Subject 4 Subject 5 Cirrus 2.0 Stratus 5.0 CentralFieldThickness(Microns)
  • 4.
    DISCUSSION Our results showthat the difference between a typical Stratus and Cirrus measurement of the central subfield on subjects without abnormalities is approximately 60 ± 9 µm. For the other subfields, the difference ranges from between 43 µm and 61 µm, with standard deviations that range from less than 10 µm to almost 20 µm. There are several known key differences between Stratus and Cirrus that will lead to different measured values, as follows: Segmentation -The most important difference is that the Cirrus segmentation identifies the thickness of the retina from the RPE to the ILM, while the Stratus segmen- tation identifies the thickness of the retina from the IS/OS to the ILM, thus Cirrus will be inherently thicker by the distance between the IS/OS and the RPE, which is approxi- mately ~45 µm. An example of scans from a subject with- out retinal pathology is shown in Figure 4. The images clearly show the segmentation lines as they are generated for Stratus and Cirrus. The quantitative difference be- tween the two images is mainly determined by the anatomical distance between the inner boundary of the IS/OS and the inner boundary of the RPE. Stratus acquires data for thickness calculations by collect- ing 256 A-scans along six linear B-scans that pass through the center of the fovea. Cirrus acquires the same data by collecting 200 A-scans from 200 linear B-scans that are evenly distributed in a 6 mm square centered on the fovea. Cirrus samples significantly more points, and the distribution of the sampled points is even over each sub- field. Stratus samples more heavily towards the center of the scan. Stratus corrects for this effect, but cannot cor- rect for regions of anatomy that are missed by the scan- ning, thus Stratus values are affected by which region is actually sampled and the quantitative differences between systems may depend on the anatomy being studied. 4 The differences between Cirrus and Stratus measurements in all subfields were calculated for each individual subject and shown in Table 2. The differences range from 3 to 131 microns. Subject Difference between Cirrus and Stratus measurements (µm) Central Inner Temp Inner Sup Inner Nasal Inner Inf Outer Temp Outer Sup Outer Nasal Outer Inf 1 38 69 39 48 56 131 57 -31 43 2 -3 37 54 49 21 46 56 41 31 3 65 35 46 68 66 32 52 60 51 4 23 53 43 66 55 49 46 39 44 5 -22 17 17 17 67 32 31 27 29 Table 2 Differences between Cirrus and Stratus measurements in all subfields for each subject (all units in microns)
  • 5.
    Axial Resolution andCalibration – The effect of these differences are expected to be negligible. Cirrus has improved axial resolution over Stratus. However, this is not expected to affect the measured thickness values. Calibration in the axial and lateral directions between the two systems are expected to be the same to within 1%, so we do not expect calibration differences to contribute to differences between Cirrus and Stratus in excess of the expected differences between one Stratus and another. The comparison between Stratus and Cirrus measure- ments of the central subfield on subject with abnormali- ties is not as straightforward as for subjects without abnormalities. In some subjects, the difference is entirely the same as for normals. When the IS/OS is not visible due to pathology, both systems may find a similar boundary, and the difference is reduced (Fig. 10). Also, in subjects with drusen (Fig. 9), the thickness may be dominated by the pathology, and the difference in thickness found by the two segmentation strategies will be reduced. The fig- ures 6-10 show the scans and maps of the subjects with retinal abnormalities. 5 Fig. 4 Horizontal B-scan through the fovea for a subject with no retinal pathology imaged on the same day on Stratus (left) and Cirrus (right). Subfield Averaging - Another impor- tant difference between the Cirrus and Stratus reported values arises because the two systems of necessity sample the retina in two different ways, which are illustrated in Figure 5. Fig. 5 Illustration of how Cirrus and Stratus samples the retina differently. Cirrus sampling is on the left, and Stratus is on the right.
  • 6.
    6 Fig. 6 Cirrus(top row) and Stratus (bottom row) scans and maps of a subject with non-neovascular Age re- lated Macular Degeneration (AMD) with epiretinal membrane. Fig. 7 Cirrus (top row) and Stratus (bottom row) scans and maps of a subject with noeovascular AMD. ILM-RPE Thickness (µm) ILM-RPE Thickness (µm)
  • 7.
    7 Fig. 8 Cirrus(top row) and Stratus (bottom row) scans and maps of a subject with epiretinal membrane and macular edema. Fig. 9 Cirrus (top row) and Stratus (bottom row) scans and maps of a subject with drusen. ILM-RPE Thickness (µm) ILM-RPE Thickness (µm)
  • 8.
    REFERENCES 1. Jaffe G,Caprioli C. Optical Coherence Tomography to Detect and Manage Retinal Disease and Glaucoma. Am J Ophthal. 2004 Jan; 137(1): 156-169. 2. Otani T, Kishi S, Maruyama Y. Patterns of Diabetic Macular Edema with Optical Coherence Tomography. Am J Ophthal 1999 June;127(6):688-693. 3. Haouchine B, Massin P, Tadayoni R, Erginay A, Gaudric A. Diagnosis of macular pseudoholes and lamellar macular holes by optical coherence tomography. Am J Ophthalmol 2004 Nov;138(5):732-9. 4. Sanchez-Tocino H, Valdez-Vidal A, Maldonado M, Moreno-Montanes J, Garcia –Layana A. Retinal Thickness Study with Optical Coherence Tomography in Patients with Diabetes. Inves Ophthal Visc Sci 2002 Oct;43:1588-1594. 5. Polito A, Napolitano MC, Bandello F, Chiodini R. The Role of Optical Coherence Tomography in the Diagnosis and Management of Retinal Angiomatous Proliferation (RAP) in Patients with Age-related Macular Degeneration. Ann Acad Med 2006 June; 35(6):420-424. 6. Puliafito C, Hee M, Schuman J, Fujimoto J. Optical Coherence Tomography of Ocular Diseases. 1996, Slack Inc., Thorofare, NJ. 7. Age-Related Eye Disease Study Group. The Age-Related Eye Disease Study Sevberity Scale for Age Related Macular Degenration: Areds Report No. 17. Arch Ophthalmol. 2005 Nov; 123 (11) 1484-1498. 8. Gregori G, Knighton R.W., Jiao S, et al. 3-D OCT Maps of Retinal Pathologies. Invest. Ophthalmol. Vis. Sci. 46: E-Abstract 1055 (2005). CONCLUSION For subjects without retinal abnormalities, Stratus OCT data can be related to Cirrus HD-OCT data by a linear formula. For abnormal subjects, the relationship between subfields may vary according to pathology. When comparing Cirrus data to Stratus data, it is essential to examine carefully the OCT tomograms and to look at the morphology. Any reported quantitative changes should be confirmed by looking at the images. Fig. 10 Cirrus (top row) and Stratus (bottom row) scans and maps of a subject with Central Retinal Vein Occlusion (CRVO) and macular edema. Carl Zeiss Meditec Inc. 5160 Hacienda Drive Dublin, CA 94568 USA Phone: 1-800-342-9821 Fax: 1-925-557-4101 info@meditec.zeiss.com www.meditec.zeiss.com RET.1672 ©2007,CarlZeissMeditec,Inc.Allrightsreserved.Specificationssubjecttochange.PrintedinUSA.11071M ILM-RPE Thickness (µm)