BEST Call Girls In Greater Noida ✨ 9773824855 ✨ Escorts Service In Delhi Ncr,
US Industrial Highlights Q3 2011
1. Q3 2011 | IndustrIal
NORTH AMERICA
HIGHLIGHTS
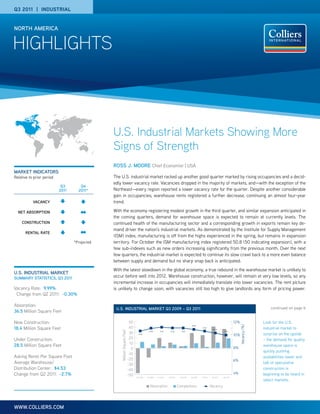
U.S. Industrial Markets Showing More
Signs of Strength
ROss J. MOORE Chief Economist | USA
MARkET INdICATORs
Relative to prior period The U.S. industrial market racked up another good quarter marked by rising occupancies and a decid-
edly lower vacancy rate. Vacancies dropped in the majority of markets, and—with the exception of the
Q3 Q4
2011 2011* Northeast—every region reported a lower vacancy rate for the quarter. Despite another considerable
gain in occupancies, warehouse rents registered a further decrease, continuing an almost four-year
VACANCy trend.
NET ABsORPTION With the economy registering modest growth in the third quarter, and similar expansion anticipated in
the coming quarters, demand for warehouse space is expected to remain at currently levels. The
CONsTRUCTION continued health of the manufacturing sector and a corresponding growth in exports remain key de-
mand driver the nation’s industrial markets. As demonstrated by the Institute for Supply Management
RENTAl RATE
(ISM) index, manufacturing is off from the highs experienced in the spring, but remains in expansion
*Projected territory. For October the ISM manufacturing index registered 50.8 (50 indicating expansion), with a
few sub-indexes such as new orders increasing significantly from the previous month. Over the next
few quarters, the industrial market is expected to continue its slow crawl back to a more even balance
between supply and demand but no sharp snap back is anticipated.
With the latest slowdown in the global economy, a true rebound in the warehouse market is unlikely to
U.s. INdUsTRIAl MARkET
sUMMARy sTATIsTICs, Q3 2011 occur before well into 2012. Warehouse construction, however, will remain at very low levels, so any
incremental increase in occupancies will immediately translate into lower vacancies. The rent picture
Vacancy Rate: 9.99% is unlikely to change soon, with vacancies still too high to give landlords any form of pricing power.
Change from Q2 2011: -0.30%
Absorption:
U.s. INdUsTRIAl MARkET Q3 2009 – Q3 2011 continued on page 6
36.5 Million Square Feet
New Construction: 50 12% Look for the U.S.
Vacancy (%)
10.80
18.4 Million Square Feet 40 10.56
10.29 industrial market to
Million Square Feet
30 10.90 11.10 11.00 11.00 9.99
surprise on the upside
10.50
10%
Under Construction: 20 – the demand for quality
10
28.5 Million Square Feet 8%
warehouse space is
0
quickly pushing
-10
Asking Rents Per Square Foot availabilities lower and
-20 6%
Average Warehouse/ -30 talk of speculative
Distribution Center: $4.53 -40 construction is
Change from Q2 2011: -2.7% -50 4% beginning to be heard in
Q3 2009 Q4 2009 Q1 2010 Q2 2010 Q3 2010 Q4 2010 Q1 2011 Q2 2011 Q3 2011
select markets.
Absorption Completions Vacancy
www.COllIERs.COM
2. hIghlIghts | Q3 2011 | INDUSTRIAL | NoRTh AmeRIcA
UNITEd sTATEs | INdUsTRIAl sURVEy
EXIsTING
INVENTORy (sF) NEw CONsTRUCTION NEw CONsTRUCTION CURRENTly UNdER
MARkET sEPT 30, 2011 Q3 2011 (sF) yTd 2011 CONsTRUCTION (sF)
NORTHEAsT
Baltimore, MD 296,297,000 212,000 334,000 212,000
Boston, MA 154,942,000 0 0 170,000
Hartford, CT 96,975,000 0 122,000 122,000
Long Island, NY 165,078,000 0 107,000 0
New Jersey - Central 357,591,000 268,000 469,000 62,000
New Jersey - Northern 375,556,000 67,000 67,000 543,000
Philadelphia, PA 403,511,000 150,000 1,759,000 568,000
Pittsburgh, PA 163,530,000 250,000 485,000 240,000
Washington DC 270,248,000 128,000 848,000 1,248,000
NORTHEAsT TOTAl 2,283,727,000 1,074,000 4,190,000 3,164,000
sOUTH
Atlanta, GA 600,801,000 470,000 2,102,000 354,000
Charleston, SC 32,067,000 10,000 285,000 10,000
Charlotte, NC 288,983,000 700,000 745,000 0
Columbia, SC 35,640,000 0 0 1,000,000
Dallas-Ft. Worth, TX 706,629,000 1,200,000 1,200,000 612,000
Ft. Lauderdale-Broward, FL 107,878,000 61,000 61,000 65,000
Greenville/Spartanburg, SC 174,267,000 90,000 1,078,000 950,000
Houston, TX 502,043,000 758,000 1,494,000 951,000
Jacksonville, FL 122,156,000 0 545,000 235,000
Little Rock, AR 45,048,000 0 0 497,000
Louisville, KY 175,819,000 167,000 312,000 76,000
Memphis, TN 209,109,000 0 586,000 921,000
Miami, FL 220,530,000 0 338,000 0
Nashville, TN 159,220,000 4,424,000 5,013,000 4,424,000
Orlando, FL 144,740,000 0 0 0
Raleigh, NC 110,433,000 720,000 932,000 228,000
Savannah, GA 44,126,000 475,000 1,135,000 270,000
Tampa Bay, FL 212,568,000 0 0 0
West Palm Beach, FL 58,890,000 24,000 39,000 218,000
sOUTH TOTAl 3,950,948,000 9,098,000 15,864,000 10,812,000
MIdwEsT
Chicago, IL 1,306,267,000 1,084,000 1,843,000 3,798,000
Cincinnati, OH 257,981,000 0 200,000 613,000
P. 2 | COllIERs INTERNATIONAl
3. hIghlIghts | Q3 2011 | INDUSTRIAL | NoRTh AmeRIcA
UNITEd sTATEs | INdUsTRIAl sURVEy
EXIsTING
INVENTORy (sF) NEw CONsTRUCTION NEw CONsTRUCTION CURRENTly UNdER
MARkET sEPT 30, 2011 Q3 2011 (sF) yTd 2011 CONsTRUCTION (sF)
Cleveland, OH 415,823,000 89,000 89,000 0
Columbus, OH 213,803,000 1,800,000 1,800,000 1,003,000
Detroit, MI 493,998,000 0 0 0
Grand Rapids, MI 112,298,000 0 0 0
Indianapolis, IN 279,780,000 136,000 642,000 387,000
Kansas City, MO-KS 242,425,000 342,000 392,000 400,000
Minneapolis/St. Paul, MN 262,516,000 0 0 0
Omaha, NE 67,886,000 0 20,000 0
St. Louis, MO 262,272,000 29,000 37,000 139,000
MIdwEsT TOTAl 3,915,048,000 3,481,000 5,023,000 6,340,000
wEsT
Bakersfield, CA 32,176,000 178,000 501,000 382,000
Boise, ID 35,595,000 0 0 210,000
Denver, CO 209,505,000 140,000 218,000 11,000
Fairfield, CA 41,621,000 0 0 149,000
Fresno, CA 48,600,000 0 0 0
Honolulu, HI 38,896,000 0 0 0
Las Vegas, NV 107,935,000 25,000 47,000 131,000
Los Angeles - Inland Empire, CA 382,014,000 2,456,000 2,963,000 2,200,000
Los Angeles, CA 880,796,000 1,193,000 1,494,000 609,000
Oakland, CA 131,233,000 0 0 0
Orange County, CA 200,453,000 0 0 26,000
Phoenix, AZ 270,050,000 0 244,000 3,566,000
Pleasanton/Walnut Creek, CA 33,035,000 0 0 0
Portland, OR 193,328,000 485,000 71,000 267,000
Reno, NV 73,911,000 0 0 80,000
Sacramento, CA 185,745,000 0 44,000 200,000
San Diego, CA 188,548,000 202,000 202,000 253,000
San Francisco Peninsula, CA 40,807,000 0 0 0
San Jose/Silicon Valley, CA 253,921,000 0 609,000 0
Seattle/Puget Sound, WA 270,188,000 18,000 155,000 46,000
Stockton/San Joaquin County, CA 92,734,000 69,000 69,000 22,000
wEsT TOTAl 3,711,093,000 4,766,000 6,618,000 8,152,000
U.s. TOTAl 13,860,815,000 18,418,000 31,696,000 28,469,000
COllIERs INTERNATIONAl | P. 3
4. hIghlIghts | Q3 2011 | INDUSTRIAL | NoRTh AmeRIcA
UNITEd sTATEs | INdUsTRIAl sURVEy
ABsORPTION ABsORPTION VACANCy RATE VACANCy RATE
MARkET Q3 2011 (sF) yTd 2011 JUNE 30, 2011 (%) sEPT. 30, 2011 (%)
NORTHEAsT
Baltimore, MD 341,000 403,000 10.84 10.69
Boston, MA (240,000) 856,000 20.61 20.70
Hartford, CT 168,000 257,000 9.22 9.05
Long Island, NY 93,000 (146,000) 5.87 5.82
New Jersey - Central (1,102,000) 2,904,000 9.79 10.09
New Jersey - Northern (1,588,000) (3,617,000) 8.15 8.57
Philadelphia, PA 1,241,000 3,874,000 9.60 9.32
Pittsburgh, PA (688,000) 996,000 6.97 7.37
Washington DC 408,000 2,323,000 11.89 11.76
NORTHEAsT TOTAl (1,367,000) 7,851,000 10.09 10.15
sOUTH
Atlanta, GA 3,864,000 6,291,000 14.41 13.83
Charleston, SC 500,000 1,237,000 10.83 10.40
Charlotte, NC 2,248,000 4,233,000 13.20 12.79
Columbia, SC 112,000 (109,000) 7.88 8.09
Dallas-Ft. Worth, TX 2,831,000 8,718,000 11.44 11.03
Ft. Lauderdale-Broward, FL 12,000 (410,000) 9.04 9.08
Greenville/Spartanburg, SC 1,118,000 1,386,000 10.08 9.50
Houston, TX 982,000 3,213,000 5.71 5.57
Jacksonville, FL 602,000 992,000 10.97 10.52
Little Rock, AR 290,000 (89,000) 14.18 14.18
Louisville, KY 384,000 1,947,000 10.96 10.56
Memphis, TN (853,000) 1,625,000 11.98 12.39
Miami, FL 467,000 1,352,000 8.53 8.47
Nashville, TN 811,000 774,000 14.42 12.96
Orlando, FL 584,000 999,000 12.24 11.83
Raleigh, NC 1,063,000 1,003,000 12.23 11.84
Savannah, GA 863,000 2,299,000 15.22 14.18
Tampa Bay, FL 643,000 1,867,000 10.73 10.43
West Palm Beach, FL 80,000 244,000 9.58 9.48
sOUTH TOTAl 16,600,000 37,572,000 11.14 10.78
MIdwEsT
Chicago, IL 4,983,000 1,452,000 11.76 11.28
Cincinnati, OH (398,000) 1,045,000 8.77 8.98
P. 4 | COllIERs INTERNATIONAl
5. hIghlIghts | Q3 2011 | INDUSTRIAL | NoRTh AmeRIcA
UNITEd sTATEs | INdUsTRIAl sURVEy
ABsORPTION ABsORPTION VACANCy RATE VACANCy RATE
MARkET Q3 2011 (sF) yTd 2011 JUNE 30, 2011 (%) sEPT. 30, 2011 (%)
Cleveland, OH (469,000) (248,000) 9.65 9.82
Columbus, OH 1,828,000 3,553,000 12.51 11.55
Detroit, MI 1,839,000 6,302,000 13.73 13.48
Grand Rapids, MI 191,000 534,000 8.89 8.65
Indianapolis, IN 477,000 5,871,000 6.80 6.64
Kansas City, MO-KS 1,100,000 859,000 7.19 6.86
Minneapolis/St. Paul, MN 442,000 459,000 8.70 8.51
Omaha, NE 156,000 447,000 6.11 5.88
St. Louis, MO (1,064,000) (1,108,000) 8.49 8.83
MIdwEsT TOTAl 9,085,000 19,166,000 10.39 10.14
wEsT
Bakersfield, CA 185,000 524,000 9.51 9.44
Boise, ID 101,000 (76,000) 10.24 9.96
Denver, CO 765,000 156,000 7.90 7.52
Fairfield, CA 0 682,000 13.33 12.88
Fresno, CA 132,000 172,000 12.00 11.73
Honolulu, HI 9,000 (1,000) 4.73 4.70
Las Vegas, NV (23,000) 320,000 16.09 16.13
Los Angeles - Inland Empire, CA 4,521,000 13,374,000 9.42 7.18
Los Angeles, CA 2,218,000 6,884,000 5.23 5.00
Oakland, CA (667,000) 366,000 8.76 9.26
Orange County, CA 370,000 1,710,000 5.04 4.78
Phoenix, AZ 1,618,000 3,558,000 15.25 14.65
Pleasanton/Walnut Creek, CA (371,000) (497,000) 11.33 12.45
Portland, OR 909,000 1,795,000 9.01 8.52
Reno, NV 151,000 653,000 15.14 14.94
Sacramento, CA 564,000 938,000 13.08 12.77
San Diego, CA 353,000 185,000 11.44 11.51
San Francisco Peninsula, CA (85,000) 213,000 8.94 9.14
San Jose/Silicon Valley, CA (236,000) 504,000 13.14 12.15
Seattle/Puget Sound, WA 1,323,000 3,788,000 7.64 7.15
Stockton/San Joaquin County, CA 348,000 2,278,000 15.62 15.31
wEsT TOTAl 12,185,000 37,527,000 9.40 8.91
U.s. TOTAl 36,503,000 102,116,000 10.29 9.99
COllIERs INTERNATIONAl | P. 5
6. hIghlIghts | Q3 2011 | INDUSTRIAL | NoRTh AmeRIcA
UNITEd sTATEs | INdUsTRIAl sURVEy | sAlEs PRICE ANd CAP RATE As OF sEPTEMBER 2011
sAlEs PRICE CAP RATE VACANCy FORECAsT ABsORPTION FORECAsT RENT FORECAsT
MARkET (Usd PsF) (%) (3 MONTHs) (3 MONTHs) 3 MONTHs
NORTHEAsT
Baltimore, MD 60.63 7.95 Same Same Bottoming
Boston, MA Same Same Bottoming
Hartford, CT 38.00 8.50 Up Same Declining
Long Island, NY 118.00 8.40 Same Same Declining
New Jersey - Central 56.95 7.90 Up Down Bottoming
New Jersey - Northern 65.04 Up Down Bottoming
Philadelphia, PA 51.36 8.50 Down Up No clear direction
Pittsburgh, PA 50.00 7.75 Same Up Increasing
Washington DC 98.00 6.50 Down Up No clear direction
NORTHEAsT AVERAGE 67.25 7.93 – – –
sOUTH
Atlanta, GA 37.24 8.70 Down Down Same
Charleston, SC 46.00 7.75 Down Same Up
Columbia, SC Down Up Up
Dallas-Ft. Worth, TX 50.00 7.80 Down Same Same
Ft. Lauderdale-Broward, FL 63.75 5.75 Same Up Same
Greenville/Spartanburg, SC 26.75 9.50 Down Up Up
Houston, TX 64.00 7.90 Down Up Up
Jacksonville, FL 8.00 Down Down Same
Little Rock, AR 65.45 9.00 Same Same Same
Memphis, TN 30.00 8.90 Down Up Same
Miami, FL 67.93 Same Up Up
Nashville, TN 4.51 6.00 Down Down Up
Orlando, FL 61.00 Down Same Same
Raleigh, NC 41.85 8.64 Down Up Same
Savannah, GA 37.00 8.50 Same Same Same
Tampa Bay, FL 39.17 8.50 Down Up Same
West Palm Beach, FL 36.75 Same Up Down
sOUTH AVERAGE 44.76 8.07 – – –
MIdwEsT
Chicago, IL 49.00 6.75 Same Down Same
Cincinnati, OH 32.00 8.00 Same Same Same
Columbus, OH 25.00 Down Up Same
P. 6 | COllIERs INTERNATIONAl
7. hIghlIghts | Q3 2011 | INDUSTRIAL | NoRTh AmeRIcA
UNITEd sTATEs | INdUsTRIAl sURVEy | sAlEs PRICE ANd CAP RATE As OF sEPTEMBER 2011
sAlEs PRICE CAP RATE VACANCy FORECAsT ABsORPTION FORECAsT RENT FORECAsT
MARkET (Usd PsF) (%) (3 MONTHs) (3 MONTHs) 3 MONTHs
Detroit, MI 21.65 Same Same Down
Grand Rapids, MI 25.00 13.00 Down Up Up
Indianapolis, IN 44.12 8.00 Down Up Up
Kansas City, MO-KS 8.75 Same Same Same
Minneapolis/St. Paul, MN 38.97 10.00 Down Same Same
Omaha, NE 42.50 9.00 Down Up Same
MIdwEsT AVERAGE 34.78 9.07 – – –
wEsT
Bakersfield, CA 38.00 10.00 Same Same Same
Boise, ID 45.00 Same Same Same
Denver, CO 58.00 8.25 Down Up Same
Fairfield, CA Same Same Down
Fresno, CA 38.00 9.00 Same Same Same
Honolulu, HI Up Down Same
Las Vegas, NV 33.92 Up Up Down
Los Angeles - Inland Empire, CA 58.00 5.50 Down Up Up
Los Angeles, CA 86.00 6.50 Same Same Same
Oakland, CA 68.97 8.00 Down Up Up
Orange County, CA 94.00 6.50 Same Same Same
Phoenix, AZ 49.00 8.00 Down Same Same
Pleasanton/Walnut Creek, CA 59.00 6.50 Same Same Same
Portland, OR 63.54 Same Same Same
Reno, NV Down Same Same
Sacramento, CA 44.88 8.07 Same Same Same
San Diego, CA 79.97 8.00 Down Same Same
San Francisco Peninsula, CA 250.00 6.50 Same Same Same
San Jose/Silicon Valley, CA Up Same Same
Seattle/Puget Sound, WA 72.14 8.44 Down Up Same
Stockton/San Joaquin County, CA 60.00 7.00 Down Up Same
wEsT AVERAGE 70.50 7.59 – – –
U.s. AVERAGE 55.96 8.05 – – –
COllIERs INTERNATIONAl | P. 7
8. hIghlIghts | Q3 2011 | INDUSTRIAL | NoRTh AmeRIcA
U.S. Industrial Markets Showing More Signs INsTITUTE FOR sUPPly MANAGEMENT MANUFACTURING INdEX
of Strength Continued from page 1
80
Beginning in 2012, however, select markets should begin to see rents hold
firm and even post modest increases in certain submarkets, but wide- 70
spread increases are doubtful until 2013..
60
50
Occupancies rise for sixth consecutive quarter. During the third quarter,
Index
net absorption totaled 36.5 million square feet (MSF)—a mild drop from 40
the second quarter, when occupied space increased by 41.0 MSF, but
sufficient to bring year-to-date absorption to 102.1 MSF. Over the past six 30
quarters occupied space has increased by 145 MSF. The South accounted
20
for 45 percent of the nation’s absorption followed by the West at 33 per-
cent and the Midwest at 22 percent. Of all four regions, the Northeast was 10
the strongest drag on overall absorption, returning 1.4 MSF of vacant
space to the market. Of the 60 markets tracked in the U.S., 47 (78 percent 0
J F MA MJ J A S O N D J F MA MJ J A S O N D J F MA MJ J A S O
vs. 77 percent in Q2 2011) reported positive absorption during the third
2009 2010 2011
quarter. Canadian industrial markets posted disappointing results, with
third quarter absorption totaling just 1.9 MSF, considerably below the 6.0
MSF recorded in both Q1 and Q2.
ABsORPTION (sF) | sElECT MARkETs | Q3 2011
warehouse construction hits two and a half year high. Third quarter -2,000,000 0 2,000,000 4000000
completions totaled 18.4 MSF, a significant increase from the second Chicago
quarter when 10.4 MSF were delivered to market, and the highest level
since the first quarter of 2009. Of the 18.4 MSF delivered, 71 percent was Los Angeles - Inland Empire
build-to-suit and the balance was classified as speculative (spec) Atlanta
construction. In contrast, last quarter’s build-to-suit deliveries accounted
Dallas
for 52 percent of completions. In the coming quarters the majority of
construction is anticipated to remain build-to-suit, with only 30 percent Los Angeles
under construction at the end of the third quarter classified as speculative. Detroit
Quarter-end construction activity totaled 28.5 MSF, little changed from t
Savannah
he 27.6 MSF underway at the end of the second quarter, and well below
the 124.0 MSF recorded three years ago. Canadian construction took Indianapolis
a modest jump with 5.0 MSF completed in Q3, bringing year-to-date
New Jersey - Central
construction to 8.7 MSF.
New Jersey - Northern
U.s. industrial vacancy rate falls below ten percent. The U.S. industrial
warehouse vacancy rate dropped 30 basis points during the third quarter
to register 9.99 percent (100 basis points equals one percent). This latest TRAdE: EXPORTs - GOOds, (MIl. $, sA)
decrease brings the national vacancy rate back to levels last experienced
in the first quarter of 2009. It is even more encouraging that most markets
are now experiencing sequential drops in vacancy. In the third quarter, 44 150000
Millions, Dollars, Seasonally Adjusted
of 60 markets registered a decrease in vacancy from the prior quarter,
with a handful of markets seeing their respective vacancy rates fall by a 120000
full percentage point. By contrast, Canadian warehouse vacancies dropped
by just 1 basis point to end the third quarter at 4.89 percent.
90000
Industrial rents resume downward trend. After brief flattening of rents,
industrial warehouse lease rates fell by 2.2 percent during the third quar- 60000
ter to average $4.53 per square foot. Over the past year warehouse rents
have fallen by 4.8% and—since peaking in the fourth quarter of 2007— 30000
rents have dropped 22.7 percent. Bulk warehouse rents, however, posted
a modest increase, rising 1.6 percent to average $4.39 per square foot, 0
while flex rents slipped $0.09 and R&D rents decreased $0.30 per square J F MA MJ J A S O N D J F MA MJ J A
foot. Canadian industrial warehouse rents by comparison were up during 2010 2011
the quarter rising by CAD$0.11 to average CAD$7.25 per square foot.
P. 8 | COllIERs INTERNATIONAl
9. hIghlIghts | Q3 2011 | INDUSTRIAL | NoRTh AmeRIcA
UNITEd sTATEs | INdUsTRIAl sURVEy | RENTs As OF sEPTEMBER 2011
wAREHOUsE/dIsTRIBUTION BUlk sPACE FlEX/sERVICE sPACE TECH/R&d sPACE
MARkET sPACE (Usd PsF) (Usd PsF) (Usd PsF) (Usd PsF)
NORTHEAsT
Baltimore, MD 5.45 4.59 9.64
Boston, MA 4.50 4.75 8.50 12.00
Hartford, CT 4.04 4.28 6.50 6.50
Long Island, NY 8.34 13.90 13.40 9.13
New Jersey - Central 4.42 3.81 11.79 12.81
New Jersey - Northern 6.09 5.95 10.61 9.89
Philadelphia, PA 4.00 3.75 7.00 11.00
Pittsburgh, PA 4.29 3.75 12.02 12.02
Washington DC 6.49 5.31 11.59 15.10
NORTHEAsT AVERAGE 5.29 5.57 10.12 11.06
sOUTH
Atlanta, GA 3.26 2.84 7.29 10.37
Charleston, SC 3.75 4.20 6.25 16.25
Charlotte, NC 3.28 7.98
Columbia, SC 3.75 3.75 9.50
Dallas-Ft. Worth, TX 3.00 2.65 6.70 8.20
Ft. Lauderdale-Broward, FL 6.45 6.08 8.88 6.00
Greenville/Spartanburg, SC 2.90 2.95 6.75
Houston, TX 5.18 4.26 7.04 8.59
Jacksonville, FL 3.75 3.10 9.00
Little Rock, AR 2.68 2.74 7.35
Louisville, KY 3.37 7.72
Memphis, TN 2.43 2.42 5.45 9.00
Miami, FL 6.92 4.19 10.72 7.97
Nashville, TN 4.06 3.80 7.24 7.24
Orlando, FL 4.49 4.24 8.77
Raleigh, NC 3.73 4.50 9.21 9.21
Savannah, GA 3.95 3.75 7.00 10.00
Tampa Bay, FL 4.21 4.22 8.30 9.34
West Palm Beach, FL 6.70 6.35 10.97 15.00
sOUTH AVERAGE 4.10 3.88 7.92 9.68
MIdwEsT
Chicago, IL 4.23 2.54 8.51
Cincinnati, OH 2.87 2.87 6.06 6.06
COllIERs INTERNATIONAl | P. 9
10. hIghlIghts | Q3 2011 | INDUSTRIAL | NoRTh AmeRIcA
UNITEd sTATEs | INdUsTRIAl sURVEy | RENTs As OF sEPTEMBER 2011
wAREHOUsE/dIsTRIBUTION BUlk sPACE FlEX/sERVICE sPACE TECH/R&d sPACE
MARkET sPACE (Usd PsF) (Usd PsF) (Usd PsF) (Usd PsF)
Cleveland, OH 3.37 8.10
Columbus, OH 2.70 2.58 4.28 4.28
Detroit, MI 3.87 3.55 7.90
Grand Rapids, MI 3.05 3.00 4.50 6.50
Indianapolis, IN 3.25 3.08 7.50
Kansas City, MO-KS 3.00 3.12 7.15 6.68
Minneapolis/St. Paul, MN 4.57 4.21 4.67
Omaha, NE 5.17 5.98 5.73 3.71
St. Louis, MO 3.86 8.95
MIdwEsT AVERAGE 3.63 3.44 6.67 5.45
wEsT
Bakersfield, CA 4.00 3.42 8.00
Boise, ID 4.50 4.50 6.20 6.30
Denver, CO 3.50 3.25 8.50 9.50
Fairfield, CA 5.48 5.38 8.45 8.76
Fresno, CA 2.40 2.28 4.00 5.50
Las Vegas, NV 4.82 4.68 6.04 9.52
Los Angeles - Inland Empire, CA 3.91 3.79 6.75 7.75
Los Angeles, CA 5.74 5.62 9.75 12.50
Oakland, CA 4.37 4.22 4.62 7.67
Orange County, CA 6.73 5.53 12.55 13.59
Phoenix, AZ 5.21 4.01 10.63 10.52
Pleasanton/Walnut Creek, CA 5.04 4.20 10.32 10.32
Portland, OR 5.21 4.76 9.44 9.69
Reno, NV 3.84 4.12 5.64 8.40
Sacramento, CA 4.29 3.75 8.13 8.72
San Diego, CA 8.04 7.44 11.16 14.04
San Francisco Peninsula, CA 9.24 9.24 21.00 21.00
San Jose/Silicon Valley, CA 5.53 5.15 8.45 13.56
Seattle/Puget Sound, WA 5.90 5.18 12.60
Stockton/San Joaquin County, CA 3.84 3.66 5.44 7.44
wEsT AVERAGE 5.08 4.71 8.88 10.27
Us AVERAGE 4.53 4.39 8.63 9.66
U.s. QUARTERly CHANGE -2.3% 1.6% -1.1% -3.0%
P. 10 | COllIERs INTERNATIONAl
11. hIghlIghts | Q3 2011 | INDUSTRIAL | NoRTh AmeRIcA
CANAdA | INdUsTRIAl sURVEy
EXIsTING
INVENTORy (sF) NEw CONsTRUCTION NEw CONsTRUCTION CURRENTly UNdER
MARkET sEPT 30, 2011 Q3 2011 (sF) yTd 2011 CONsTRUCTION (sF)
Calgary, AB 124,042,000 2,257,000 2,257,000 2,257,000
Edmonton, AB 77,154,000 0 83,000 920,000
Guelph, ON 19,940,000 200,000 200,000 169,000
Halifax, NS 7,157,000 0 81,000 85,000
Montreal, QC 347,771,000 0 0 500,000
Ottawa, ON 28,027,000 0 0 0
Regina, SK 16,195,000 0 632,000 199,000
Saskatoon, SK 20,105,000 160,000 400,000 400,000
Toronto, ON 761,519,000 771,000 1,187,000 1,895,000
Vancouver, BC 179,632,000 1,600,000 1,600,000 1,600,000
Victoria, BC 8,619,000 0 43,000 28,000
Waterloo Region, ON 60,701,000 9,000 119,000 55,000
CANAdA TOTAl 1,650,862,000 4,997,000 6,601,000 8,108,000
CANAdA | INdUsTRIAl sURVEy
ABsORPTION ABsORPTION VACANCy RATE VACANCy RATE
MARkET Q3 2011 (sF) yTd 2011 JUNE 30, 2011 (%) sEPT. 30, 2011 (%)
Calgary, AB 1,165,000 2,584,000 5.03 4.31
Edmonton, AB 172,000 565,000 3.41 3.46
Guelph, ON 209,000 565,000 3.65 3.56
Halifax, NS 57,000 (97,000) 6.93 6.13
Montreal, QC (1,275,000) (778,000) 5.45 5.81
Ottawa, ON 196,000 (168,000) 7.10 6.40
Regina, SK (40,000) 50,000 0.91 1.16
Saskatoon, SK 41,000 300,000 2.70 3.27
Toronto, ON 1,324,000 9,567,000 4.97 4.89
Vancouver, BC 201,000 1,318,000 4.10 4.09
Victoria, BC 0 62,000 3.37 3.37
Waterloo Region, ON (180,000) (44,000) 6.10 6.31
CANAdA TOTAl 1,869,000 13,924,000 4.90 4.89
COllIERs INTERNATIONAl | P. 11
12. hIghlIghts | Q3 2011 | INDUSTRIAL | NoRTh AmeRIcA
CANAdA | INdUsTRIAl sURVEy | sAlEs PRICE ANd CAP RATE As OF sEPTEMBER 2011
sAlEs PRICE CAP RATE VACANCy FORECAsT ABsORPTION FORECAsT RENT FORECAsT
MARkET (CAd PsF) (%) (3 MONTHs) (3 MONTHs) 3 MONTHs
Calgary, AB 115.00 6.75 Down Up Increasing
Edmonton, AB 82.40 7.44 Up Down Bottoming
Guelph, ON 48.00 8.22 Same Same No clear direction
Halifax, NS 90.00 7.75 Down Up Increasing
Montreal, QC 60.00 8.25 Same Same No clear direction
Ottawa, ON 100.00 8.00 Down Up No clear direction
Regina, SK 135.00 7.00 Same Same Peaking
Saskatoon, SK 130.00 7.50 Same Same Peaking
Toronto, ON 78.11 6.70 Down Up Bottoming
Vancouver, BC 180.00 6.85 Same Same Bottoming
Victoria, BC 175.00 6.67 Down Up Bottoming
Waterloo Region, ON 63.00 8.22 Same Same No clear direction
CANAdA AVERAGE 104.71 7.45 – – –
CANAdA | INdUsTRIAl sURVEy | RENTs As OF sEPTEMBER 2011
wAREHOUsE/dIsTRIBUTION BUlk sPACE FlEX/sERVICE sPACE TECH/R&d sPACE
MARkET sPACE (CAd PsF) (CAd PsF) (CAd PsF) (CAd PsF)
Calgary, AB 8.00 6.25 10.00 10.50
Edmonton, AB 7.75 6.00 9.50 10.00
Guelph, ON 4.41 4.41 7.67 7.67
Halifax, NS 7.75 6.00 10.00 15.00
Montreal, QC 4.75 4.50 6.50 8.50
Ottawa, ON 7.50 7.00 8.50 12.00
Regina, SK 9.00 7.00 12.00 14.00
Saskatoon, SK 9.50 8.00 11.00 13.00
Toronto, ON 4.90 4.48 7.04 7.62
Vancouver, BC 7.44 7.50 8.00 9.00
Victoria, BC 12.00 11.00 13.50 13.50
Waterloo Region, ON 4.03 3.41 8.16 8.16
CANAdA AVERAGE 7.25 6.30 9.32 10.75
CANAdA QUARTERly CHANGE 1.6% 2.5% -1.1% 0.3%
Glossary Inventory – Includes all existing multi or single
tenant leased and owner-occupied industrial
warehouse, light manufacturing, flex and R&D
(remainder in wet lab, workshop, storage and other
support), with dock-height and floor-height loading.
Triple Net Rent – Includes rent payable to the
properties greater than or equal to 10,000 landlord and does not include additional expenses
Absorption – Net change in leased space over a square feet. such as taxes, insurance, maintenance, janitorial and
given period of time.
New Construction – Includes completed speculative utilities. All industrial and high-tech/R&D rents in
Bulk space – 100,000 square feet or more with up and build-to-suit construction. New construction this report are quoted on an annual, triple net per
to 10 percent office space, the balance being general quoted on a net basis after any demolitions or square foot basis in U.S. dollars.
warehouse space with 20 to 36 foot ceiling heights. conversions. Vacancy Rate – Percentage of total inventory
All loading is dock-height. available (both vacant and occupied) as at the survey
service space – Single story (or mezzanine) with
Flex space – Single-story buildings having 10- to 10- to 16-foot ceilings with frontage treatment on date including direct vacant and sublease space.
18-foot ceilings with both floor-height and dock- one side and dock-height loading or grade level warehouse – 50,000 square feet or more with up to
height loading. Includes wide variation in office roll-up doors on the other. Less than 15% office. 15 percent office space, the balance being general
space utilization, ranging from retail and personal Tech/R&d – One- and two- story, 10- to 15-foot warehouse space with 18- to 30- foot ceiling
service through distribution, light industrial and ceiling heights with up to 50% office/dry lab space heights. All loading is dock-height.
occasional heavy industrial use.
P. 12 | COllIERs INTERNATIONAl