SlideShare a Scribd company logo
CHI-SQUARE TEST EXPLANATION 
Let’s say you want to know if there is a difference in the proportion of men and women who are left handed and 
let’s say in your sample 10% of men and 5% of women were left -handed. 
How it’s Calculated (Without the gory details) 
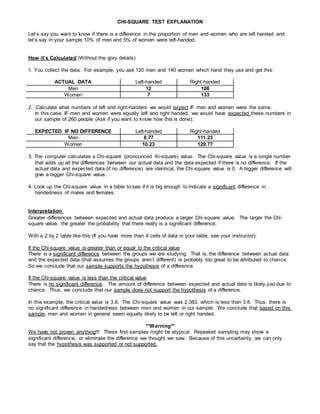
1. You collect the data. For example, you ask 120 men and 140 women which hand they use and get this: 
ACTUAL DATA Left-handed Right-handed 
Men 12 108 
Women 7 133 
2. Calculate what numbers of left and right-handers we would expect IF men and women were the same. 
In this case, IF men and women were equally left and right handed, we would have expected these numbers in 
our sample of 260 people (Ask if you want to know how this is done): 
EXPECTED IF NO DIFFERENCE Left-handed Right-handed 
Men 8.77 111.23 
Women 10.23 129.77 
3. The computer calculates a Chi-square (pronounced Ki-square) value. The Chi-square value is a single number 
that adds up all the differences between our actual data and the data expected if there is no difference. If the 
actual data and expected data (if no difference) are identical, the Chi -square value is 0. A bigger difference will 
give a bigger Chi-square value. 
4. Look up the Chi-square value in a table to see if it is big enough to indicate a significant difference in 
handedness of males and females. 
Interpretation 
Greater differences between expected and actual data produce a larger Chi -square value. The larger the Chi-square 
value, the greater the probability that there really is a significant difference. 
With a 2 by 2 table like this (If you have more than 4 cells of data in your table, see your instructor): 
If the Chi-square value is greater than or equal to the critical value 
There is a significant difference between the groups we are studying. That is, the difference between actual data 
and the expected data (that assumes the groups aren’t different) is probably too great to be attributed to chance. 
So we conclude that our sample supports the hypothesis of a difference. 
If the Chi-square value is less than the critical value 
There is no significant difference. The amount of difference between expected and actual data is likely just due to 
chance. Thus, we conclude that our sample does not support the hypothesis of a difference. 
In this example, the critical value is 3.8. The Chi-square value was 2.383, which is less than 3.8. Thus, there is 
no significant difference in handedness between men and women in our sample. We conclude that based on this 
sample, men and women in general seem equally likely to be left or right handed. 
**Warning** 
We have not proven anything!!! These first samples might be atypical. Repeated sampling may show a 
significant difference, or eliminate the difference we thought we saw. Because of this uncertainty, we can only 
say that the hypothesis was supported or not supported.
Graphing Categorical Data that you analyze with the Chi -Square Statistic 
Let’s say you want to know if there is a difference in the proportion of men and women who are left handed and 
you collect this data: 
ACTUAL DATA Left-handed Right-handed 
Men 12 108 
Women 7 133 
Calculate the % of men that are left-handed and right handed in your study: 
12 / 120 total men = 0.10 X 10 = 10% of men were left -handed 
108 / 120 = 0.90 X 100 = 90% of men were right-handed 
Do the same for women: 
7 / 140 total women = 0.05 X 100 = 5% left handed 
133 / 140 = 0.95 X 100 = 95% right-handed 
Plot these percents as bars: 
Percent 
Lef t 
Hand ed 
30 
20 
10 
Men Women 
Or plot as stacked bars: 
10 0 
Percent 
50 
Or plot as a pie diagram. 
Lef t- handed 
Rig ht -handed 
Men Women

More Related Content

Similar to Chi sq explanation

Page 266LEARNING OBJECTIVES· Explain how researchers use inf.docx
Page 266LEARNING OBJECTIVES· Explain how researchers use inf.docxPage 266LEARNING OBJECTIVES· Explain how researchers use inf.docx
Page 266LEARNING OBJECTIVES· Explain how researchers use inf.docxkarlhennesey
 
Chapter8 introduction to hypothesis testing
Chapter8 introduction to hypothesis testingChapter8 introduction to hypothesis testing
Chapter8 introduction to hypothesis testingBOmebratu
 
Steps in hypothesis.pptx
Steps in hypothesis.pptxSteps in hypothesis.pptx
Steps in hypothesis.pptxYashwanth Rm
 
Data Analysis for Graduate Studies Summary
Data Analysis for Graduate Studies SummaryData Analysis for Graduate Studies Summary
Data Analysis for Graduate Studies SummaryKelvinNMhina
 
Topic Learning TeamNumber of Pages 2 (Double Spaced)Num.docx
Topic Learning TeamNumber of Pages 2 (Double Spaced)Num.docxTopic Learning TeamNumber of Pages 2 (Double Spaced)Num.docx
Topic Learning TeamNumber of Pages 2 (Double Spaced)Num.docxAASTHA76
 
Chi-Square Test of Independence
Chi-Square Test of IndependenceChi-Square Test of Independence
Chi-Square Test of IndependenceKen Plummer
 
Math class 8 data handling
Math class 8 data handling Math class 8 data handling
Math class 8 data handling HimakshiKava
 
Frequency Tables - Statistics
Frequency Tables - StatisticsFrequency Tables - Statistics
Frequency Tables - Statisticsmscartersmaths
 
Determination and Analysis of Sample size
Determination and Analysis of Sample sizeDetermination and Analysis of Sample size
Determination and Analysis of Sample sizeSudipto Krishna Dutta
 
How to calculate power in statistics
How to calculate power in statisticsHow to calculate power in statistics
How to calculate power in statisticsStat Analytica
 
data handling class 8
data handling class 8data handling class 8
data handling class 8HimakshiKava
 
analysing_data_using_spss.pdf
analysing_data_using_spss.pdfanalysing_data_using_spss.pdf
analysing_data_using_spss.pdfDrAnilKannur1
 
Analysis Of Data Using SPSS
Analysis Of Data Using SPSSAnalysis Of Data Using SPSS
Analysis Of Data Using SPSSBrittany Brown
 
Lesson 2 Statistics Benefits, Risks, and MeasurementsAssignmen.docx
Lesson 2 Statistics Benefits, Risks, and MeasurementsAssignmen.docxLesson 2 Statistics Benefits, Risks, and MeasurementsAssignmen.docx
Lesson 2 Statistics Benefits, Risks, and MeasurementsAssignmen.docxSHIVA101531
 

Similar to Chi sq explanation (20)

Page 266LEARNING OBJECTIVES· Explain how researchers use inf.docx
Page 266LEARNING OBJECTIVES· Explain how researchers use inf.docxPage 266LEARNING OBJECTIVES· Explain how researchers use inf.docx
Page 266LEARNING OBJECTIVES· Explain how researchers use inf.docx
 
40007 chapter8
40007 chapter840007 chapter8
40007 chapter8
 
Hypothesis testing - Primer
Hypothesis testing - PrimerHypothesis testing - Primer
Hypothesis testing - Primer
 
Chapter8 introduction to hypothesis testing
Chapter8 introduction to hypothesis testingChapter8 introduction to hypothesis testing
Chapter8 introduction to hypothesis testing
 
Hypothesis test
Hypothesis testHypothesis test
Hypothesis test
 
Steps in hypothesis.pptx
Steps in hypothesis.pptxSteps in hypothesis.pptx
Steps in hypothesis.pptx
 
Data Analysis for Graduate Studies Summary
Data Analysis for Graduate Studies SummaryData Analysis for Graduate Studies Summary
Data Analysis for Graduate Studies Summary
 
Topic Learning TeamNumber of Pages 2 (Double Spaced)Num.docx
Topic Learning TeamNumber of Pages 2 (Double Spaced)Num.docxTopic Learning TeamNumber of Pages 2 (Double Spaced)Num.docx
Topic Learning TeamNumber of Pages 2 (Double Spaced)Num.docx
 
Chi-Square Test of Independence
Chi-Square Test of IndependenceChi-Square Test of Independence
Chi-Square Test of Independence
 
Prob ^0 Stats Proj 1
Prob ^0 Stats Proj 1Prob ^0 Stats Proj 1
Prob ^0 Stats Proj 1
 
Math class 8 data handling
Math class 8 data handling Math class 8 data handling
Math class 8 data handling
 
Frequency Tables - Statistics
Frequency Tables - StatisticsFrequency Tables - Statistics
Frequency Tables - Statistics
 
Hypothesis testing
Hypothesis testingHypothesis testing
Hypothesis testing
 
Determination and Analysis of Sample size
Determination and Analysis of Sample sizeDetermination and Analysis of Sample size
Determination and Analysis of Sample size
 
How to calculate power in statistics
How to calculate power in statisticsHow to calculate power in statistics
How to calculate power in statistics
 
data handling class 8
data handling class 8data handling class 8
data handling class 8
 
analysing_data_using_spss.pdf
analysing_data_using_spss.pdfanalysing_data_using_spss.pdf
analysing_data_using_spss.pdf
 
Analysis Of Data Using SPSS
Analysis Of Data Using SPSSAnalysis Of Data Using SPSS
Analysis Of Data Using SPSS
 
analysing_data_using_spss.pdf
analysing_data_using_spss.pdfanalysing_data_using_spss.pdf
analysing_data_using_spss.pdf
 
Lesson 2 Statistics Benefits, Risks, and MeasurementsAssignmen.docx
Lesson 2 Statistics Benefits, Risks, and MeasurementsAssignmen.docxLesson 2 Statistics Benefits, Risks, and MeasurementsAssignmen.docx
Lesson 2 Statistics Benefits, Risks, and MeasurementsAssignmen.docx
 

More from Chinnannan Periasamy (15)

MCT
MCTMCT
MCT
 
Inventory notes
Inventory notesInventory notes
Inventory notes
 
Qtmd syllabus
Qtmd syllabusQtmd syllabus
Qtmd syllabus
 
Ec 15 101 advanced engineering mathematics
Ec 15 101 advanced engineering mathematicsEc 15 101 advanced engineering mathematics
Ec 15 101 advanced engineering mathematics
 
Fourier transform
Fourier transformFourier transform
Fourier transform
 
Avg q lenth
Avg q lenthAvg q lenth
Avg q lenth
 
Parametric test
Parametric testParametric test
Parametric test
 
HYPOTHESES STEPS
HYPOTHESES STEPSHYPOTHESES STEPS
HYPOTHESES STEPS
 
11.00 technology ok
11.00 technology ok11.00 technology ok
11.00 technology ok
 
segmentation
segmentationsegmentation
segmentation
 
1.11 functions of money ppt-ok
1.11 functions of money ppt-ok1.11 functions of money ppt-ok
1.11 functions of money ppt-ok
 
Listening
ListeningListening
Listening
 
decision
decisiondecision
decision
 
M tech regulations
M tech regulationsM tech regulations
M tech regulations
 
1.iib ppt
1.iib ppt1.iib ppt
1.iib ppt
 

Recently uploaded

Knowledge engineering: from people to machines and back
Knowledge engineering: from people to machines and backKnowledge engineering: from people to machines and back
Knowledge engineering: from people to machines and backElena Simperl
 
Designing Great Products: The Power of Design and Leadership by Chief Designe...
Designing Great Products: The Power of Design and Leadership by Chief Designe...Designing Great Products: The Power of Design and Leadership by Chief Designe...
Designing Great Products: The Power of Design and Leadership by Chief Designe...Product School
 
IESVE for Early Stage Design and Planning
IESVE for Early Stage Design and PlanningIESVE for Early Stage Design and Planning
IESVE for Early Stage Design and PlanningIES VE
 
Unsubscribed: Combat Subscription Fatigue With a Membership Mentality by Head...
Unsubscribed: Combat Subscription Fatigue With a Membership Mentality by Head...Unsubscribed: Combat Subscription Fatigue With a Membership Mentality by Head...
Unsubscribed: Combat Subscription Fatigue With a Membership Mentality by Head...Product School
 
IOS-PENTESTING-BEGINNERS-PRACTICAL-GUIDE-.pptx
IOS-PENTESTING-BEGINNERS-PRACTICAL-GUIDE-.pptxIOS-PENTESTING-BEGINNERS-PRACTICAL-GUIDE-.pptx
IOS-PENTESTING-BEGINNERS-PRACTICAL-GUIDE-.pptxAbida Shariff
 
Salesforce Adoption – Metrics, Methods, and Motivation, Antone Kom
Salesforce Adoption – Metrics, Methods, and Motivation, Antone KomSalesforce Adoption – Metrics, Methods, and Motivation, Antone Kom
Salesforce Adoption – Metrics, Methods, and Motivation, Antone KomCzechDreamin
 
ODC, Data Fabric and Architecture User Group
ODC, Data Fabric and Architecture User GroupODC, Data Fabric and Architecture User Group
ODC, Data Fabric and Architecture User GroupCatarinaPereira64715
 
Unpacking Value Delivery - Agile Oxford Meetup - May 2024.pptx
Unpacking Value Delivery - Agile Oxford Meetup - May 2024.pptxUnpacking Value Delivery - Agile Oxford Meetup - May 2024.pptx
Unpacking Value Delivery - Agile Oxford Meetup - May 2024.pptxDavid Michel
 
Custom Approval Process: A New Perspective, Pavel Hrbacek & Anindya Halder
Custom Approval Process: A New Perspective, Pavel Hrbacek & Anindya HalderCustom Approval Process: A New Perspective, Pavel Hrbacek & Anindya Halder
Custom Approval Process: A New Perspective, Pavel Hrbacek & Anindya HalderCzechDreamin
 
From Siloed Products to Connected Ecosystem: Building a Sustainable and Scala...
From Siloed Products to Connected Ecosystem: Building a Sustainable and Scala...From Siloed Products to Connected Ecosystem: Building a Sustainable and Scala...
From Siloed Products to Connected Ecosystem: Building a Sustainable and Scala...Product School
 
Empowering NextGen Mobility via Large Action Model Infrastructure (LAMI): pav...
Empowering NextGen Mobility via Large Action Model Infrastructure (LAMI): pav...Empowering NextGen Mobility via Large Action Model Infrastructure (LAMI): pav...
Empowering NextGen Mobility via Large Action Model Infrastructure (LAMI): pav...Thierry Lestable
 
AI revolution and Salesforce, Jiří Karpíšek
AI revolution and Salesforce, Jiří KarpíšekAI revolution and Salesforce, Jiří Karpíšek
AI revolution and Salesforce, Jiří KarpíšekCzechDreamin
 
Exploring UiPath Orchestrator API: updates and limits in 2024 🚀
Exploring UiPath Orchestrator API: updates and limits in 2024 🚀Exploring UiPath Orchestrator API: updates and limits in 2024 🚀
Exploring UiPath Orchestrator API: updates and limits in 2024 🚀DianaGray10
 
Software Delivery At the Speed of AI: Inflectra Invests In AI-Powered Quality
Software Delivery At the Speed of AI: Inflectra Invests In AI-Powered QualitySoftware Delivery At the Speed of AI: Inflectra Invests In AI-Powered Quality
Software Delivery At the Speed of AI: Inflectra Invests In AI-Powered QualityInflectra
 
Key Trends Shaping the Future of Infrastructure.pdf
Key Trends Shaping the Future of Infrastructure.pdfKey Trends Shaping the Future of Infrastructure.pdf
Key Trends Shaping the Future of Infrastructure.pdfCheryl Hung
 
Connector Corner: Automate dynamic content and events by pushing a button
Connector Corner: Automate dynamic content and events by pushing a buttonConnector Corner: Automate dynamic content and events by pushing a button
Connector Corner: Automate dynamic content and events by pushing a buttonDianaGray10
 
In-Depth Performance Testing Guide for IT Professionals
In-Depth Performance Testing Guide for IT ProfessionalsIn-Depth Performance Testing Guide for IT Professionals
In-Depth Performance Testing Guide for IT ProfessionalsExpeed Software
 
JMeter webinar - integration with InfluxDB and Grafana
JMeter webinar - integration with InfluxDB and GrafanaJMeter webinar - integration with InfluxDB and Grafana
JMeter webinar - integration with InfluxDB and GrafanaRTTS
 
Assuring Contact Center Experiences for Your Customers With ThousandEyes
Assuring Contact Center Experiences for Your Customers With ThousandEyesAssuring Contact Center Experiences for Your Customers With ThousandEyes
Assuring Contact Center Experiences for Your Customers With ThousandEyesThousandEyes
 
Optimizing NoSQL Performance Through Observability
Optimizing NoSQL Performance Through ObservabilityOptimizing NoSQL Performance Through Observability
Optimizing NoSQL Performance Through ObservabilityScyllaDB
 

Recently uploaded (20)

Knowledge engineering: from people to machines and back
Knowledge engineering: from people to machines and backKnowledge engineering: from people to machines and back
Knowledge engineering: from people to machines and back
 
Designing Great Products: The Power of Design and Leadership by Chief Designe...
Designing Great Products: The Power of Design and Leadership by Chief Designe...Designing Great Products: The Power of Design and Leadership by Chief Designe...
Designing Great Products: The Power of Design and Leadership by Chief Designe...
 
IESVE for Early Stage Design and Planning
IESVE for Early Stage Design and PlanningIESVE for Early Stage Design and Planning
IESVE for Early Stage Design and Planning
 
Unsubscribed: Combat Subscription Fatigue With a Membership Mentality by Head...
Unsubscribed: Combat Subscription Fatigue With a Membership Mentality by Head...Unsubscribed: Combat Subscription Fatigue With a Membership Mentality by Head...
Unsubscribed: Combat Subscription Fatigue With a Membership Mentality by Head...
 
IOS-PENTESTING-BEGINNERS-PRACTICAL-GUIDE-.pptx
IOS-PENTESTING-BEGINNERS-PRACTICAL-GUIDE-.pptxIOS-PENTESTING-BEGINNERS-PRACTICAL-GUIDE-.pptx
IOS-PENTESTING-BEGINNERS-PRACTICAL-GUIDE-.pptx
 
Salesforce Adoption – Metrics, Methods, and Motivation, Antone Kom
Salesforce Adoption – Metrics, Methods, and Motivation, Antone KomSalesforce Adoption – Metrics, Methods, and Motivation, Antone Kom
Salesforce Adoption – Metrics, Methods, and Motivation, Antone Kom
 
ODC, Data Fabric and Architecture User Group
ODC, Data Fabric and Architecture User GroupODC, Data Fabric and Architecture User Group
ODC, Data Fabric and Architecture User Group
 
Unpacking Value Delivery - Agile Oxford Meetup - May 2024.pptx
Unpacking Value Delivery - Agile Oxford Meetup - May 2024.pptxUnpacking Value Delivery - Agile Oxford Meetup - May 2024.pptx
Unpacking Value Delivery - Agile Oxford Meetup - May 2024.pptx
 
Custom Approval Process: A New Perspective, Pavel Hrbacek & Anindya Halder
Custom Approval Process: A New Perspective, Pavel Hrbacek & Anindya HalderCustom Approval Process: A New Perspective, Pavel Hrbacek & Anindya Halder
Custom Approval Process: A New Perspective, Pavel Hrbacek & Anindya Halder
 
From Siloed Products to Connected Ecosystem: Building a Sustainable and Scala...
From Siloed Products to Connected Ecosystem: Building a Sustainable and Scala...From Siloed Products to Connected Ecosystem: Building a Sustainable and Scala...
From Siloed Products to Connected Ecosystem: Building a Sustainable and Scala...
 
Empowering NextGen Mobility via Large Action Model Infrastructure (LAMI): pav...
Empowering NextGen Mobility via Large Action Model Infrastructure (LAMI): pav...Empowering NextGen Mobility via Large Action Model Infrastructure (LAMI): pav...
Empowering NextGen Mobility via Large Action Model Infrastructure (LAMI): pav...
 
AI revolution and Salesforce, Jiří Karpíšek
AI revolution and Salesforce, Jiří KarpíšekAI revolution and Salesforce, Jiří Karpíšek
AI revolution and Salesforce, Jiří Karpíšek
 
Exploring UiPath Orchestrator API: updates and limits in 2024 🚀
Exploring UiPath Orchestrator API: updates and limits in 2024 🚀Exploring UiPath Orchestrator API: updates and limits in 2024 🚀
Exploring UiPath Orchestrator API: updates and limits in 2024 🚀
 
Software Delivery At the Speed of AI: Inflectra Invests In AI-Powered Quality
Software Delivery At the Speed of AI: Inflectra Invests In AI-Powered QualitySoftware Delivery At the Speed of AI: Inflectra Invests In AI-Powered Quality
Software Delivery At the Speed of AI: Inflectra Invests In AI-Powered Quality
 
Key Trends Shaping the Future of Infrastructure.pdf
Key Trends Shaping the Future of Infrastructure.pdfKey Trends Shaping the Future of Infrastructure.pdf
Key Trends Shaping the Future of Infrastructure.pdf
 
Connector Corner: Automate dynamic content and events by pushing a button
Connector Corner: Automate dynamic content and events by pushing a buttonConnector Corner: Automate dynamic content and events by pushing a button
Connector Corner: Automate dynamic content and events by pushing a button
 
In-Depth Performance Testing Guide for IT Professionals
In-Depth Performance Testing Guide for IT ProfessionalsIn-Depth Performance Testing Guide for IT Professionals
In-Depth Performance Testing Guide for IT Professionals
 
JMeter webinar - integration with InfluxDB and Grafana
JMeter webinar - integration with InfluxDB and GrafanaJMeter webinar - integration with InfluxDB and Grafana
JMeter webinar - integration with InfluxDB and Grafana
 
Assuring Contact Center Experiences for Your Customers With ThousandEyes
Assuring Contact Center Experiences for Your Customers With ThousandEyesAssuring Contact Center Experiences for Your Customers With ThousandEyes
Assuring Contact Center Experiences for Your Customers With ThousandEyes
 
Optimizing NoSQL Performance Through Observability
Optimizing NoSQL Performance Through ObservabilityOptimizing NoSQL Performance Through Observability
Optimizing NoSQL Performance Through Observability
 

Chi sq explanation

  • 1. CHI-SQUARE TEST EXPLANATION Let’s say you want to know if there is a difference in the proportion of men and women who are left handed and let’s say in your sample 10% of men and 5% of women were left -handed. How it’s Calculated (Without the gory details) 1. You collect the data. For example, you ask 120 men and 140 women which hand they use and get this: ACTUAL DATA Left-handed Right-handed Men 12 108 Women 7 133 2. Calculate what numbers of left and right-handers we would expect IF men and women were the same. In this case, IF men and women were equally left and right handed, we would have expected these numbers in our sample of 260 people (Ask if you want to know how this is done): EXPECTED IF NO DIFFERENCE Left-handed Right-handed Men 8.77 111.23 Women 10.23 129.77 3. The computer calculates a Chi-square (pronounced Ki-square) value. The Chi-square value is a single number that adds up all the differences between our actual data and the data expected if there is no difference. If the actual data and expected data (if no difference) are identical, the Chi -square value is 0. A bigger difference will give a bigger Chi-square value. 4. Look up the Chi-square value in a table to see if it is big enough to indicate a significant difference in handedness of males and females. Interpretation Greater differences between expected and actual data produce a larger Chi -square value. The larger the Chi-square value, the greater the probability that there really is a significant difference. With a 2 by 2 table like this (If you have more than 4 cells of data in your table, see your instructor): If the Chi-square value is greater than or equal to the critical value There is a significant difference between the groups we are studying. That is, the difference between actual data and the expected data (that assumes the groups aren’t different) is probably too great to be attributed to chance. So we conclude that our sample supports the hypothesis of a difference. If the Chi-square value is less than the critical value There is no significant difference. The amount of difference between expected and actual data is likely just due to chance. Thus, we conclude that our sample does not support the hypothesis of a difference. In this example, the critical value is 3.8. The Chi-square value was 2.383, which is less than 3.8. Thus, there is no significant difference in handedness between men and women in our sample. We conclude that based on this sample, men and women in general seem equally likely to be left or right handed. **Warning** We have not proven anything!!! These first samples might be atypical. Repeated sampling may show a significant difference, or eliminate the difference we thought we saw. Because of this uncertainty, we can only say that the hypothesis was supported or not supported.
  • 2. Graphing Categorical Data that you analyze with the Chi -Square Statistic Let’s say you want to know if there is a difference in the proportion of men and women who are left handed and you collect this data: ACTUAL DATA Left-handed Right-handed Men 12 108 Women 7 133 Calculate the % of men that are left-handed and right handed in your study: 12 / 120 total men = 0.10 X 10 = 10% of men were left -handed 108 / 120 = 0.90 X 100 = 90% of men were right-handed Do the same for women: 7 / 140 total women = 0.05 X 100 = 5% left handed 133 / 140 = 0.95 X 100 = 95% right-handed Plot these percents as bars: Percent Lef t Hand ed 30 20 10 Men Women Or plot as stacked bars: 10 0 Percent 50 Or plot as a pie diagram. Lef t- handed Rig ht -handed Men Women