


![CHC COG ACH Important Broad & Narrow Abilities Cognitive Efficiency Achievement Domains BRS BRS BRS RC RC RC MCS MCS MCS MR MR MR Age Range 6-8 9-13 14-19 6-8 9-13 14-19 6-8 9-13 14-19 6-8 9-13 14-19 Broad/Narrow CHC Abilities Gsm Short-term memory X X X Working Memory (MW) X X X X X X X X X X X X Memory Span (MS) X X X Gs Processing speed X X X X X Perceptual Speed (P) [# fluency N ?] X X X X X X X X X X X X Attention-conc/Exec-funct (AC/EF?) X X X Glr Long-term storage and retrieval X Associative Memory (MA) X X X Naming Facility (NA) X X X X X X X Meaningful Memory (MM) X X Gc Comprehension-Knowledge X X X X X X X X X X X Language Development (LD) X X X X X X X X X X X General Information (K0) X X X X X X X X X Listening Ability (LS) X X X X X X X X X Lexical Knowledge (VL) X X X X X X Ga Auditory Processing X Phonetic Coding (PC) X X X X X X ? ? ? ? ? ? Spc-Snd Disc/Res to ASD (US/UR) X X Gf Fluid Reasoning X X X X X X Gen. Seq. Reasoning (RG) X X X X X X Quantitative Reasoning (RQ) X X X X X X](https://image.slidesharecdn.com/chcsignbrs-1232660864726612-1/85/CHC-Cog-Ach-Relations-Research-Synthesis-116-320.jpg)

![CHC COG ACH Important Narrow Abilities Cognitive Efficiency Achievement Domains BRS BRS BRS RC RC RC MCS MCS MCS MR MR MR Age Range 6-8 9-13 14-19 6-8 9-13 14-19 6-8 9-13 14-19 6-8 9-13 14-19 Broad/Narrow CHC Abilities Gsm Working Memory (MW) X X X X X X X X X X X X Memory Span (MS) X X X Gs Perceptual Speed (P) [# fluency N ?] X X X X X X X X X X X X Attention-conc/Exec-funct (AC/EF?) X X X Glr Associative Memory (MA) X X X Naming Facility (NA) X X X X X X X Meaningful Memory (MM) X X Gc Language Development (LD) X X X X X X X X X X X General Information (K0) X X X X X X X X X Listening Ability (LS) X X X X X X X X X Lexical Knowledge (VL) X X X X X X Ga Phonetic Coding (PC) X X X X X X ? ? ? ? ? ? Spc-Snd Disc/Res to ASD (US/UR) X X Gf Gen. Seq. Reasoning (RG) X X X X X X Quantitative Reasoning (RQ) X X X X X X](https://image.slidesharecdn.com/chcsignbrs-1232660864726612-1/85/CHC-Cog-Ach-Relations-Research-Synthesis-118-320.jpg)

![CHC COG ACH Important Narrow Abilities: Domain general abilities Cognitive Efficiency Achievement Domains BRS BRS BRS RC RC RC MCS MCS MCS MR MR MR Age Range 6-8 9-13 14-19 6-8 9-13 14-19 6-8 9-13 14-19 6-8 9-13 14-19 Broad/Narrow CHC Abilities Gsm Short-term memory Working Memory (MW) X X X X X X X X X X X X Memory Span (MS) X X X Gs Processing speed Perceptual Speed (P) [# fluency N ?] X X X X X X X X X X X X Attention-conc/Exec-funct (AC/EF?) X X X Glr Long-term storage and retrieval Associative Memory (MA) X X X Naming Facility (NA) X X X X X X X Meaningful Memory (MM) X X Gc Comprehension-Knowledge Language Development (LD) X X X X X X X X X X X General Information (K0) X X X X X X X X X Listening Ability (LS) X X X X X X X X X Lexical Knowledge (VL) X X X X X X Ga Auditory Processing Phonetic Coding (PC) X X X X X X ? ? ? ? ? ? Spc-Snd Disc/Res to ASD (US/UR) X X Gf Fluid Reasoning Gen. Seq. Reasoning (RG) X X X X X X Quantitative Reasoning (RQ) X X X X X X](https://image.slidesharecdn.com/chcsignbrs-1232660864726612-1/85/CHC-Cog-Ach-Relations-Research-Synthesis-120-320.jpg)

![CHC COG ACH Important Narrow Abilities : Domain-specific abilities Cognitive Efficiency Achievement Domains BRS BRS BRS RC RC RC MCS MCS MCS MR MR MR Age Range 6-8 9-13 14-19 6-8 9-13 14-19 6-8 9-13 14-19 6-8 9-13 14-19 Broad/Narrow CHC Abilities Gsm Short-term memory Working Memory (MW) X X X X X X X X X X X X Memory Span (MS) X X X Gs Processing speed Perceptual Speed (P) [# fluency N ?] X X X X X X X X X X X X Attention-conc/Exec-funct (AC/EF?) X X X Glr Long-term storage and retrieval Associative Memory (MA) X X X Naming Facility (NA) X X X X X X X Meaningful Memory (MM) X X Gc Comprehension-Knowledge Language Development (LD) X X X X X X X X X X X General Information (K0) X X X X X X X X X Listening Ability (LS) X X X X X X X X X Lexical Knowledge (VL) X X X X X X Ga Auditory Processing Phonetic Coding (PC) X X X X X X ? ? ? ? ? ? Spc-Snd Disc/Res to ASD (US/UR) X X Gf Fluid Reasoning Gen. Seq. Reasoning (RG) X X X X X X Quantitative Reasoning (RQ) X X X X X X](https://image.slidesharecdn.com/chcsignbrs-1232660864726612-1/85/CHC-Cog-Ach-Relations-Research-Synthesis-122-320.jpg)
![CHC COG ACH Important Narrow Abilities Cognitive Efficiency Possible important BRS vs RC CHC ability differences? Achievement Domains BRS BRS BRS RC RC RC Age Range 6-8 9-13 14-19 6-8 9-13 14-19 Broad/Narrow CHC Abilities Gsm Short-term memory Working Memory (MW) X X X X X X Memory Span (MS) X X X Gs Processing speed Perceptual Speed (P) [# fluency N ?] X X X X X X Attention-conc/Exec-funct (AC/EF?) Glr Long-term storage and retrieval Associative Memory (MA) X X Naming Facility (NA) X X X X Meaningful Memory (MM) X X Gc Comprehension-Knowledge Language Development (LD) X X X X X X General Information (K0) X X X X X X Listening Ability (LS) X X X X Lexical Knowledge (VL) X X X X X X Ga Auditory Processing Phonetic Coding (PC) X X X X X X Spc-Snd Disc/Res to ASD (US/UR) X X Gf Fluid Reasoning Gen. Seq. Reasoning (RG) Quantitative Reasoning (RQ)](https://image.slidesharecdn.com/chcsignbrs-1232660864726612-1/85/CHC-Cog-Ach-Relations-Research-Synthesis-123-320.jpg)
![CHC COG ACH Important Broad & Narrow Abilities Cognitive Efficiency Possible important BMS vs MR CHC ability differences? Achievement Domains MCS MCS MCS MR MR MR Age Range 6-8 9-13 14-19 6-8 9-13 14-19 Broad/Narrow CHC Abilities Gsm Short-term memory Working Memory (MW) X X X X X X Memory Span (MS) Gs Processing speed Perceptual Speed (P) [# fluency N ?] X X X X X X Attention-conc/Exec-funct (AC/EF?) X X X Glr Long-term storage and retrieval Associative Memory (MA) X Naming Facility (NA) X X X Meaningful Memory (MM) Gc Comprehension-Knowledge Language Development (LD) X X X X X General Information (K0) X X X Listening Ability (LS) X X X X X Lexical Knowledge (VL) Ga Auditory Processing Phonetic Coding (PC) ? ? ? ? ? ? Spc-Snd Disc/Res to ASD (US/UR) Gf Fluid Reasoning Gen. Seq. Reasoning (RG) X X X X X X Quantitative Reasoning (RQ) X X X X X X](https://image.slidesharecdn.com/chcsignbrs-1232660864726612-1/85/CHC-Cog-Ach-Relations-Research-Synthesis-124-320.jpg)


![CHC COG ACH Important Narrow Abilities: Developmental specific possibilities? Cognitive Efficiency Achievement Domains BRS BRS BRS RC RC RC MCS MCS MCS MR MR MR Age Range 6-8 9-13 14-19 6-8 9-13 14-19 6-8 9-13 14-19 6-8 9-13 14-19 Broad/Narrow CHC Abilities Gsm Short-term memory Working Memory (MW) X X X X X X X X X X X X Memory Span (MS) X X X Gs Processing speed Perceptual Speed (P) [# fluency N ?] X X X X X X X X X X X X Attention-conc/Exec-funct (AC/EF?) X X X Glr Long-term storage and retrieval Associative Memory (MA) X X X Naming Facility (NA) X X X X X X X Meaningful Memory (MM) X X Gc Comprehension-Knowledge Language Development (LD) X X X X X X X X X X X General Information (K0) X X X X X X X X X Listening Ability (LS) X X X X X X X X X Lexical Knowledge (VL) X X X X X X Ga Auditory Processing Phonetic Coding (PC) X X X X X X ? ? ? ? ? ? Spc-Snd Disc/Res to ASD (US/UR) X X Gf Fluid Reasoning Gen. Seq. Reasoning (RG) X X X X X X Quantitative Reasoning (RQ) X X X X X X](https://image.slidesharecdn.com/chcsignbrs-1232660864726612-1/85/CHC-Cog-Ach-Relations-Research-Synthesis-127-320.jpg)


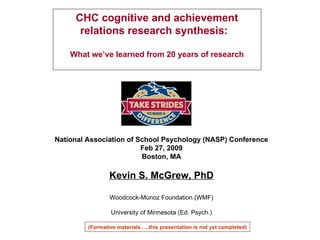
This presentation by Dr. Kevin McGrew at the NASP conference focuses on a synthesis of 20 years of research on the cognitive and achievement relations within the CHC framework. It discusses limitations in existing research, the criteria for study inclusion, and methodologies used, particularly highlighting the role of Cattell-Horn-Carroll cognitive abilities in predicting academic achievement in reading and math. The presentation aims to enhance understanding and validity of interpretations drawn from intelligence testing and intervention in educational settings.


