Download as PDF, PPTX


![Renderer Example
column.setRenderer(new SeriesRenderer<Data>() {
@Override
public Sprite spriteRenderer(Sprite sprite, int index, ListStore<Data>
store) {
sprite.setFill(colors[index % colors.length]);
return sprite;
}
});
column.setHighlighter(new SeriesHighlighter() {
@Override
public void hightlight(Sprite sprite) {
sprite.setStroke(new RGB(85, 85, 204));
DrawFx.createStrokeWidthAnimator(sprite, 3).run(250);
}
@Override
public void unhightlight(Sprite sprite) {
sprite.setStroke(Color.NONE);
DrawFx.createStrokeWidthAnimator(sprite, 0).run(250);
}
});
Wednesday, November 2, 2011](https://image.slidesharecdn.com/drawingandcharting-111102185252-phpapp01/75/Charting-Data-Visualization-in-Ext-GWT-3-0-46-2048.jpg)

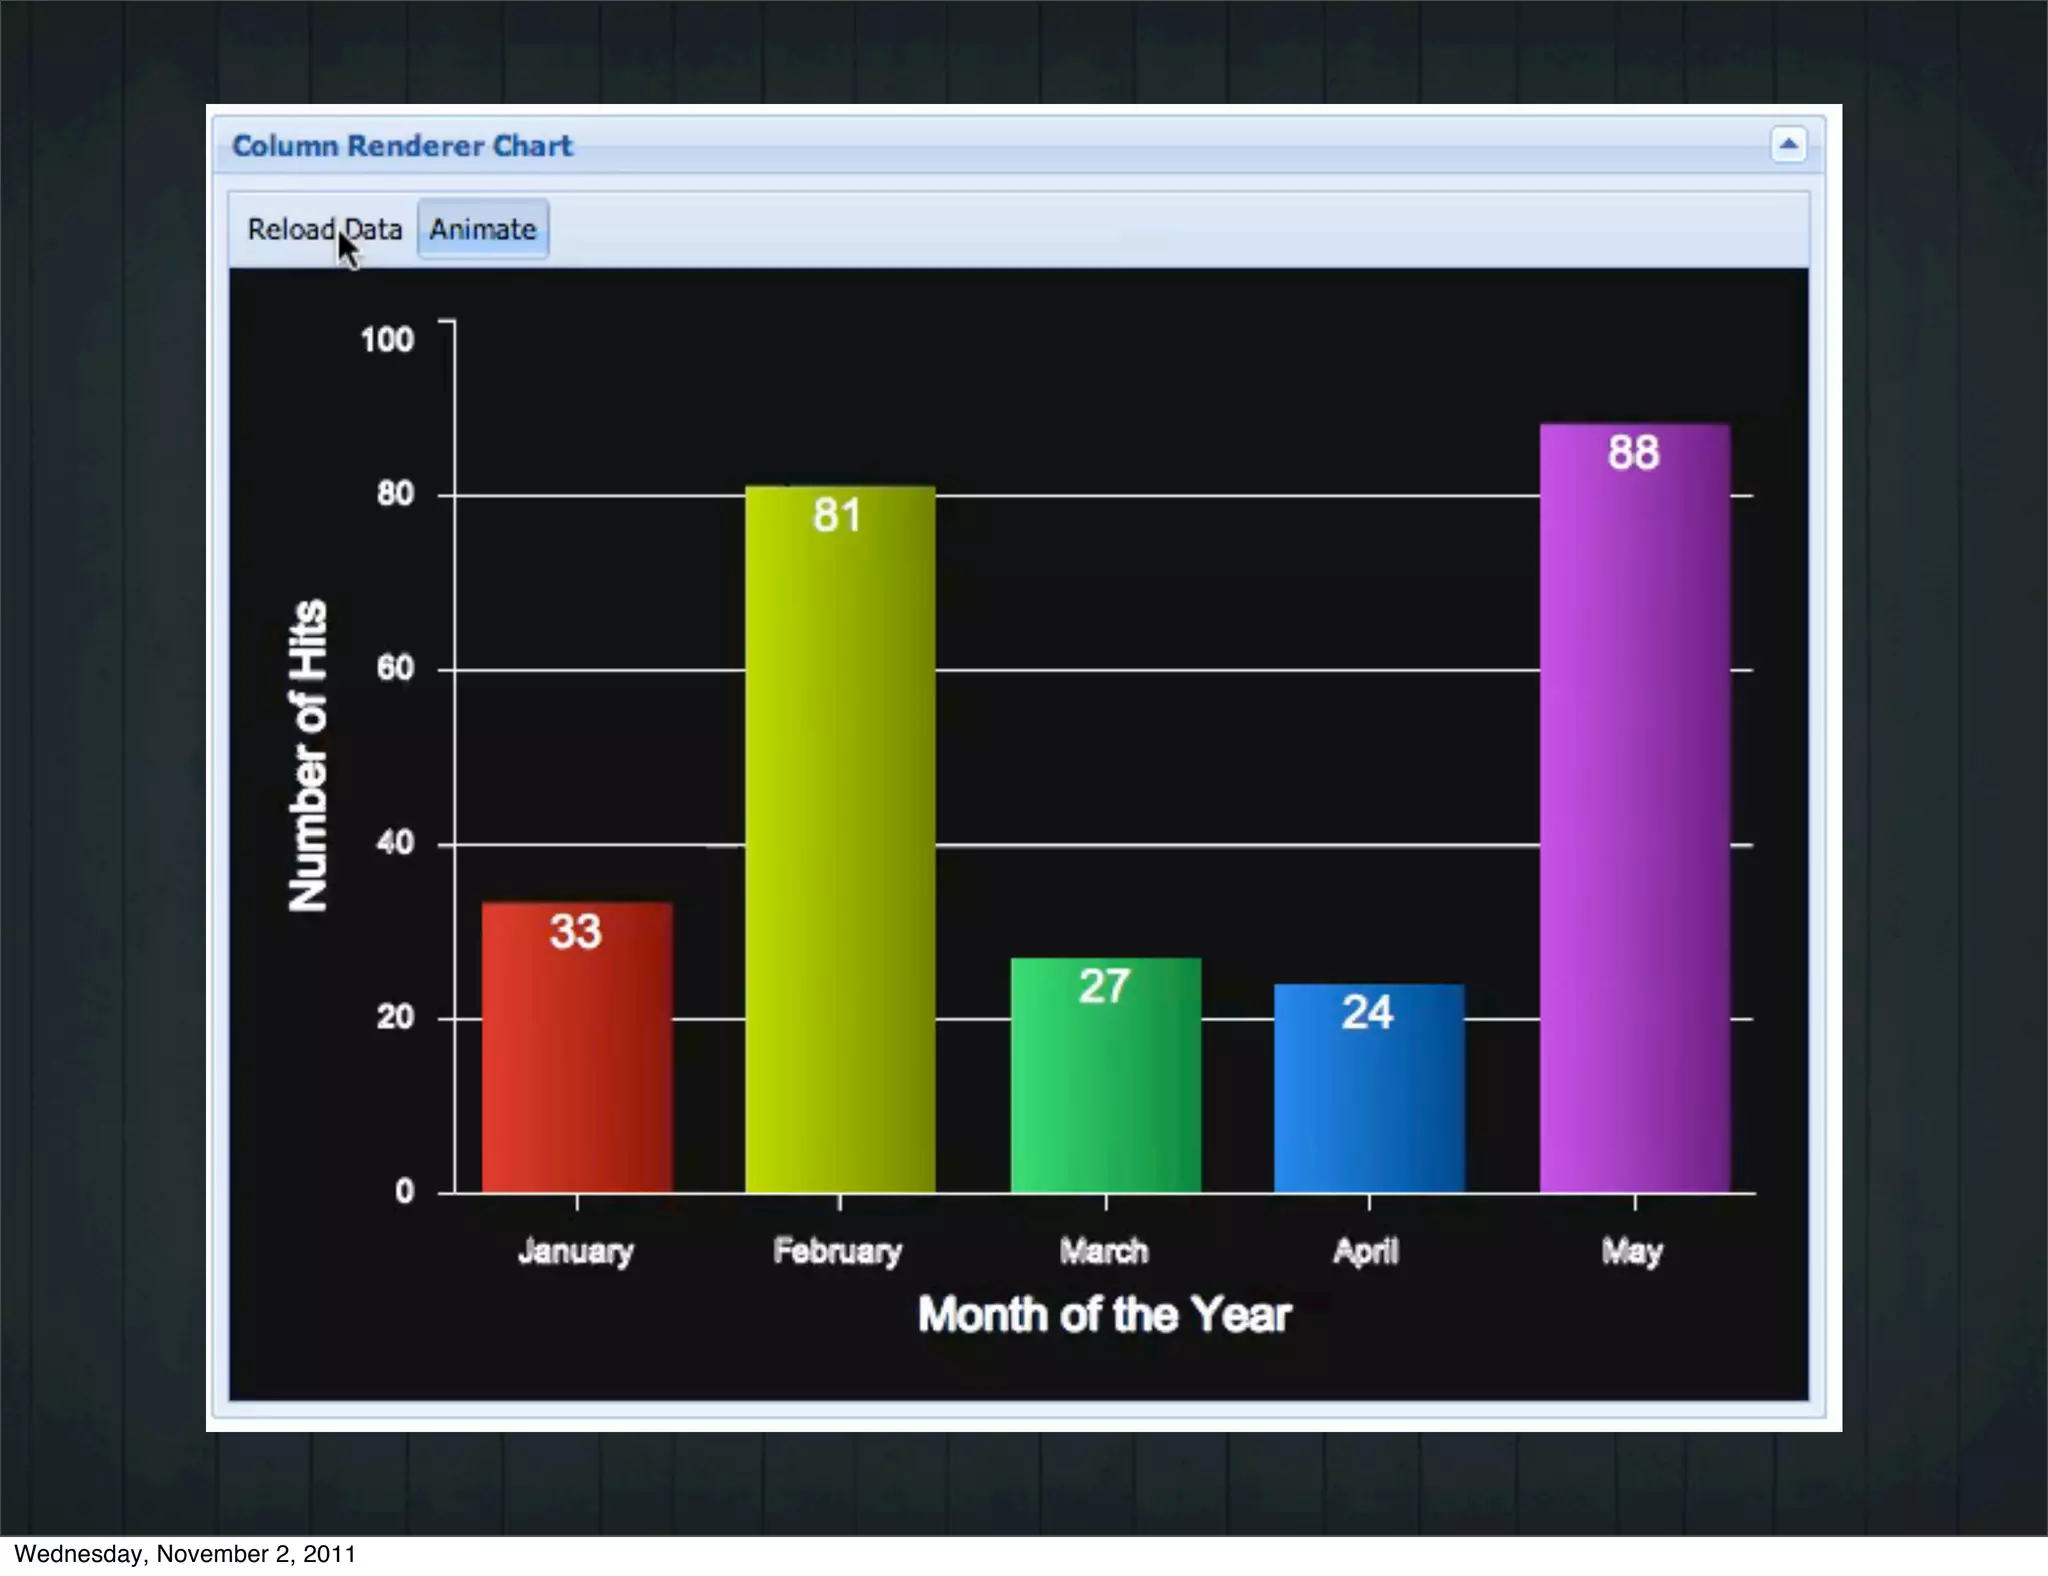
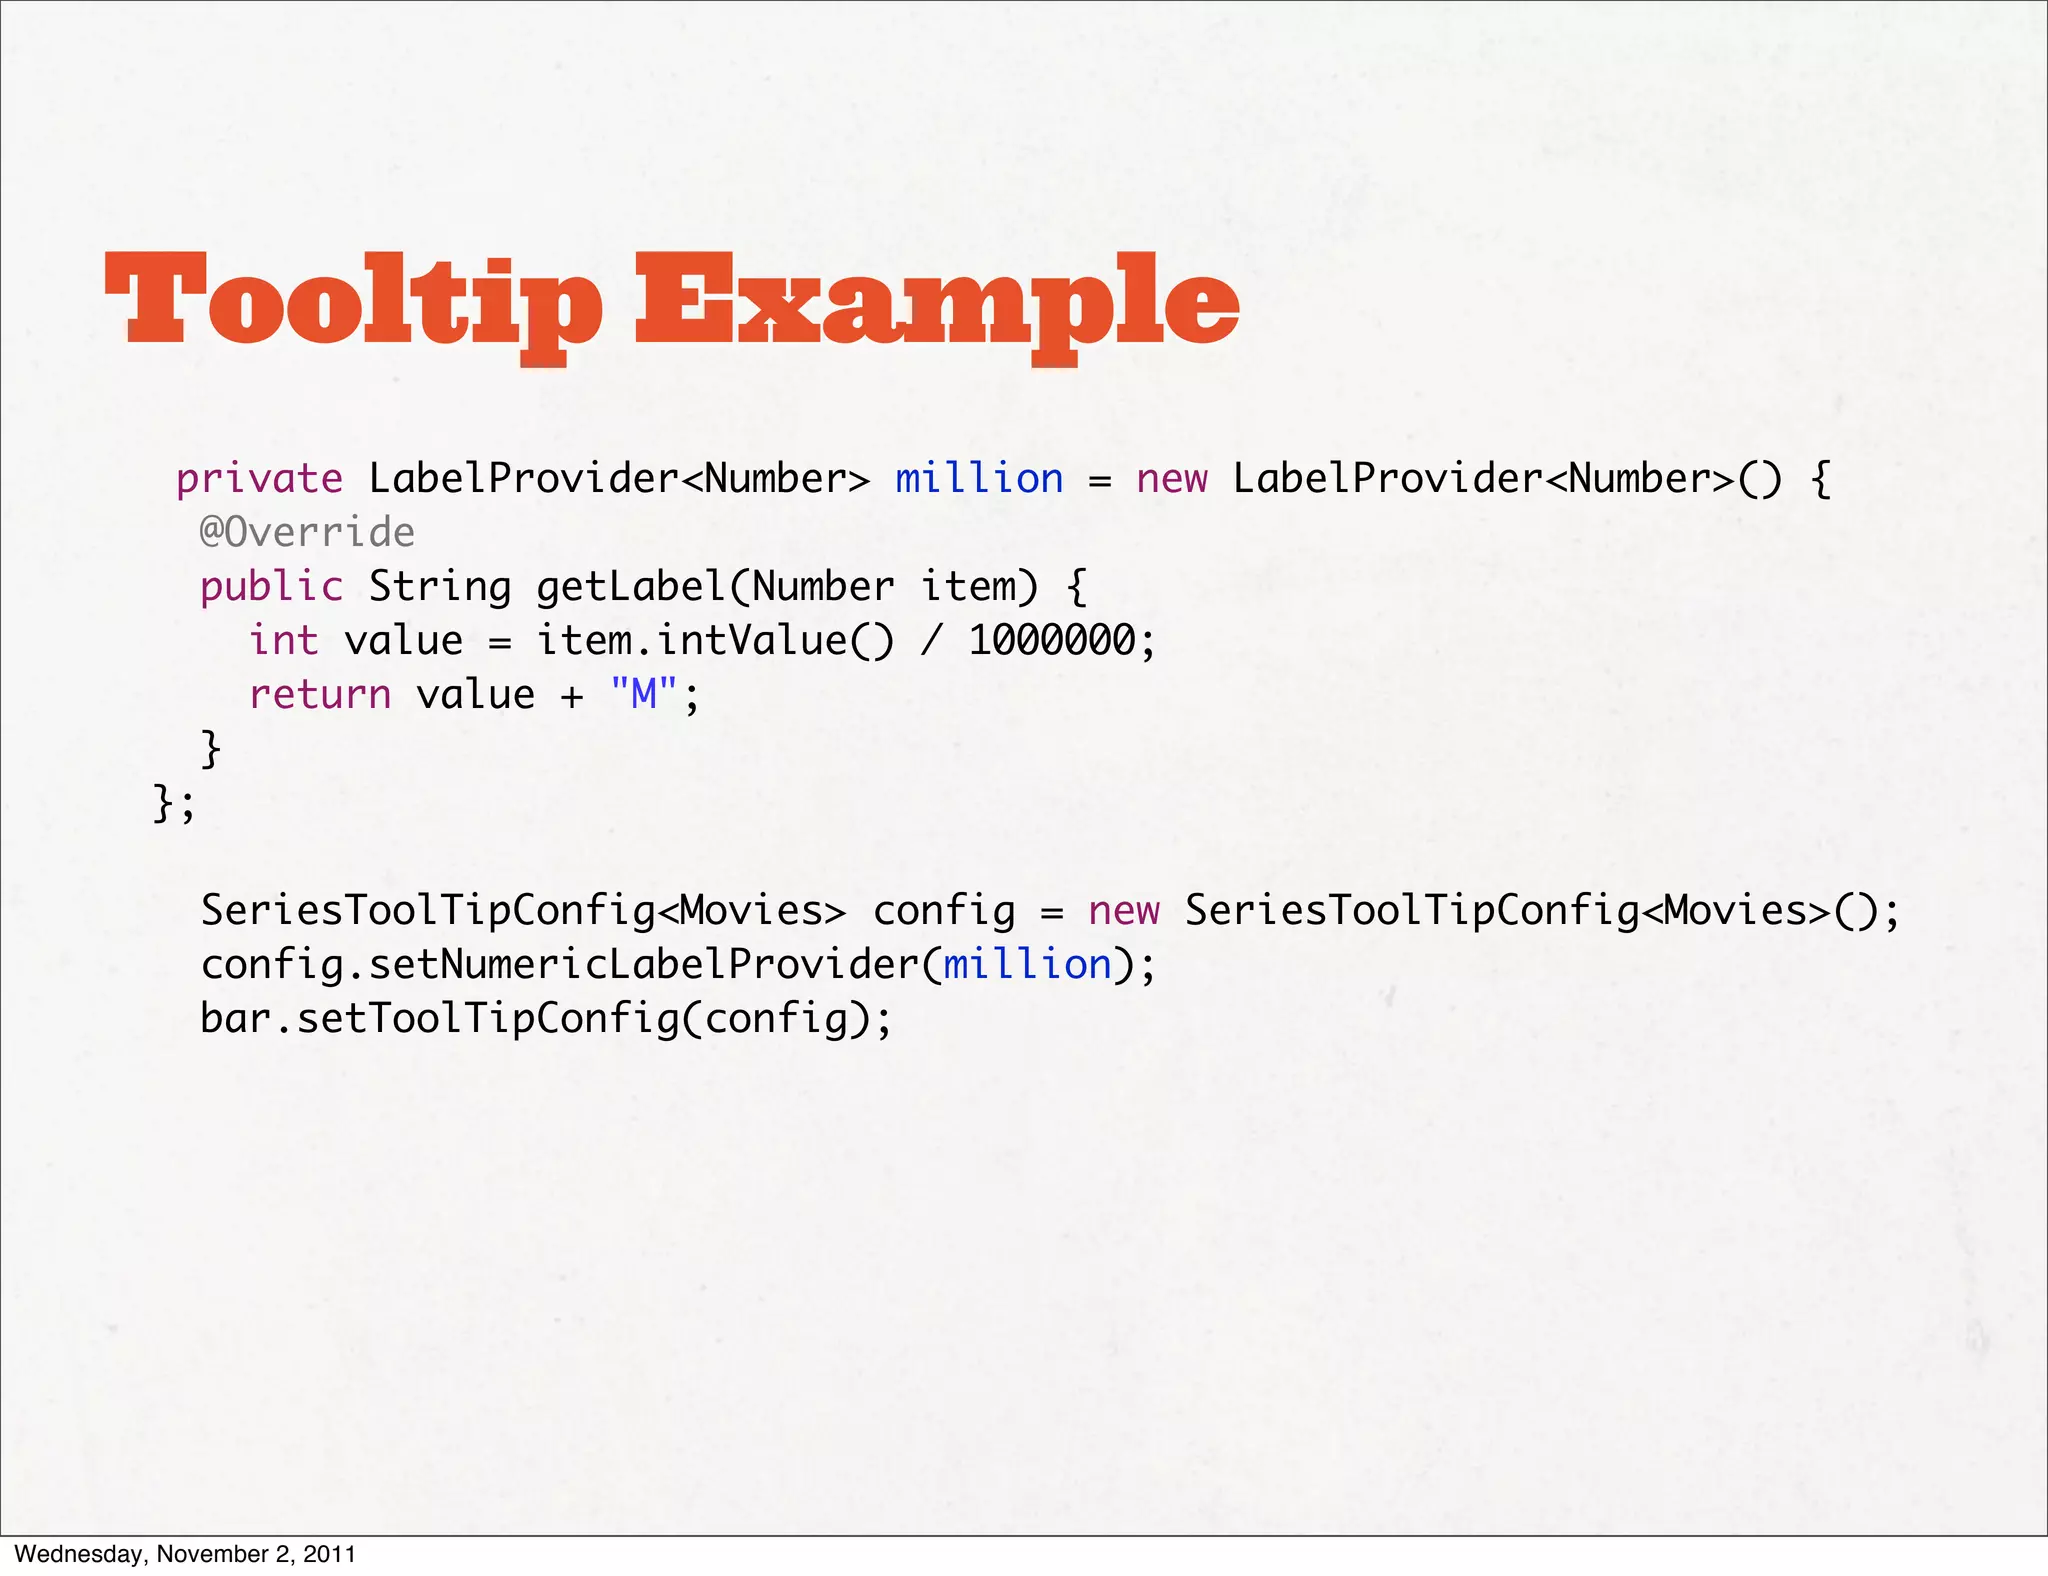

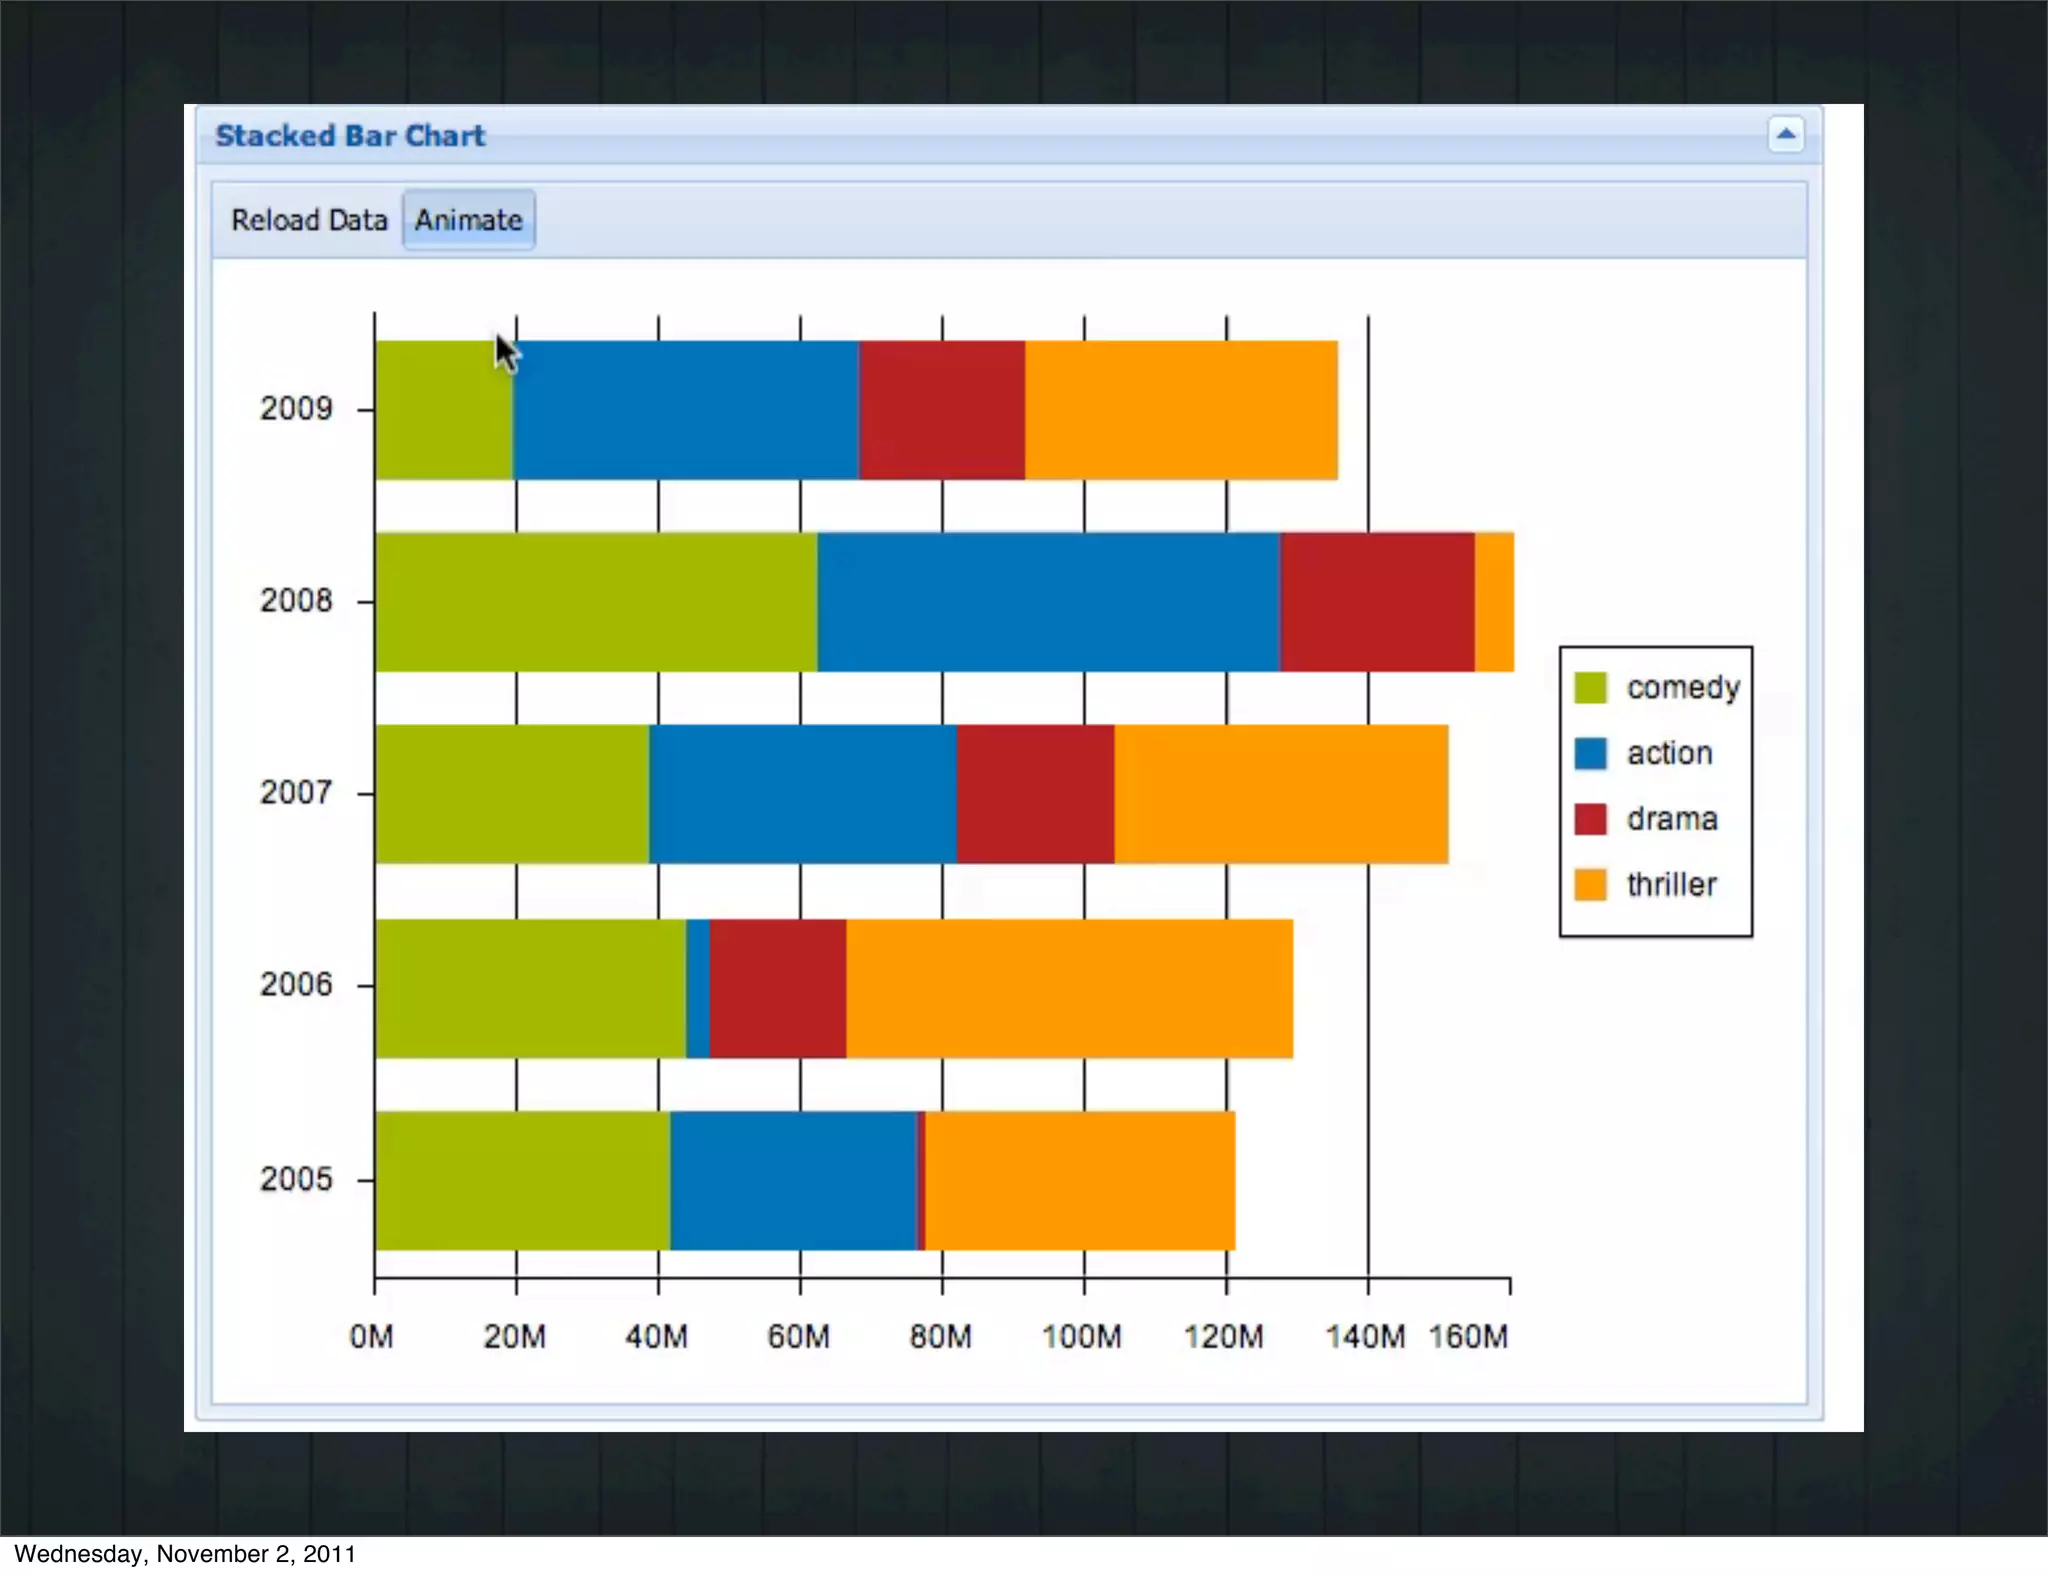
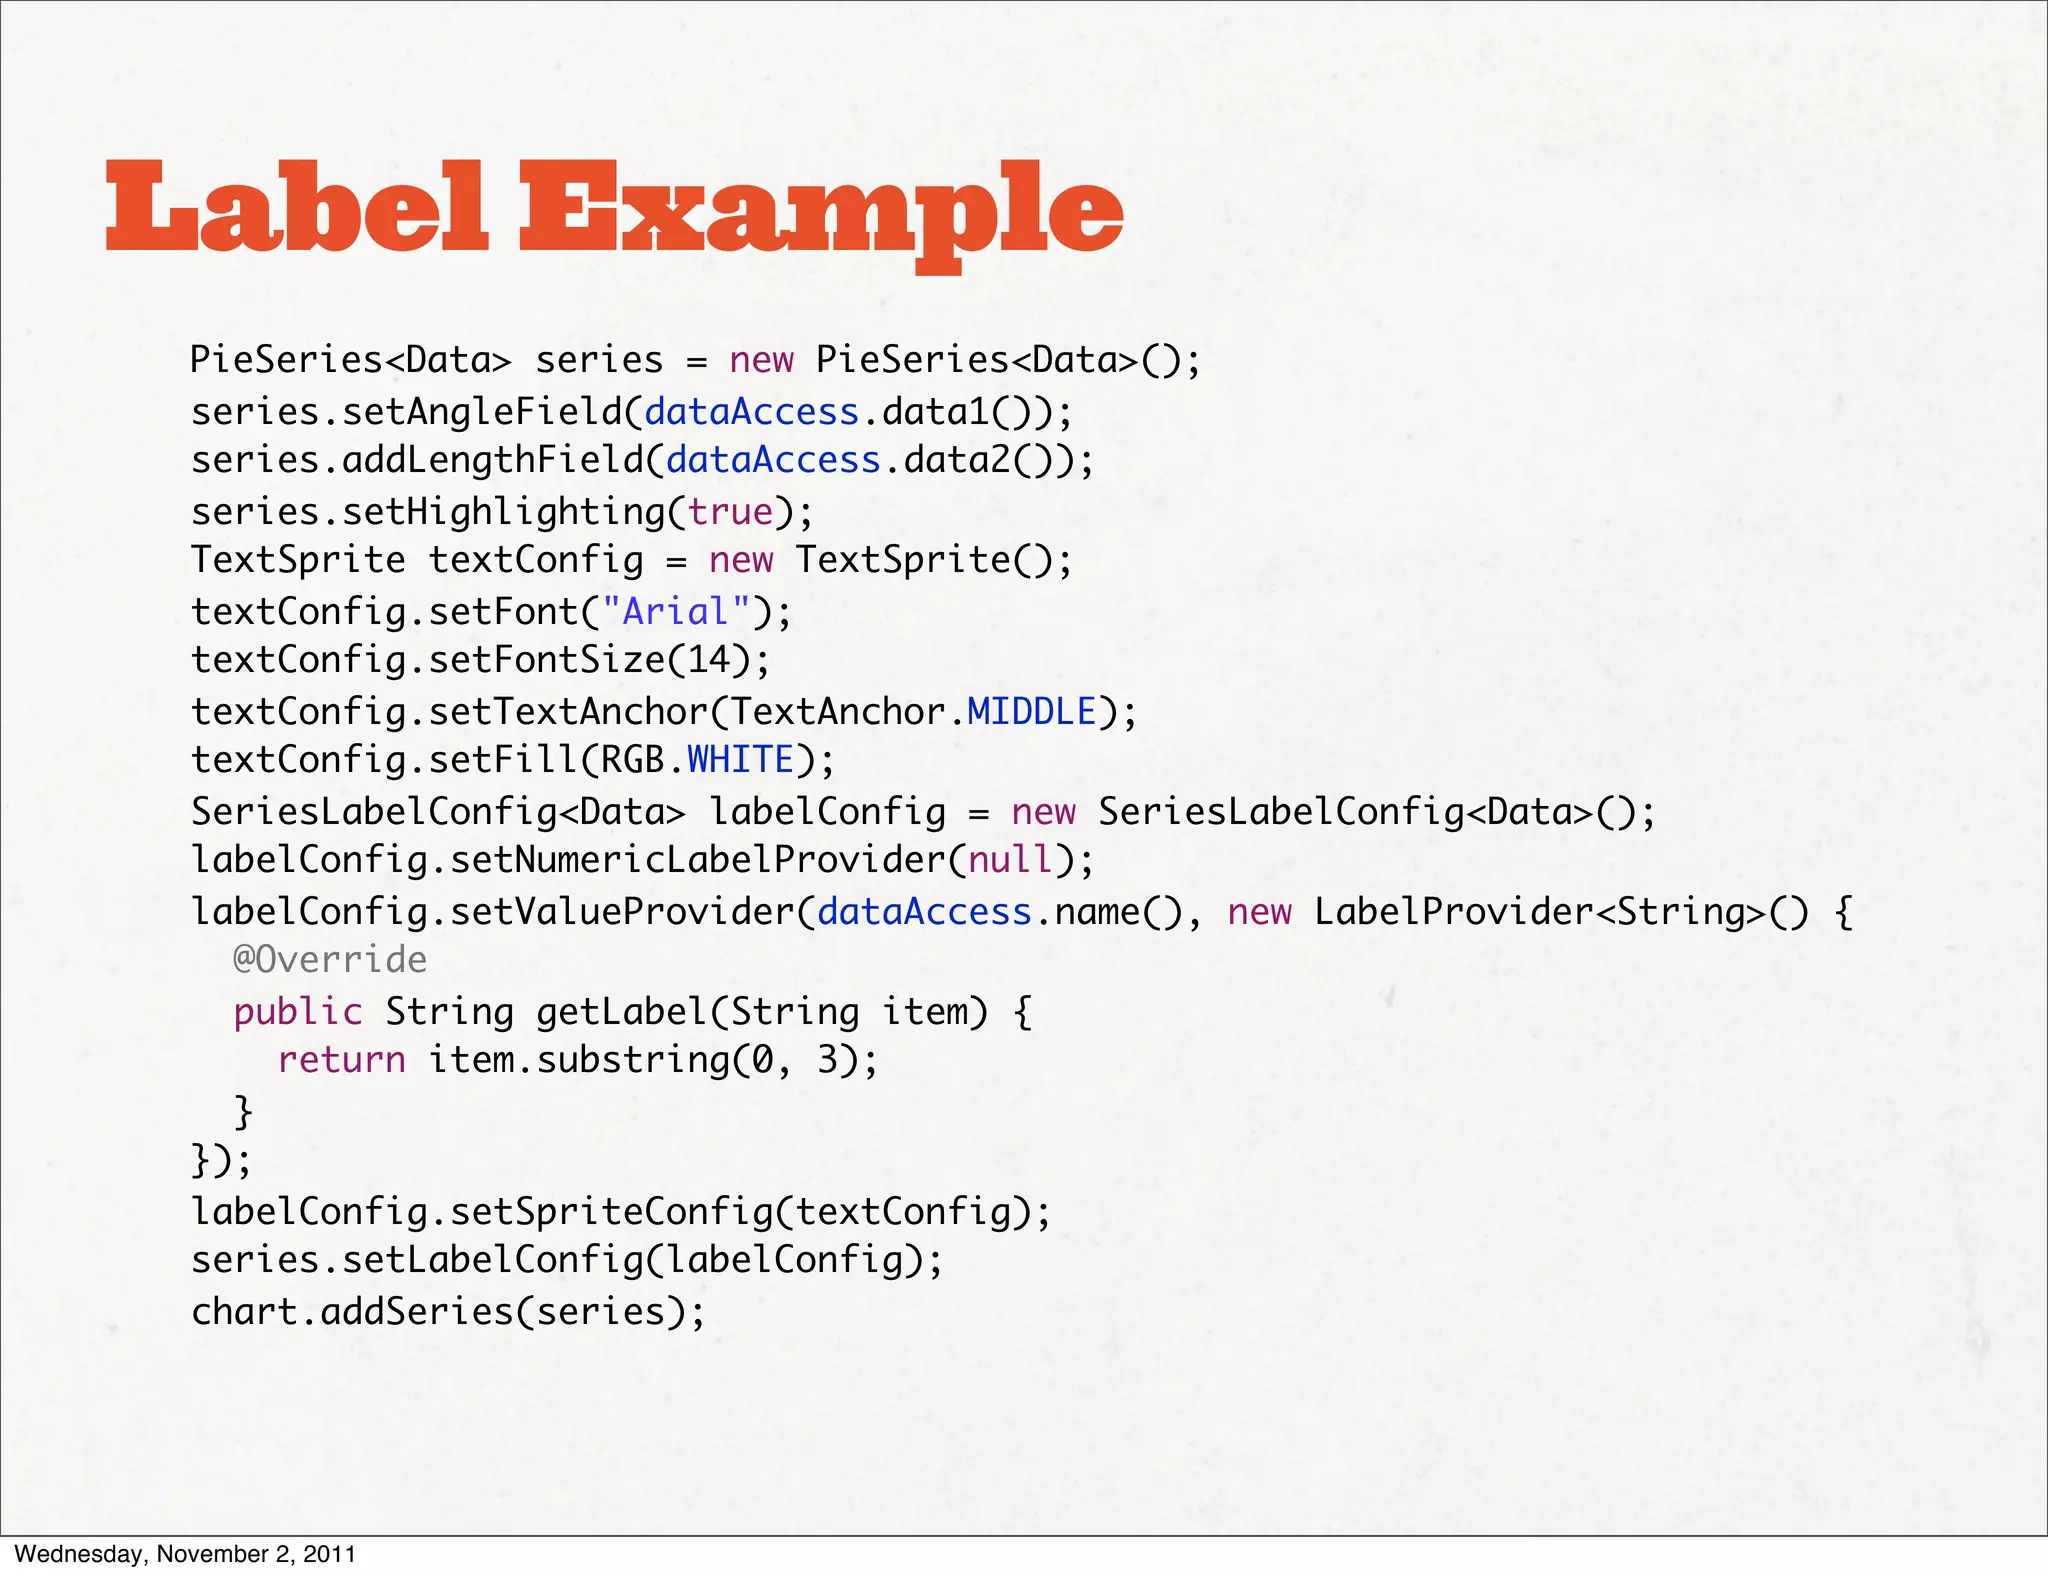

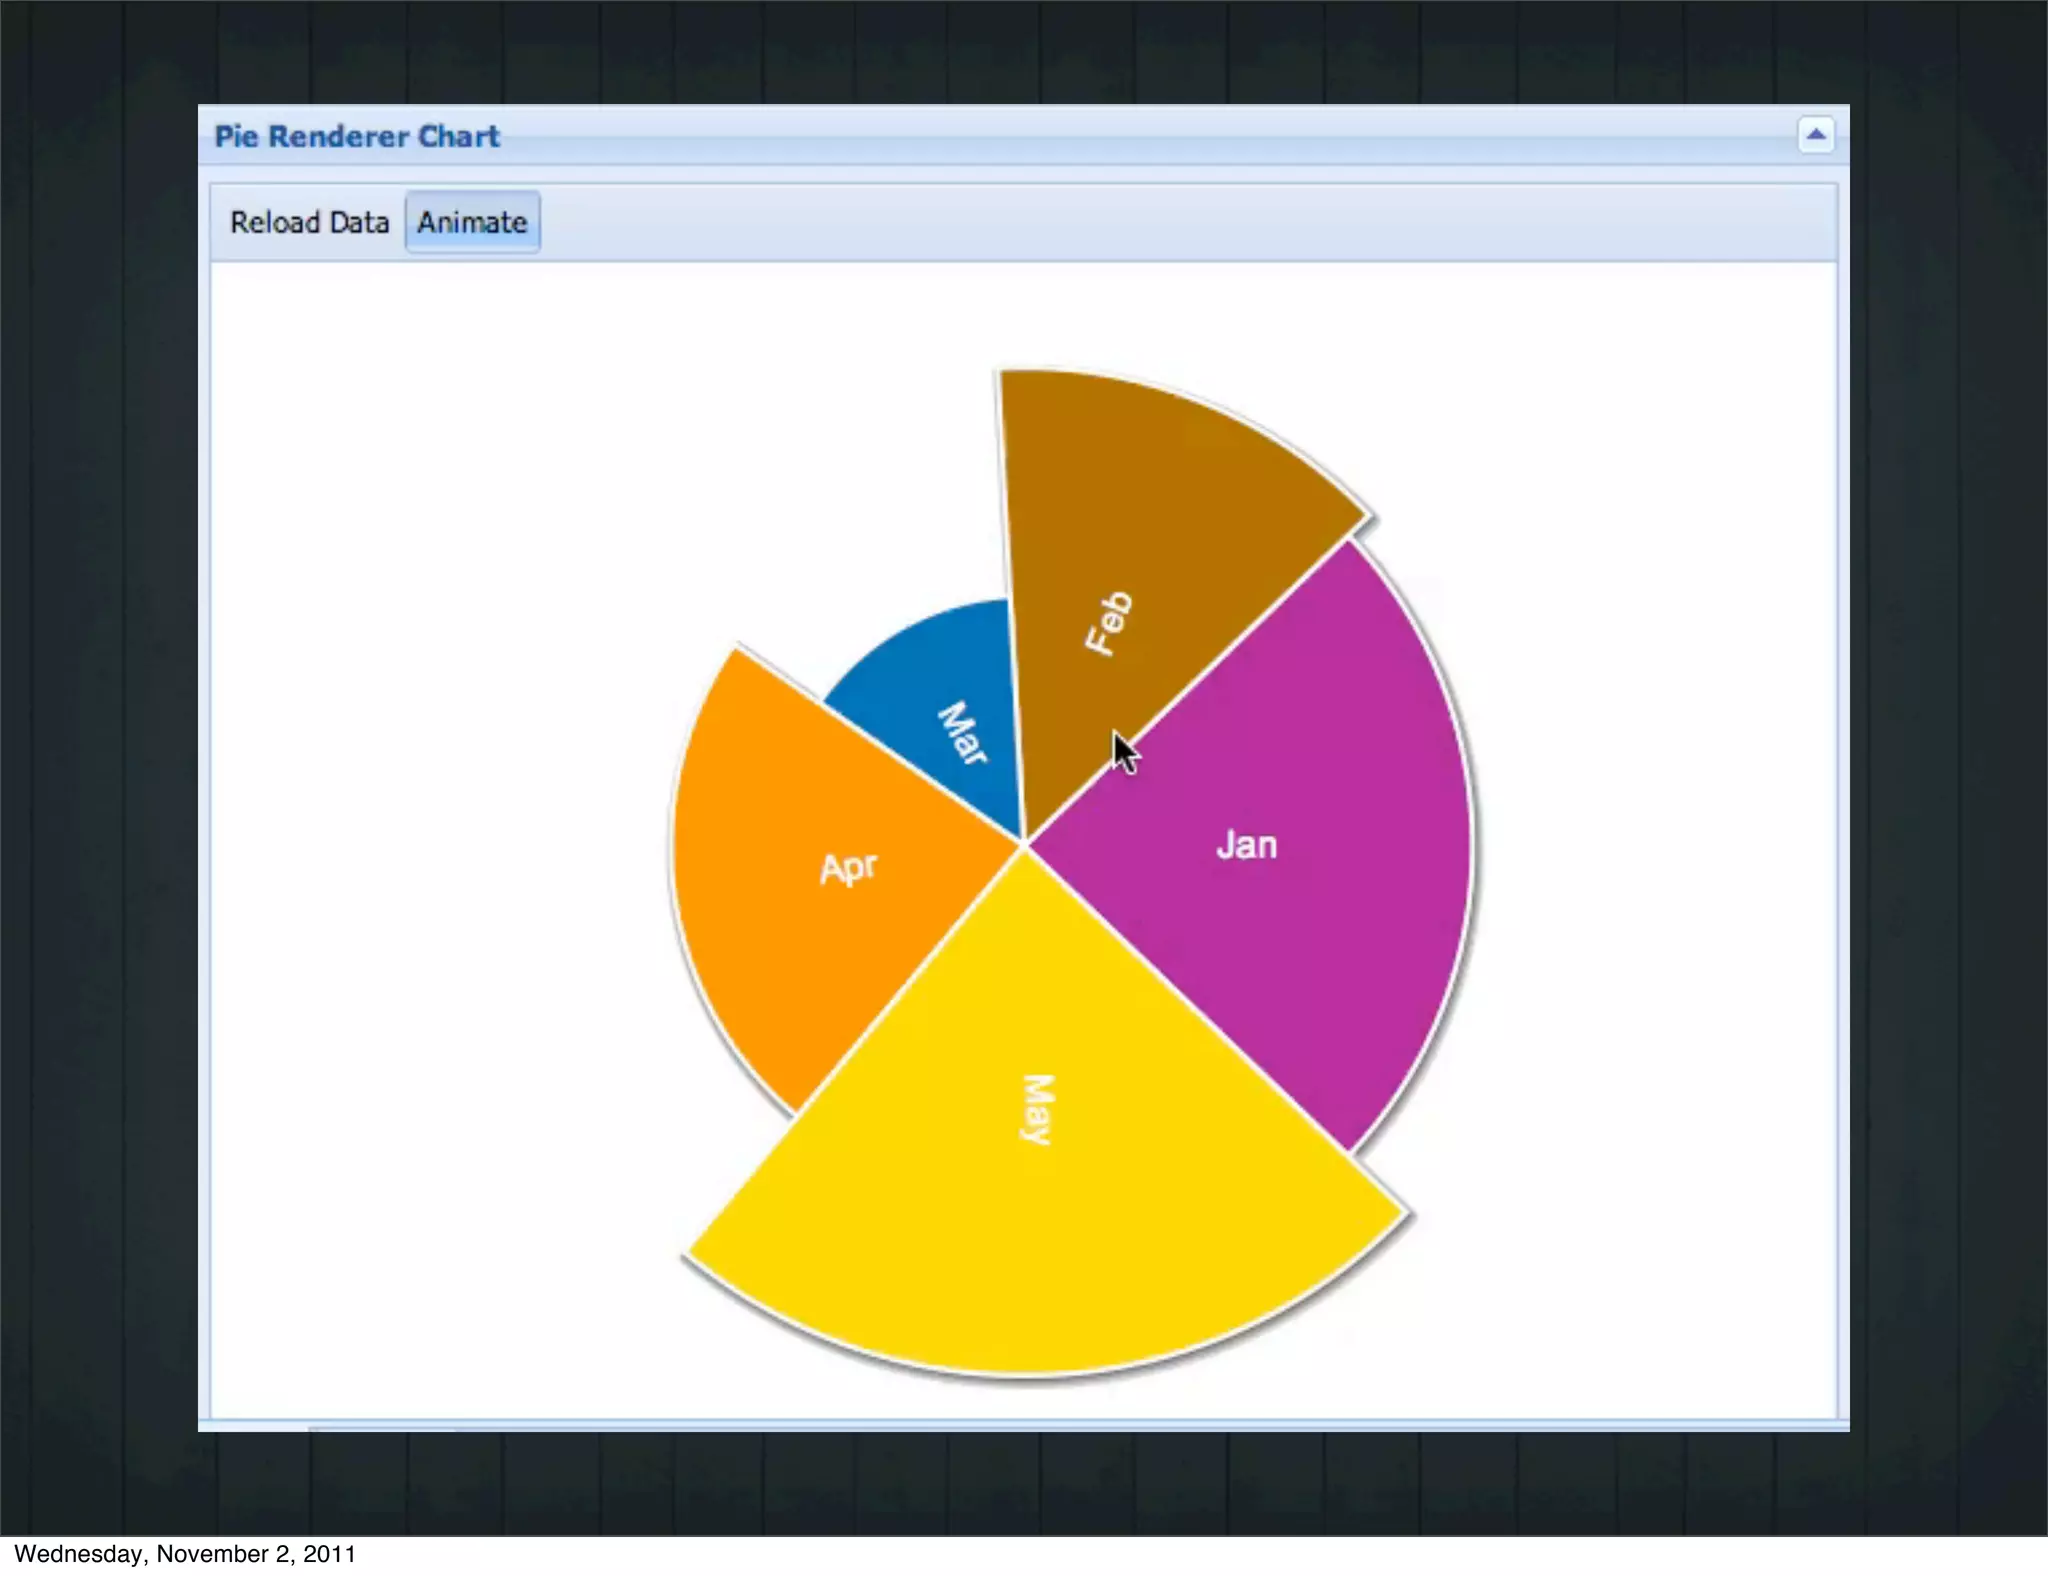
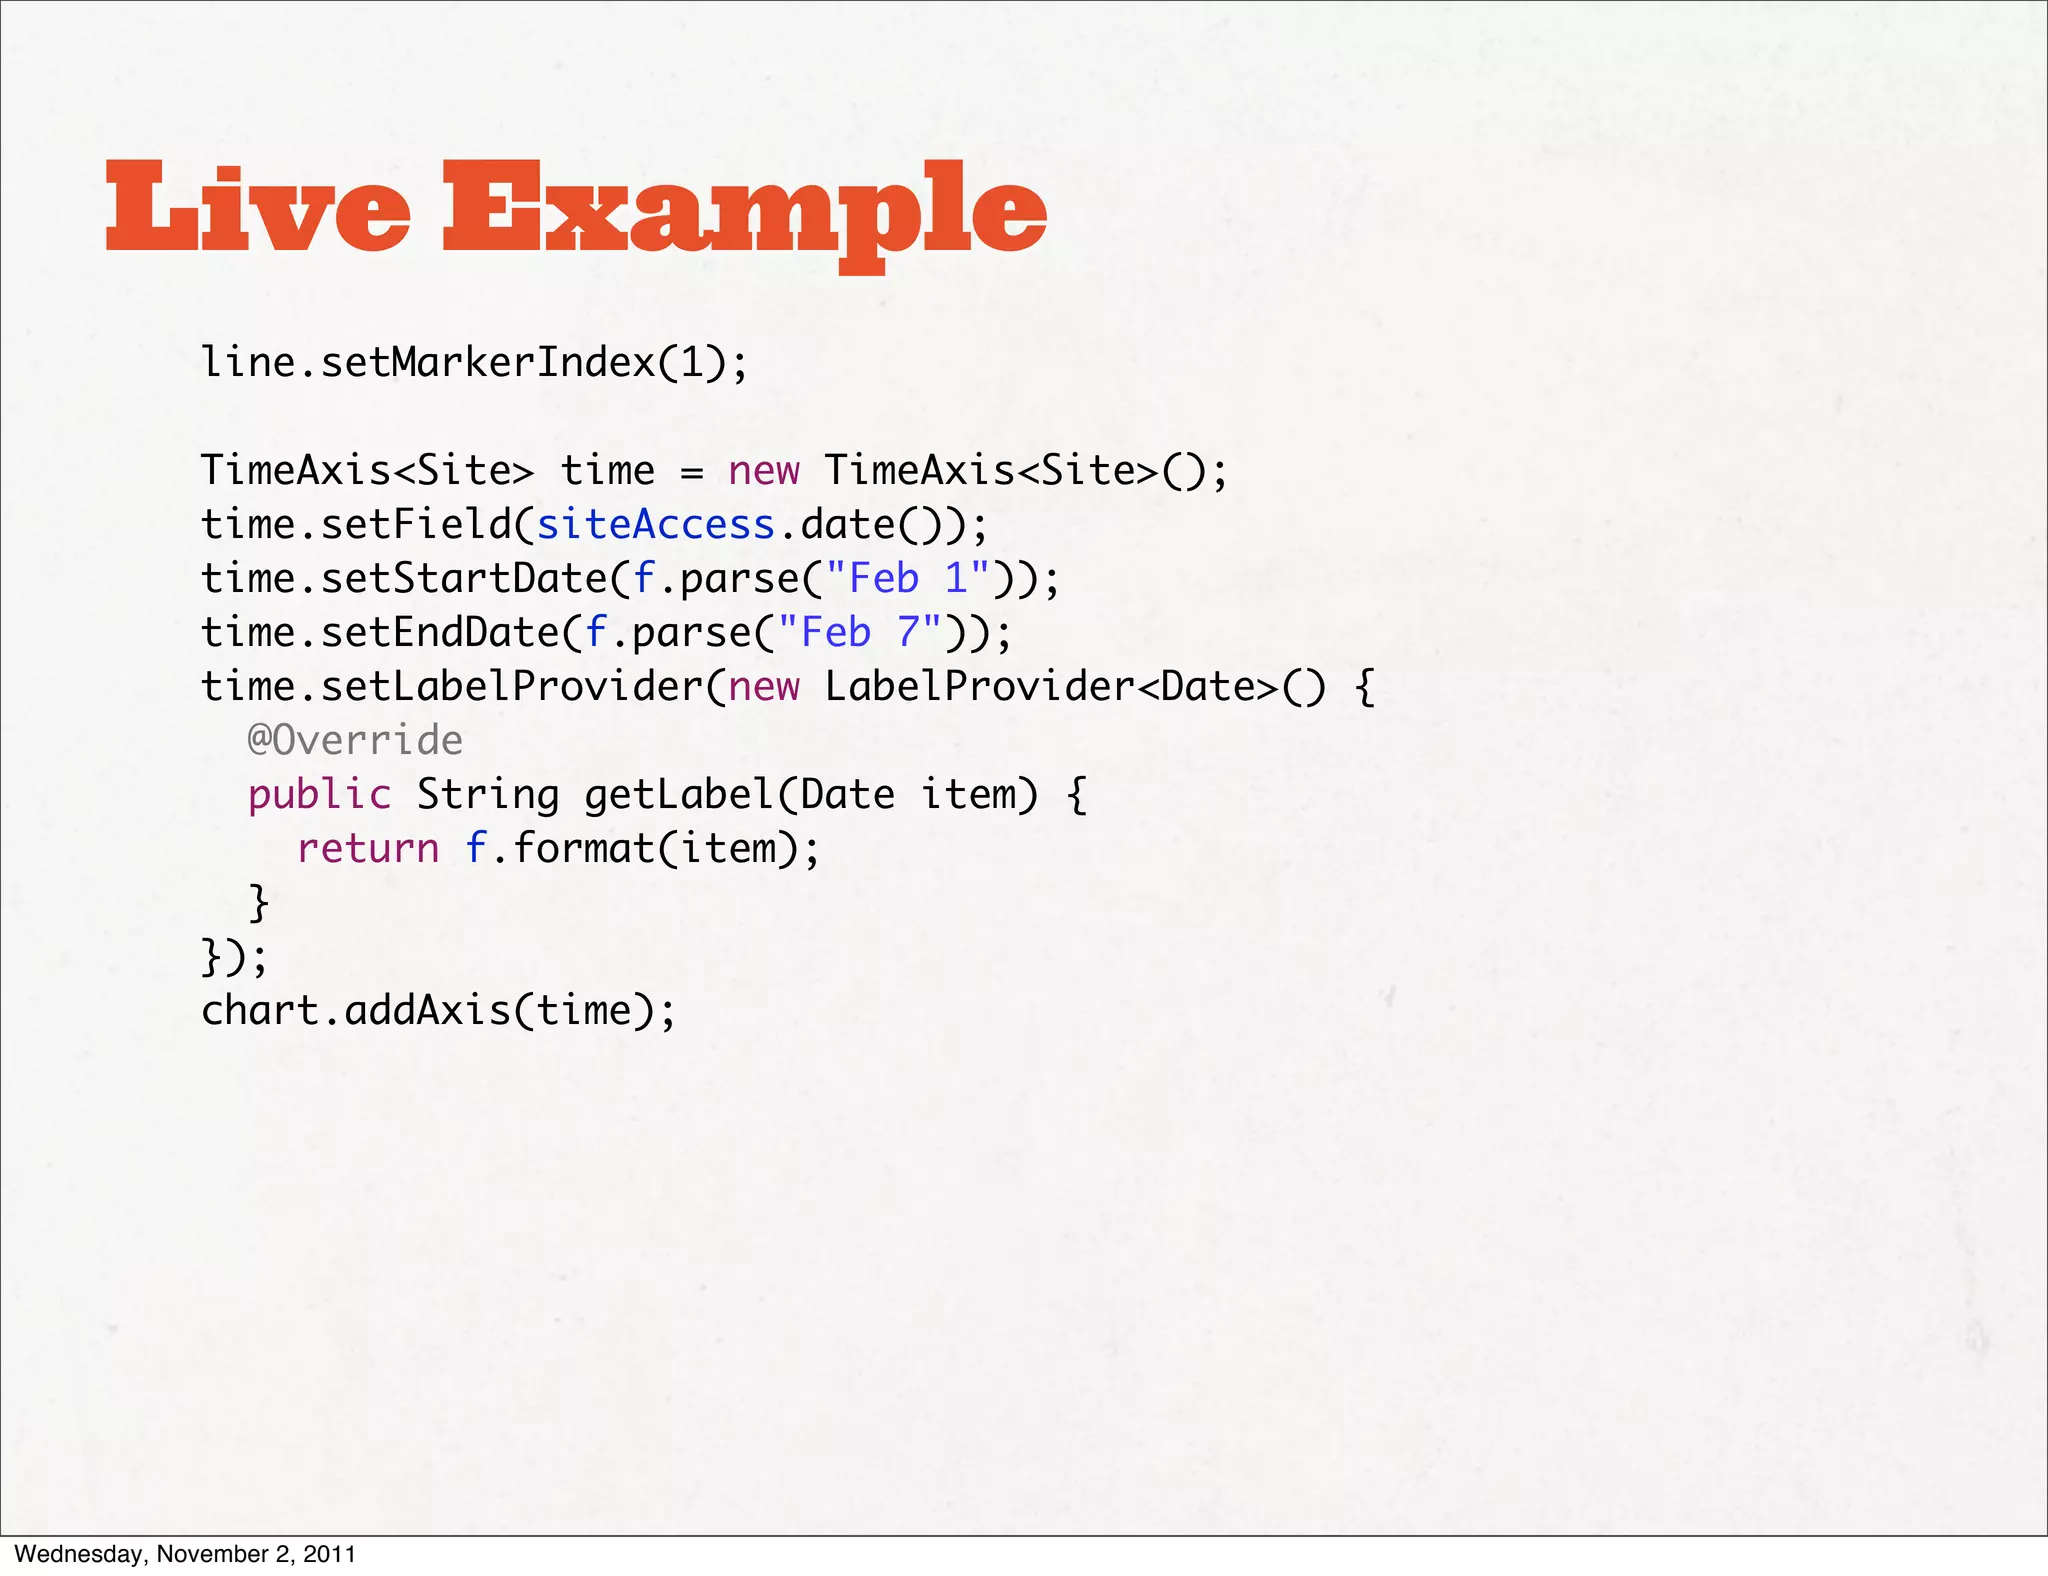

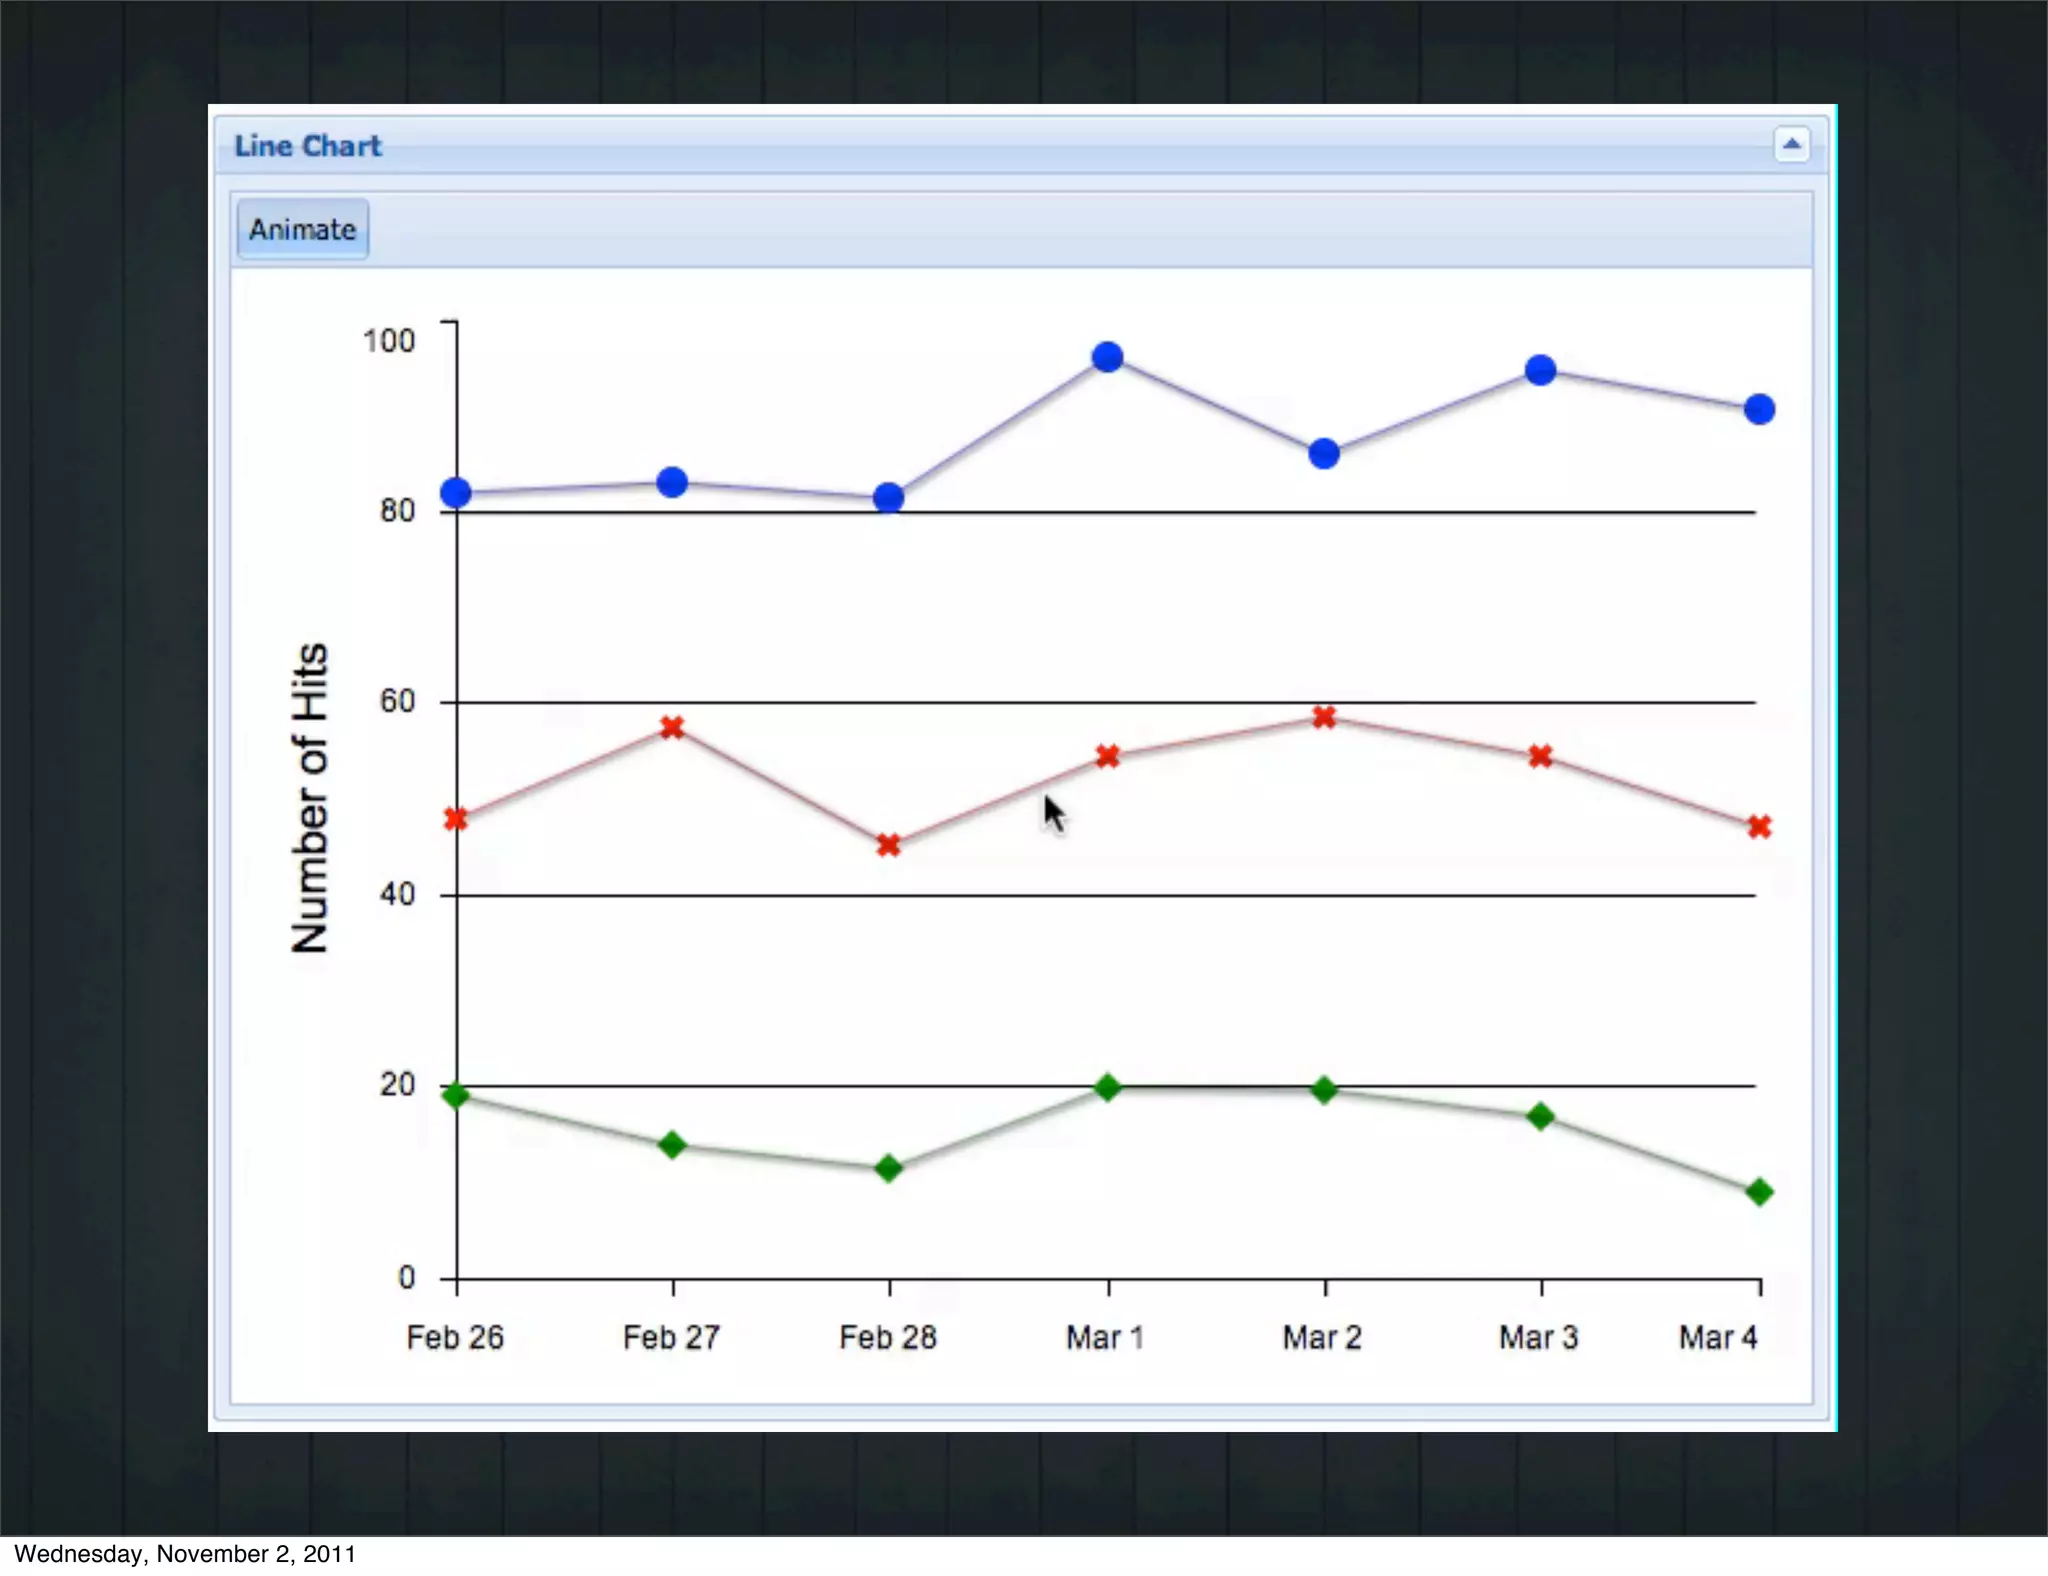
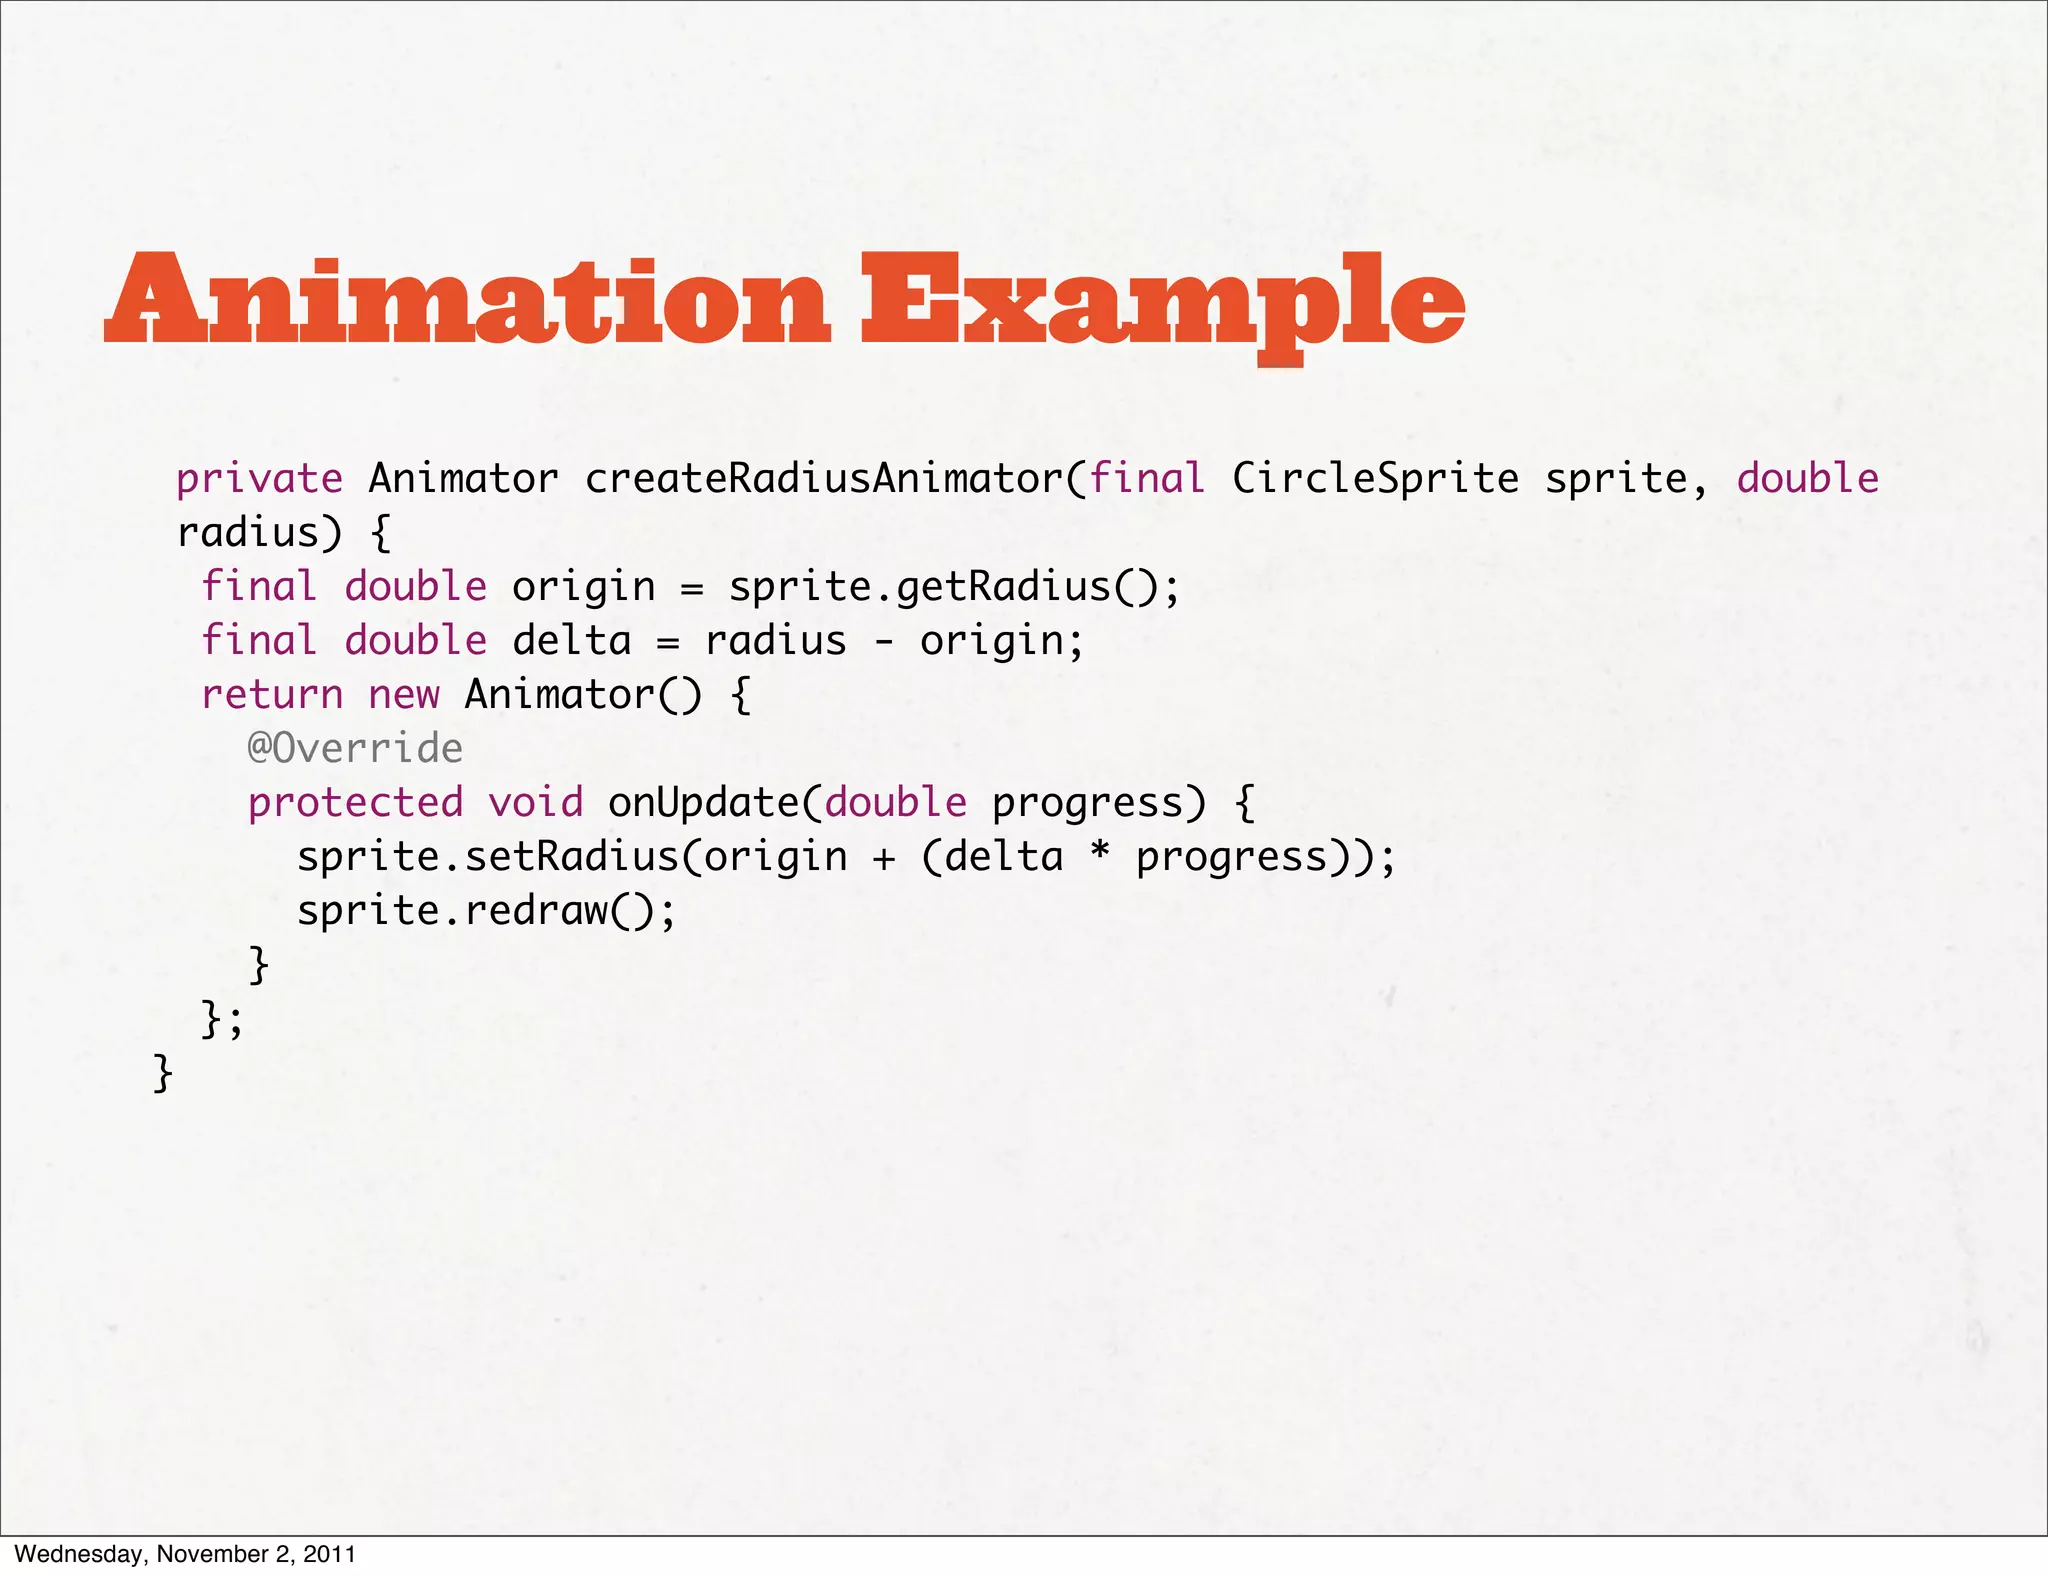

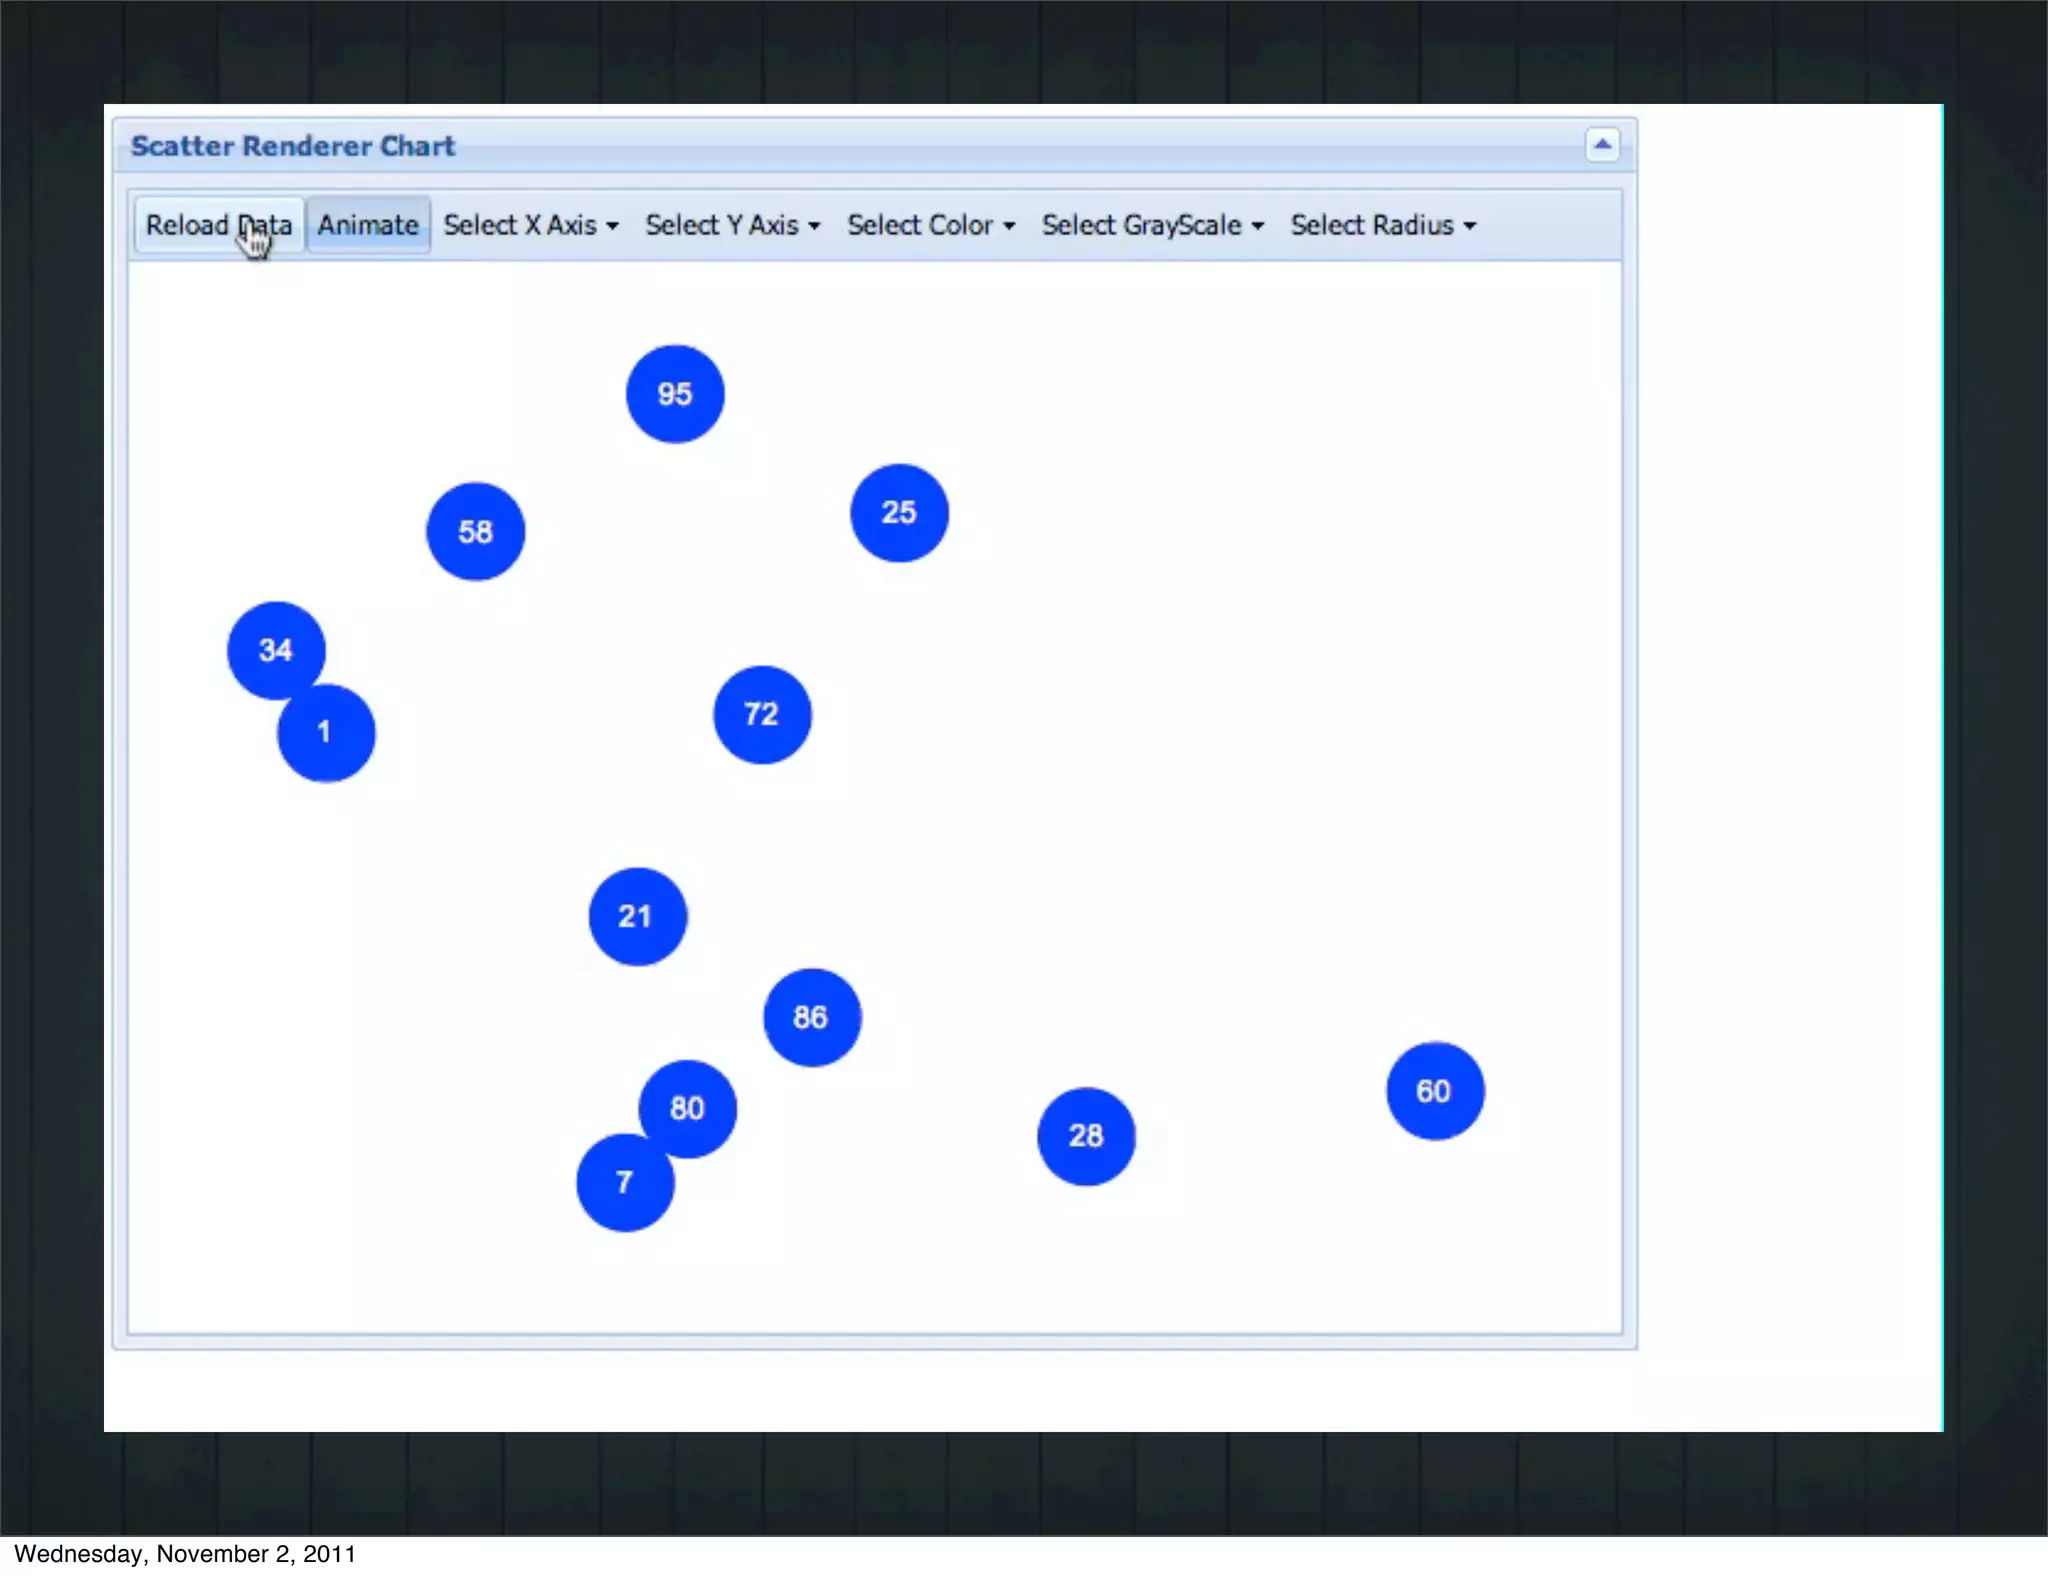


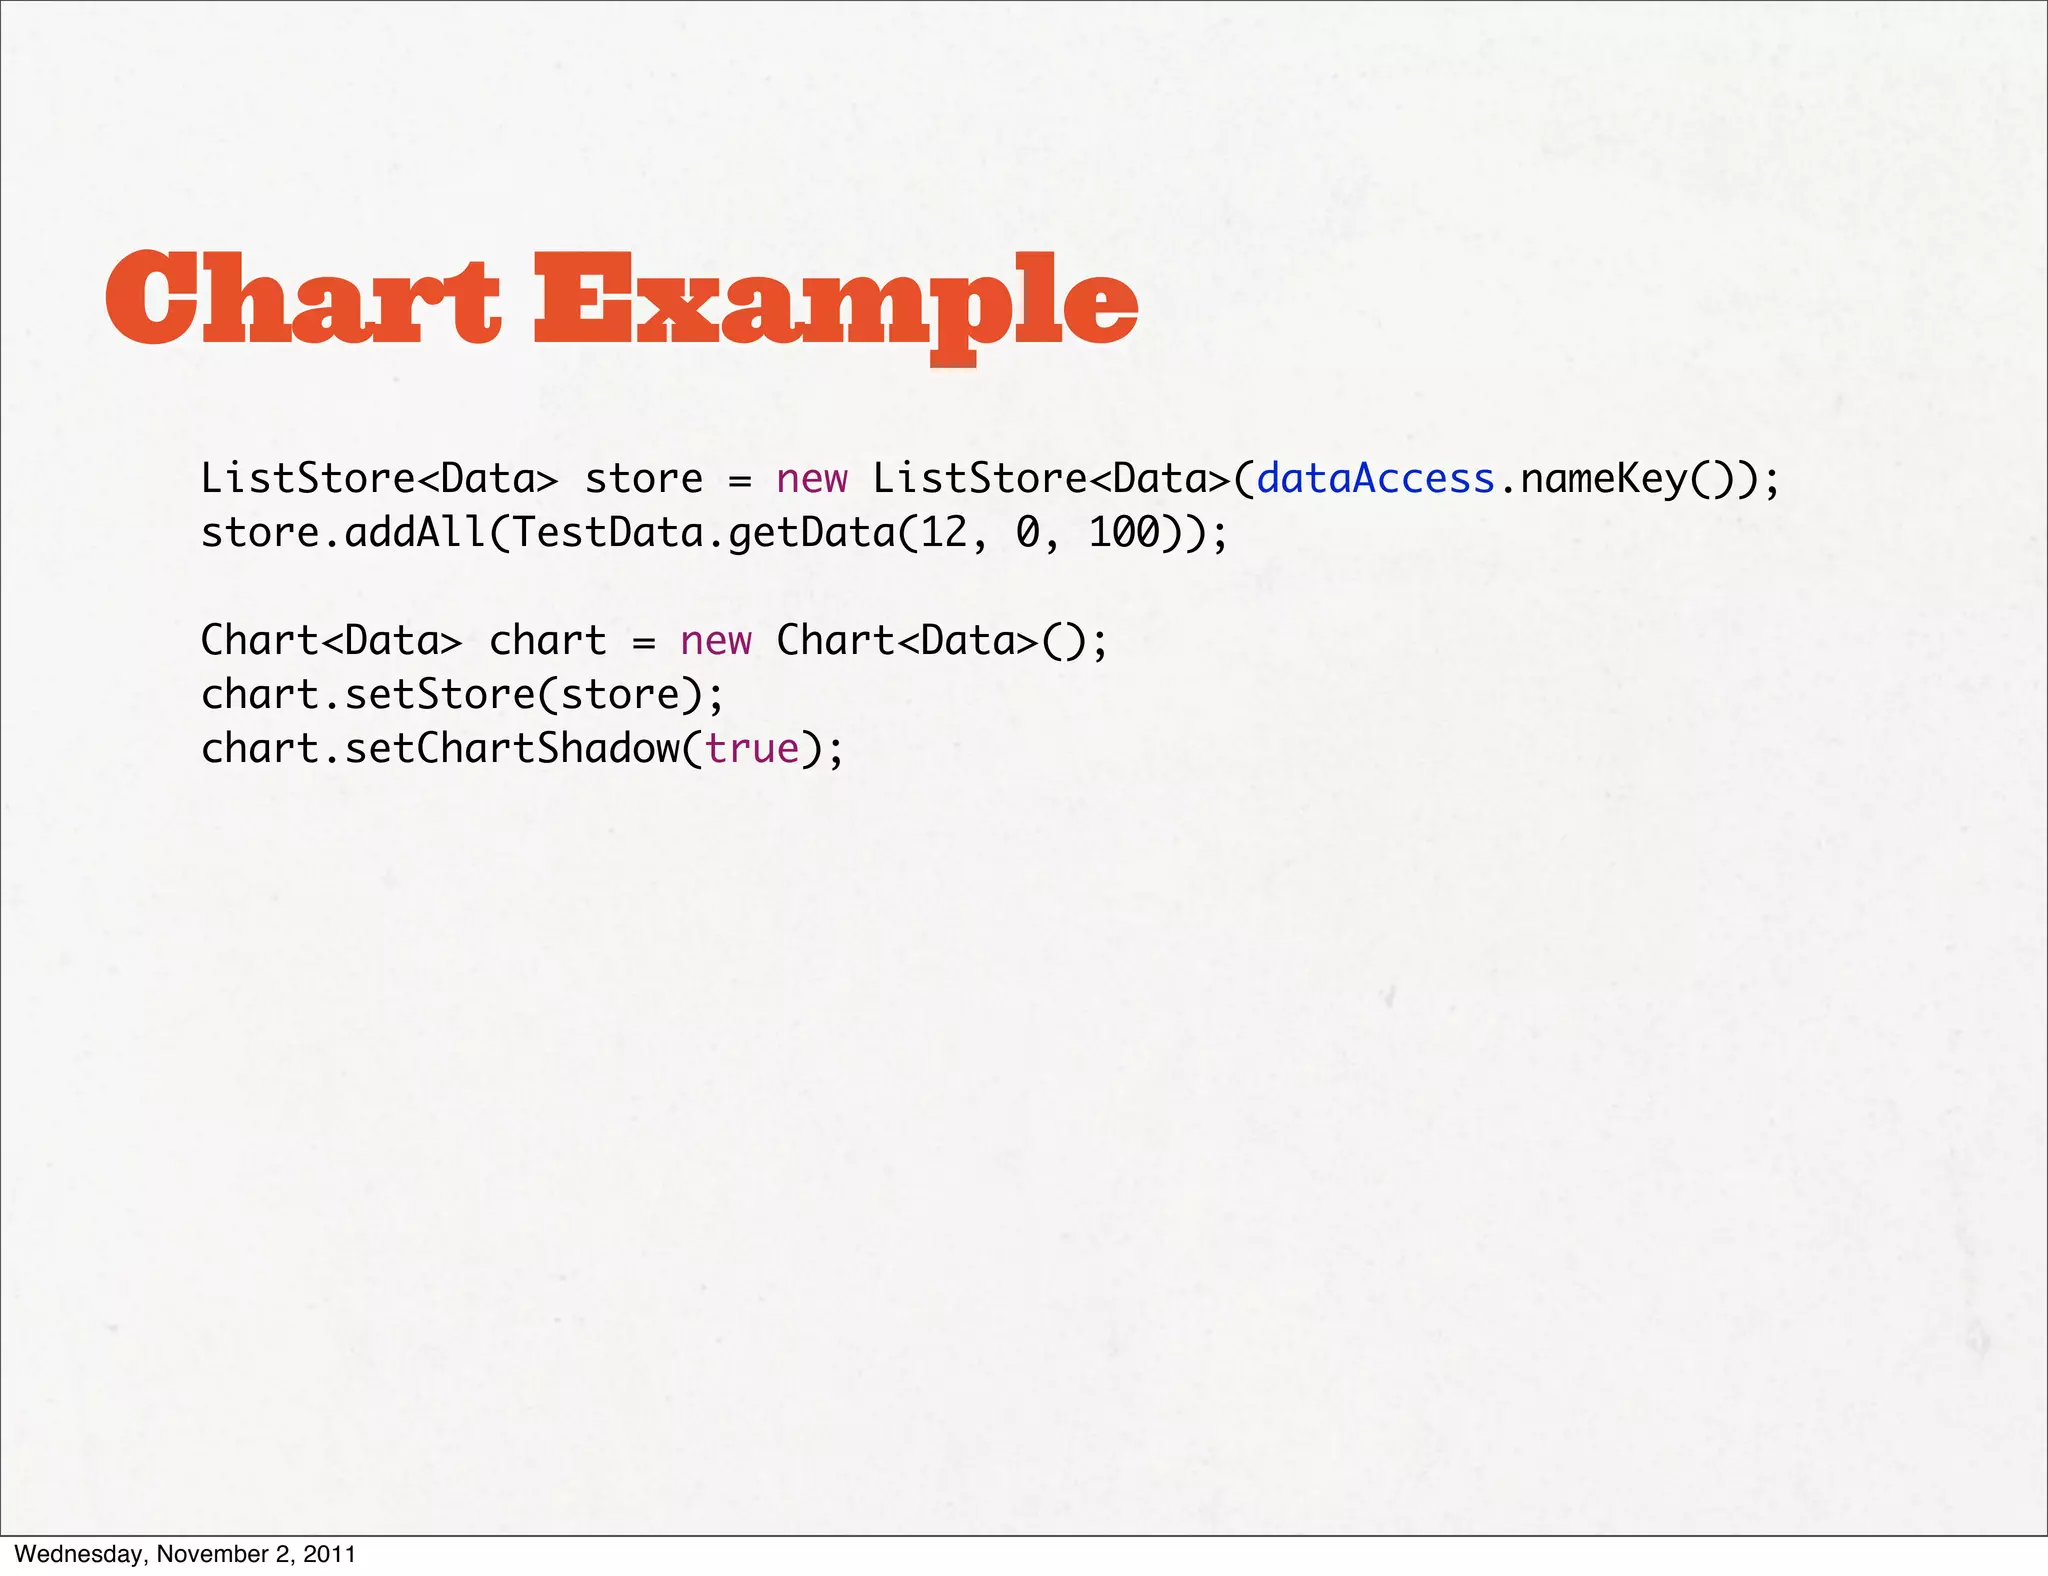
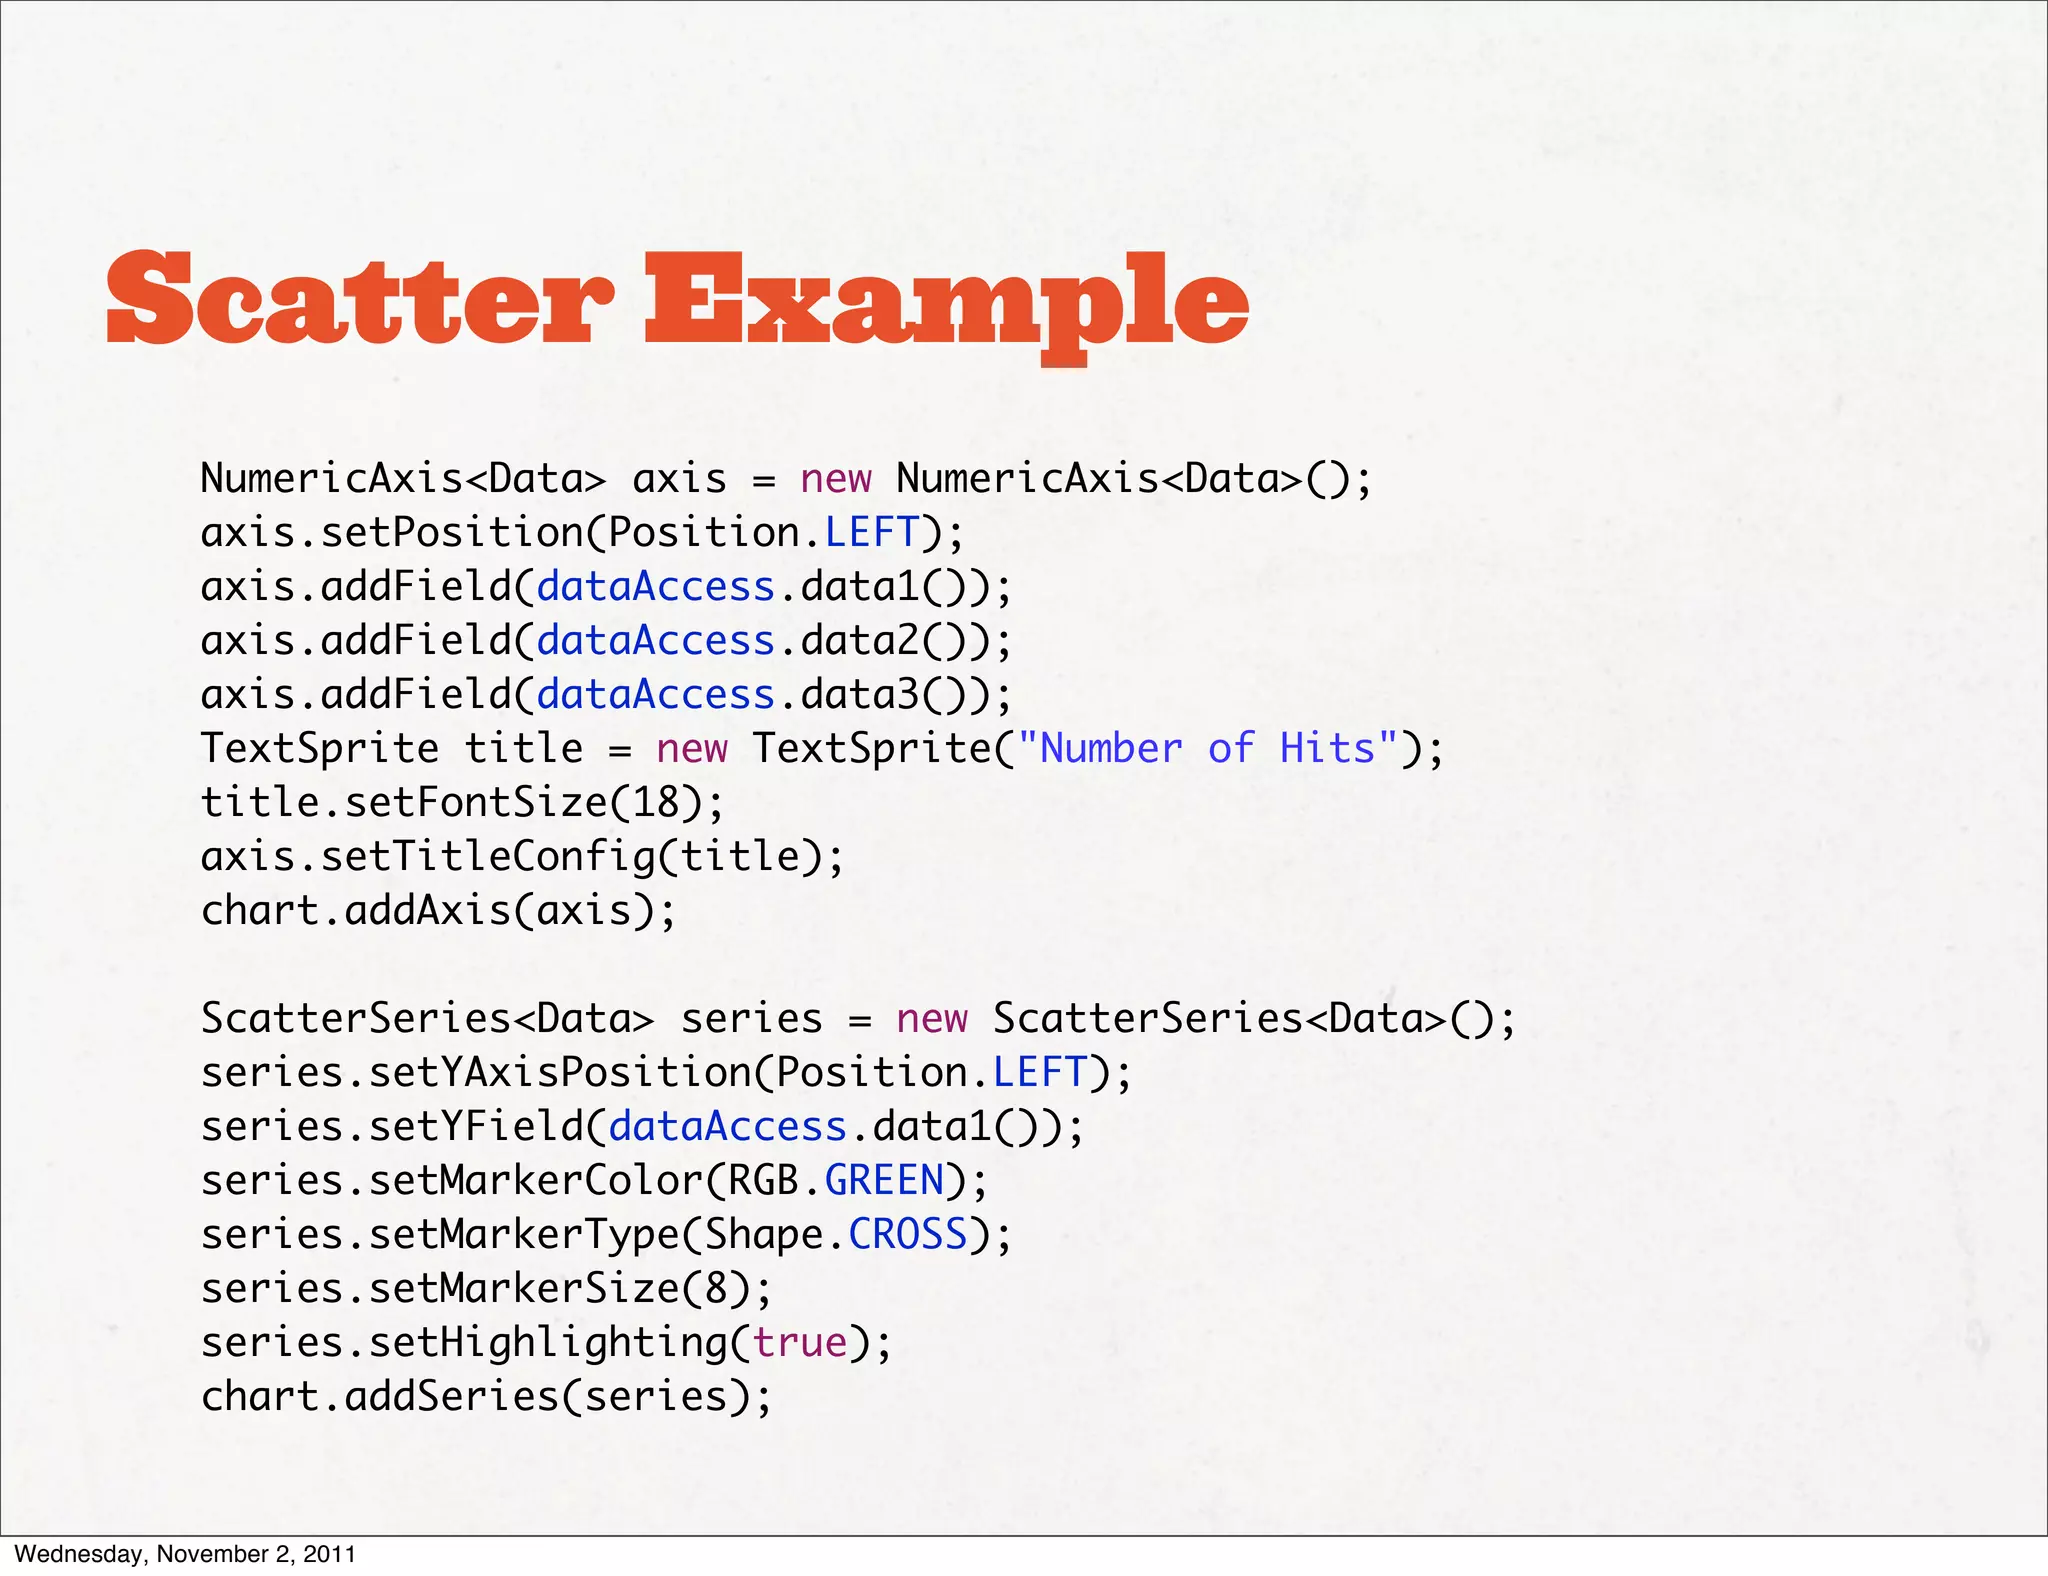
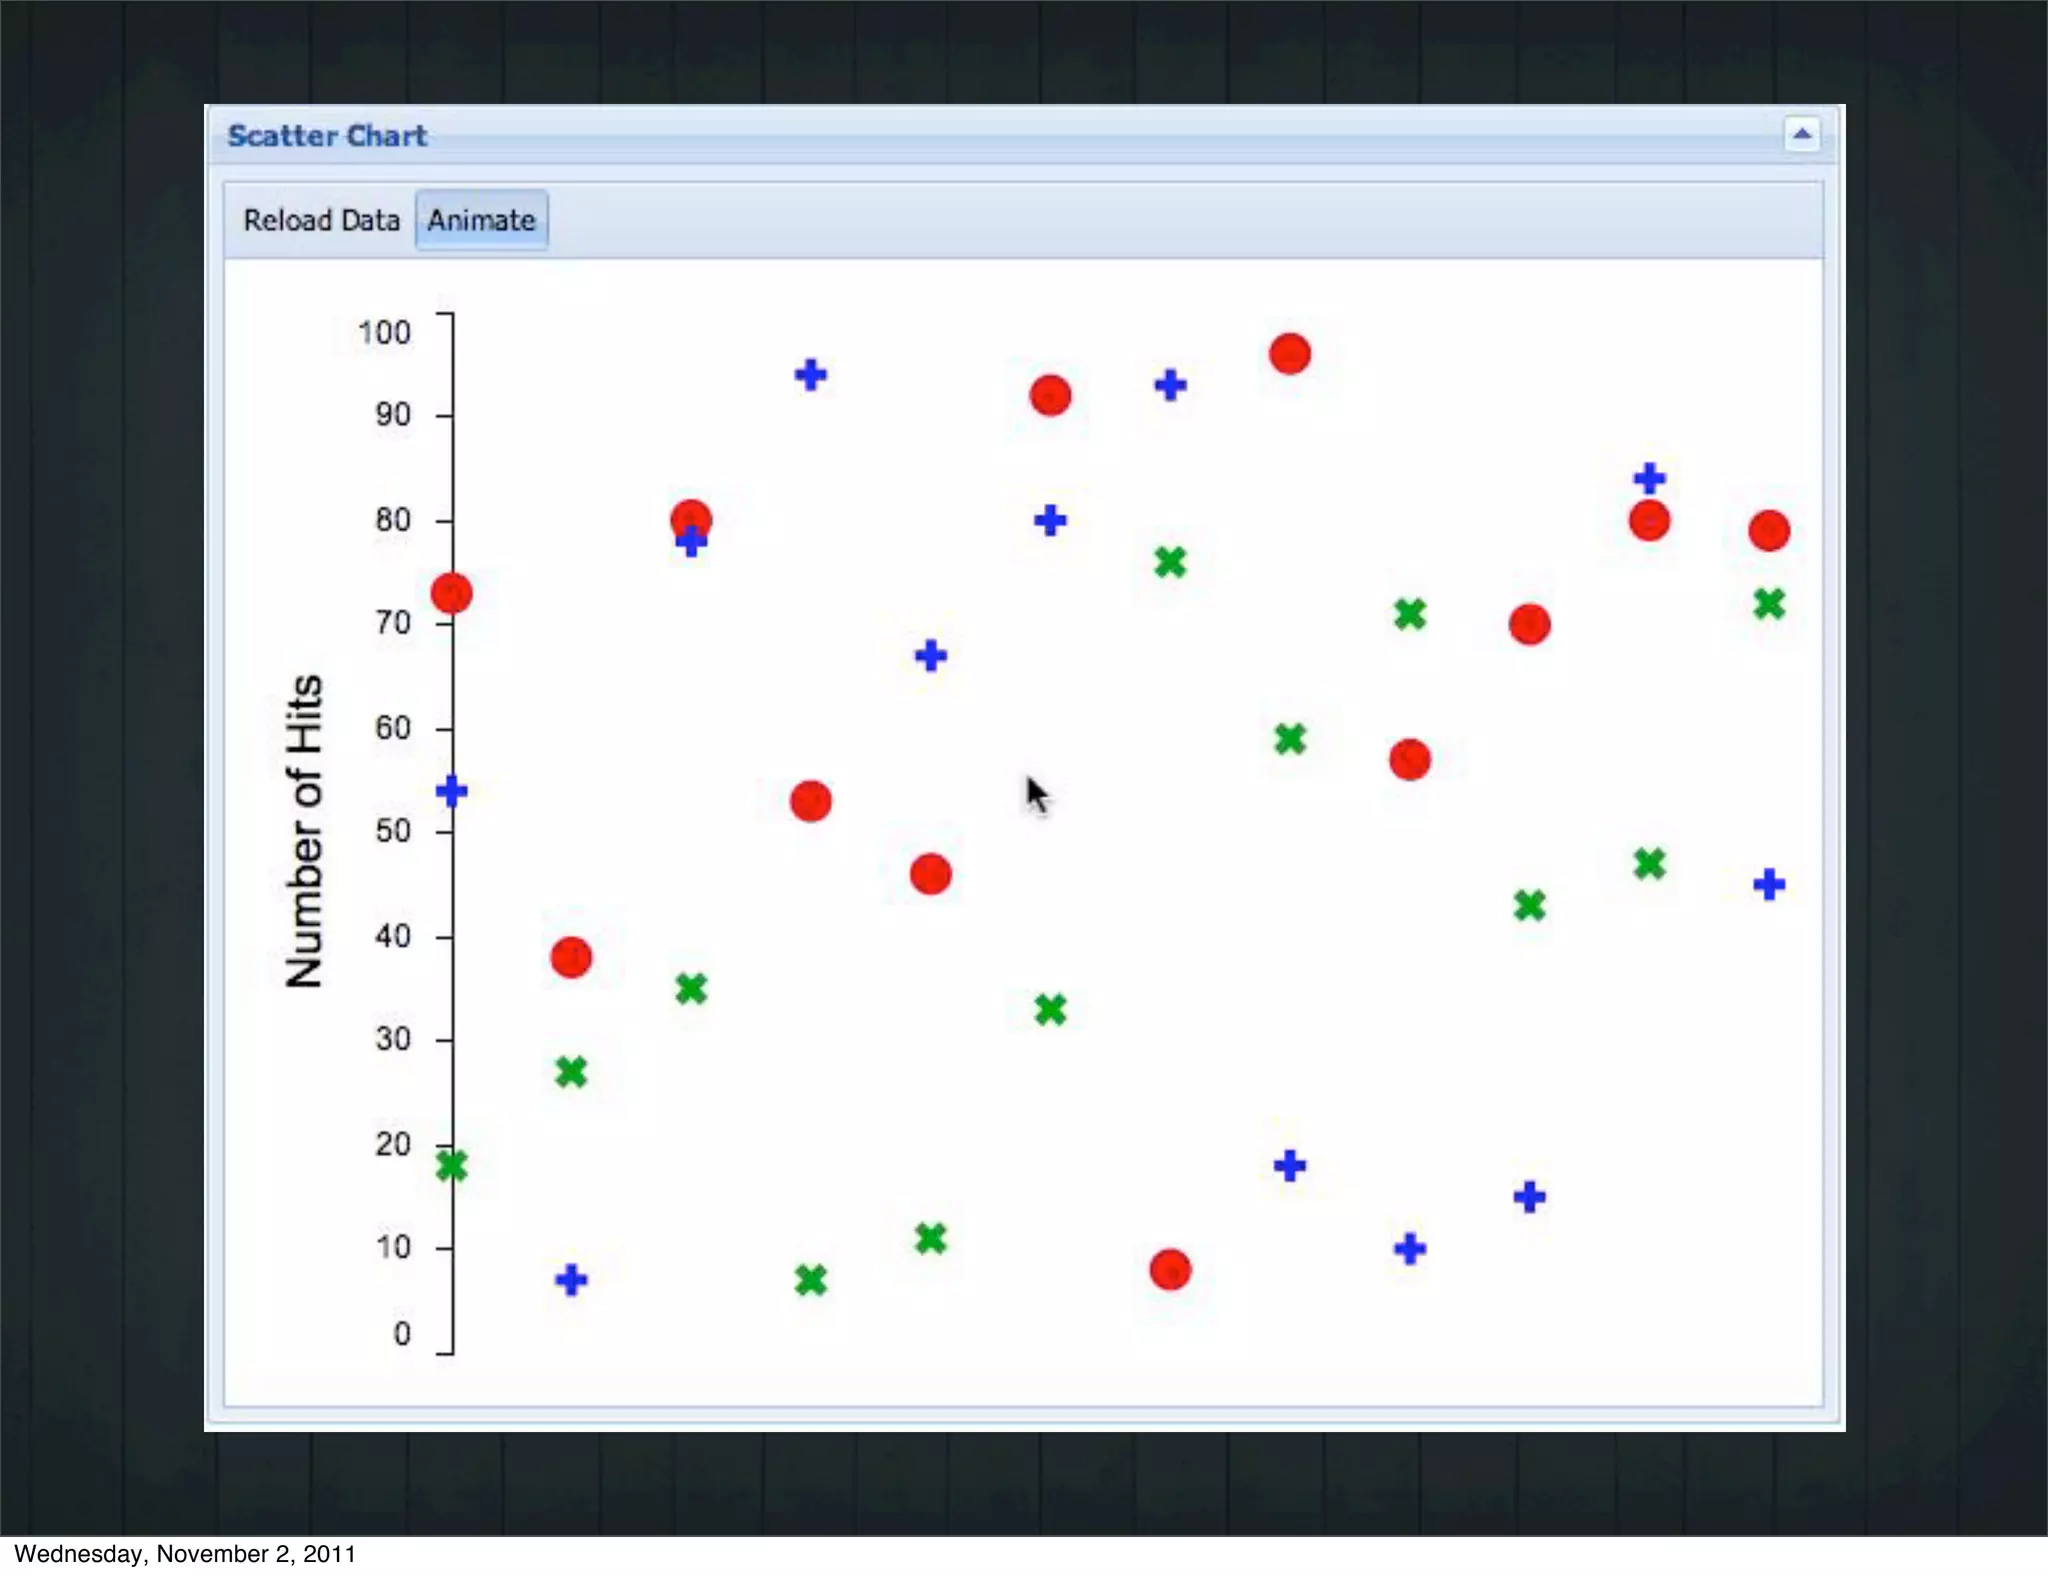
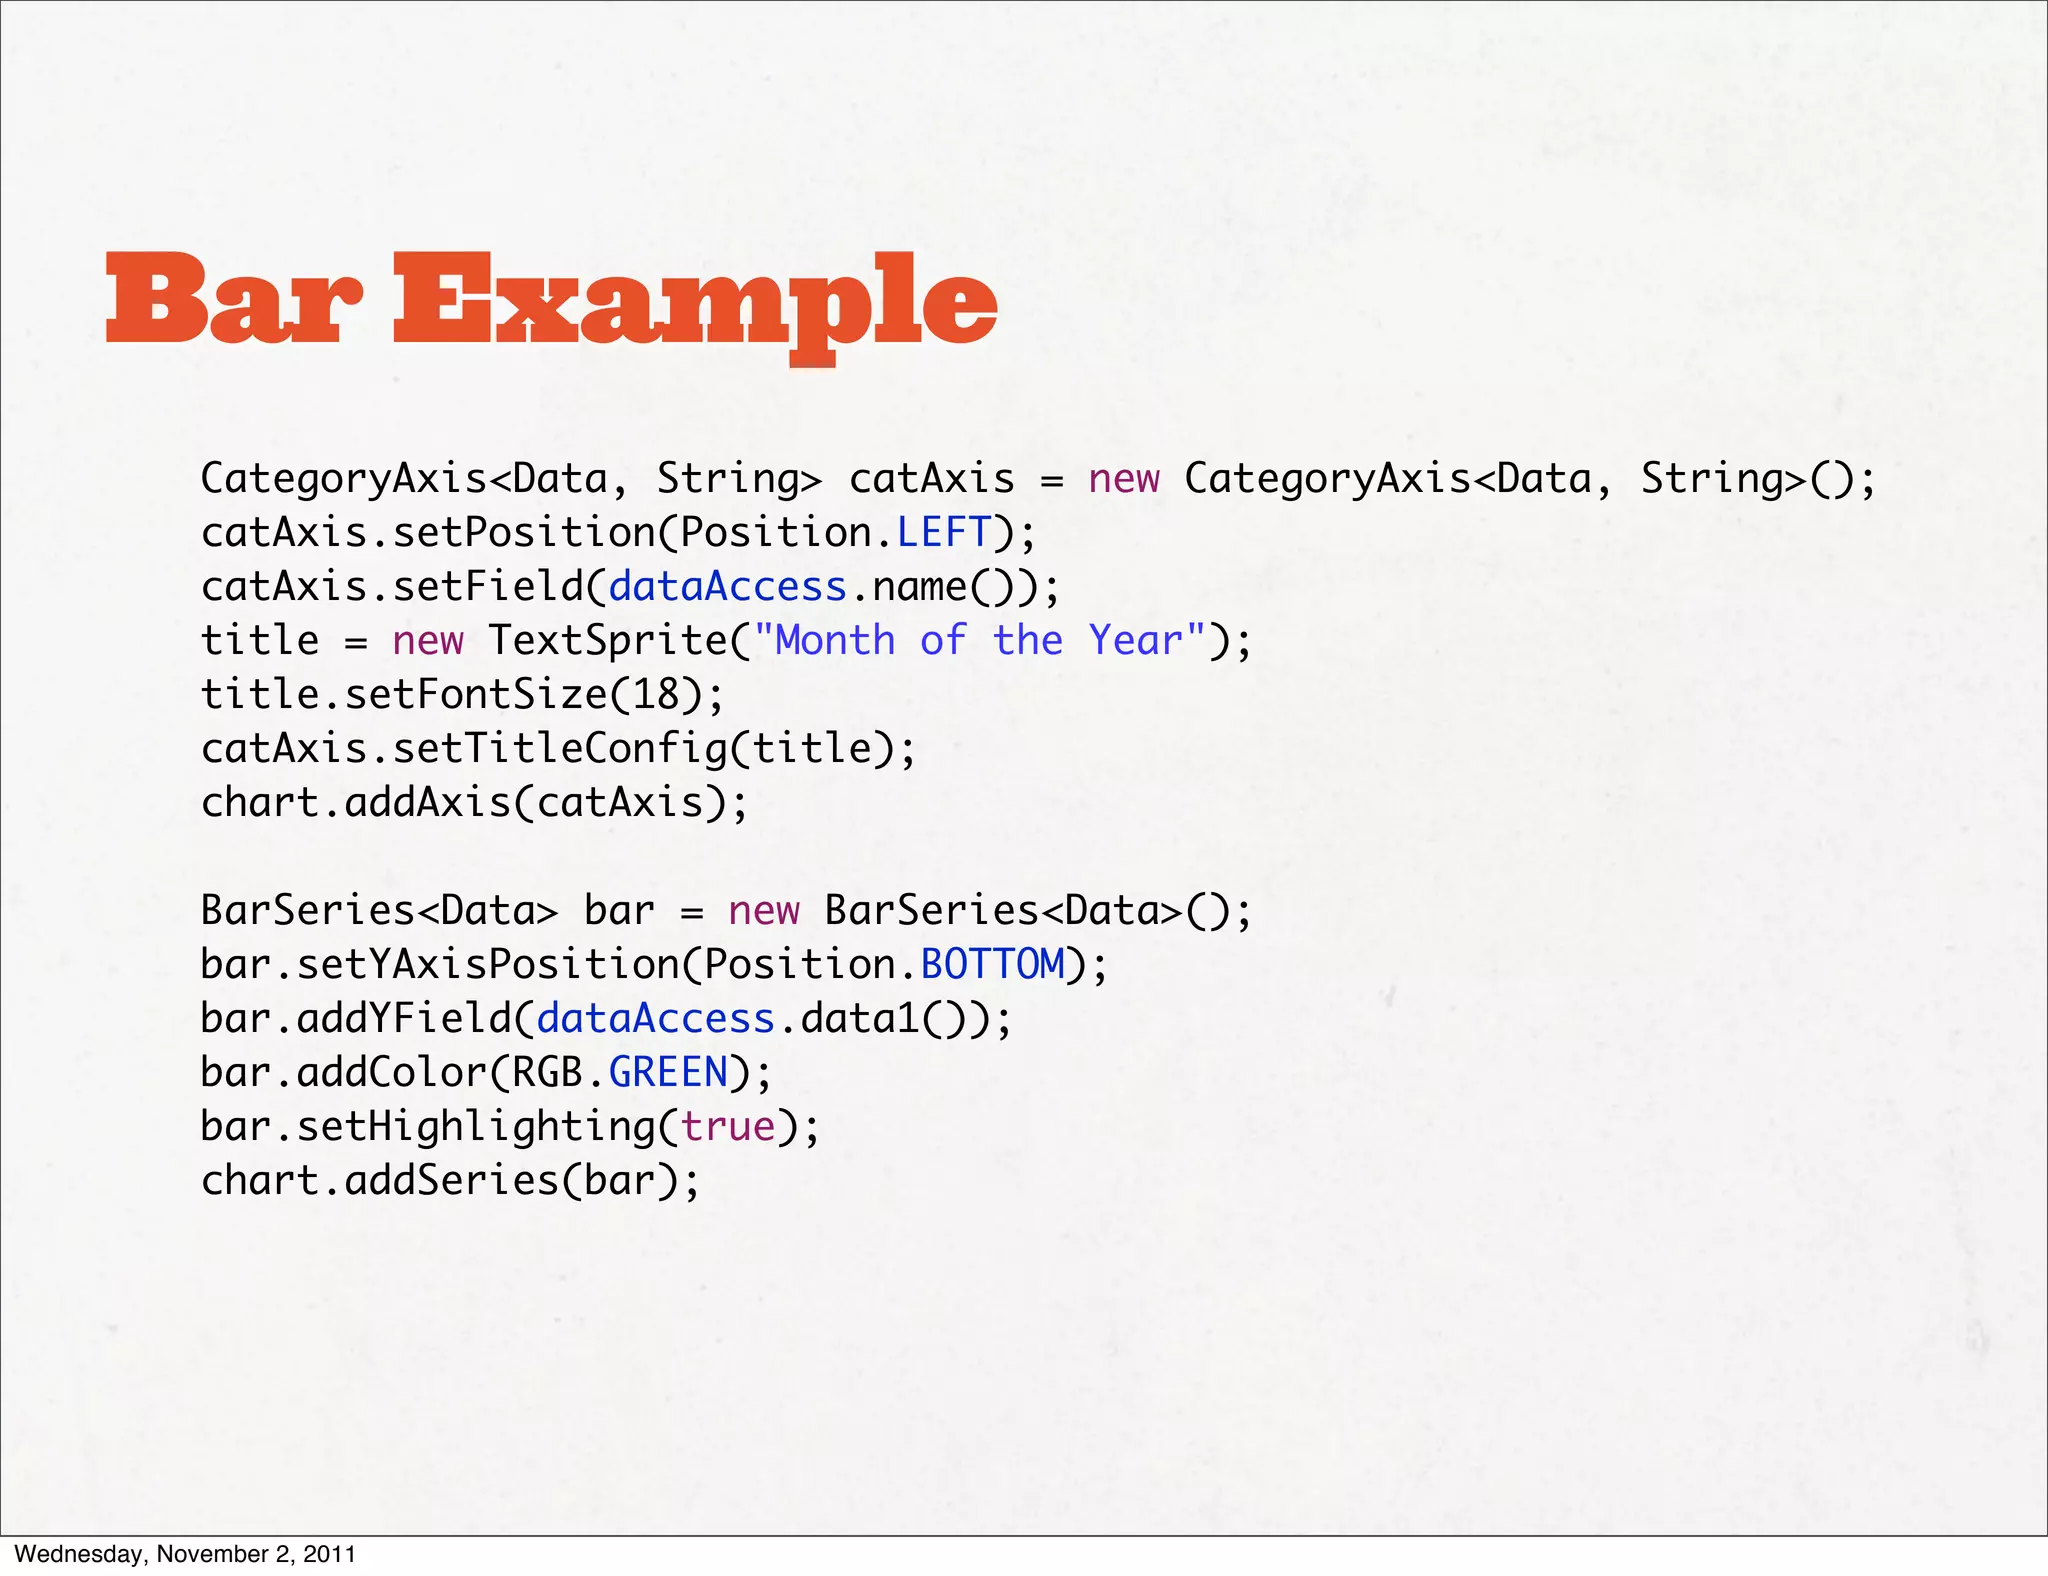
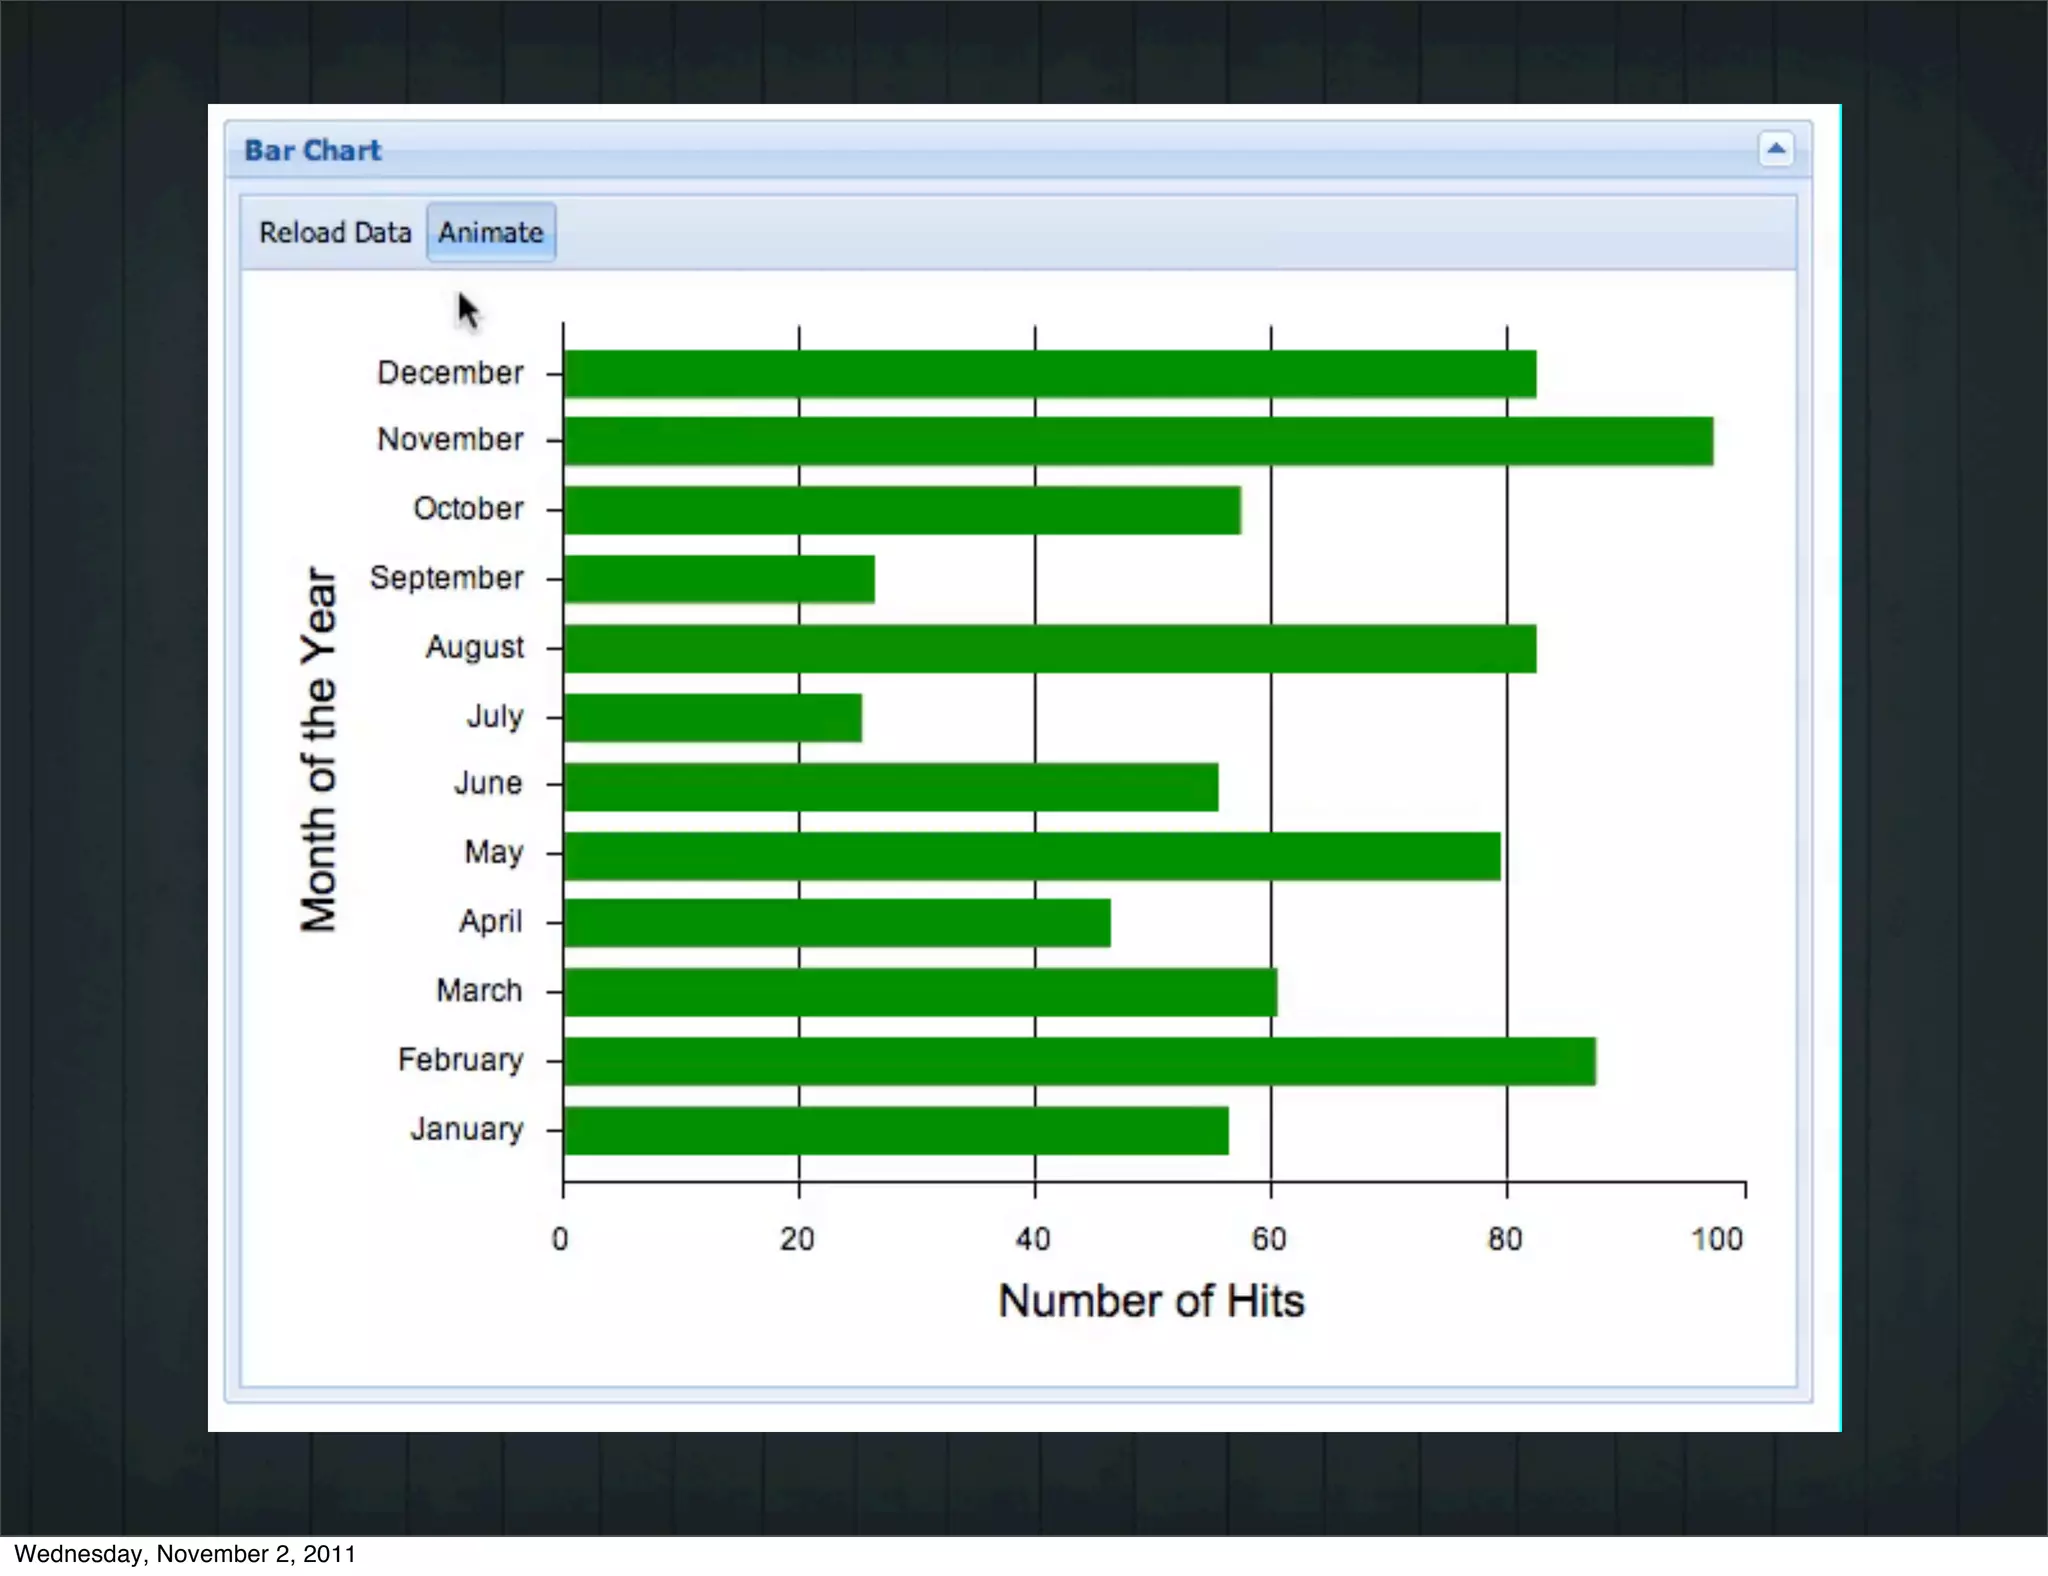
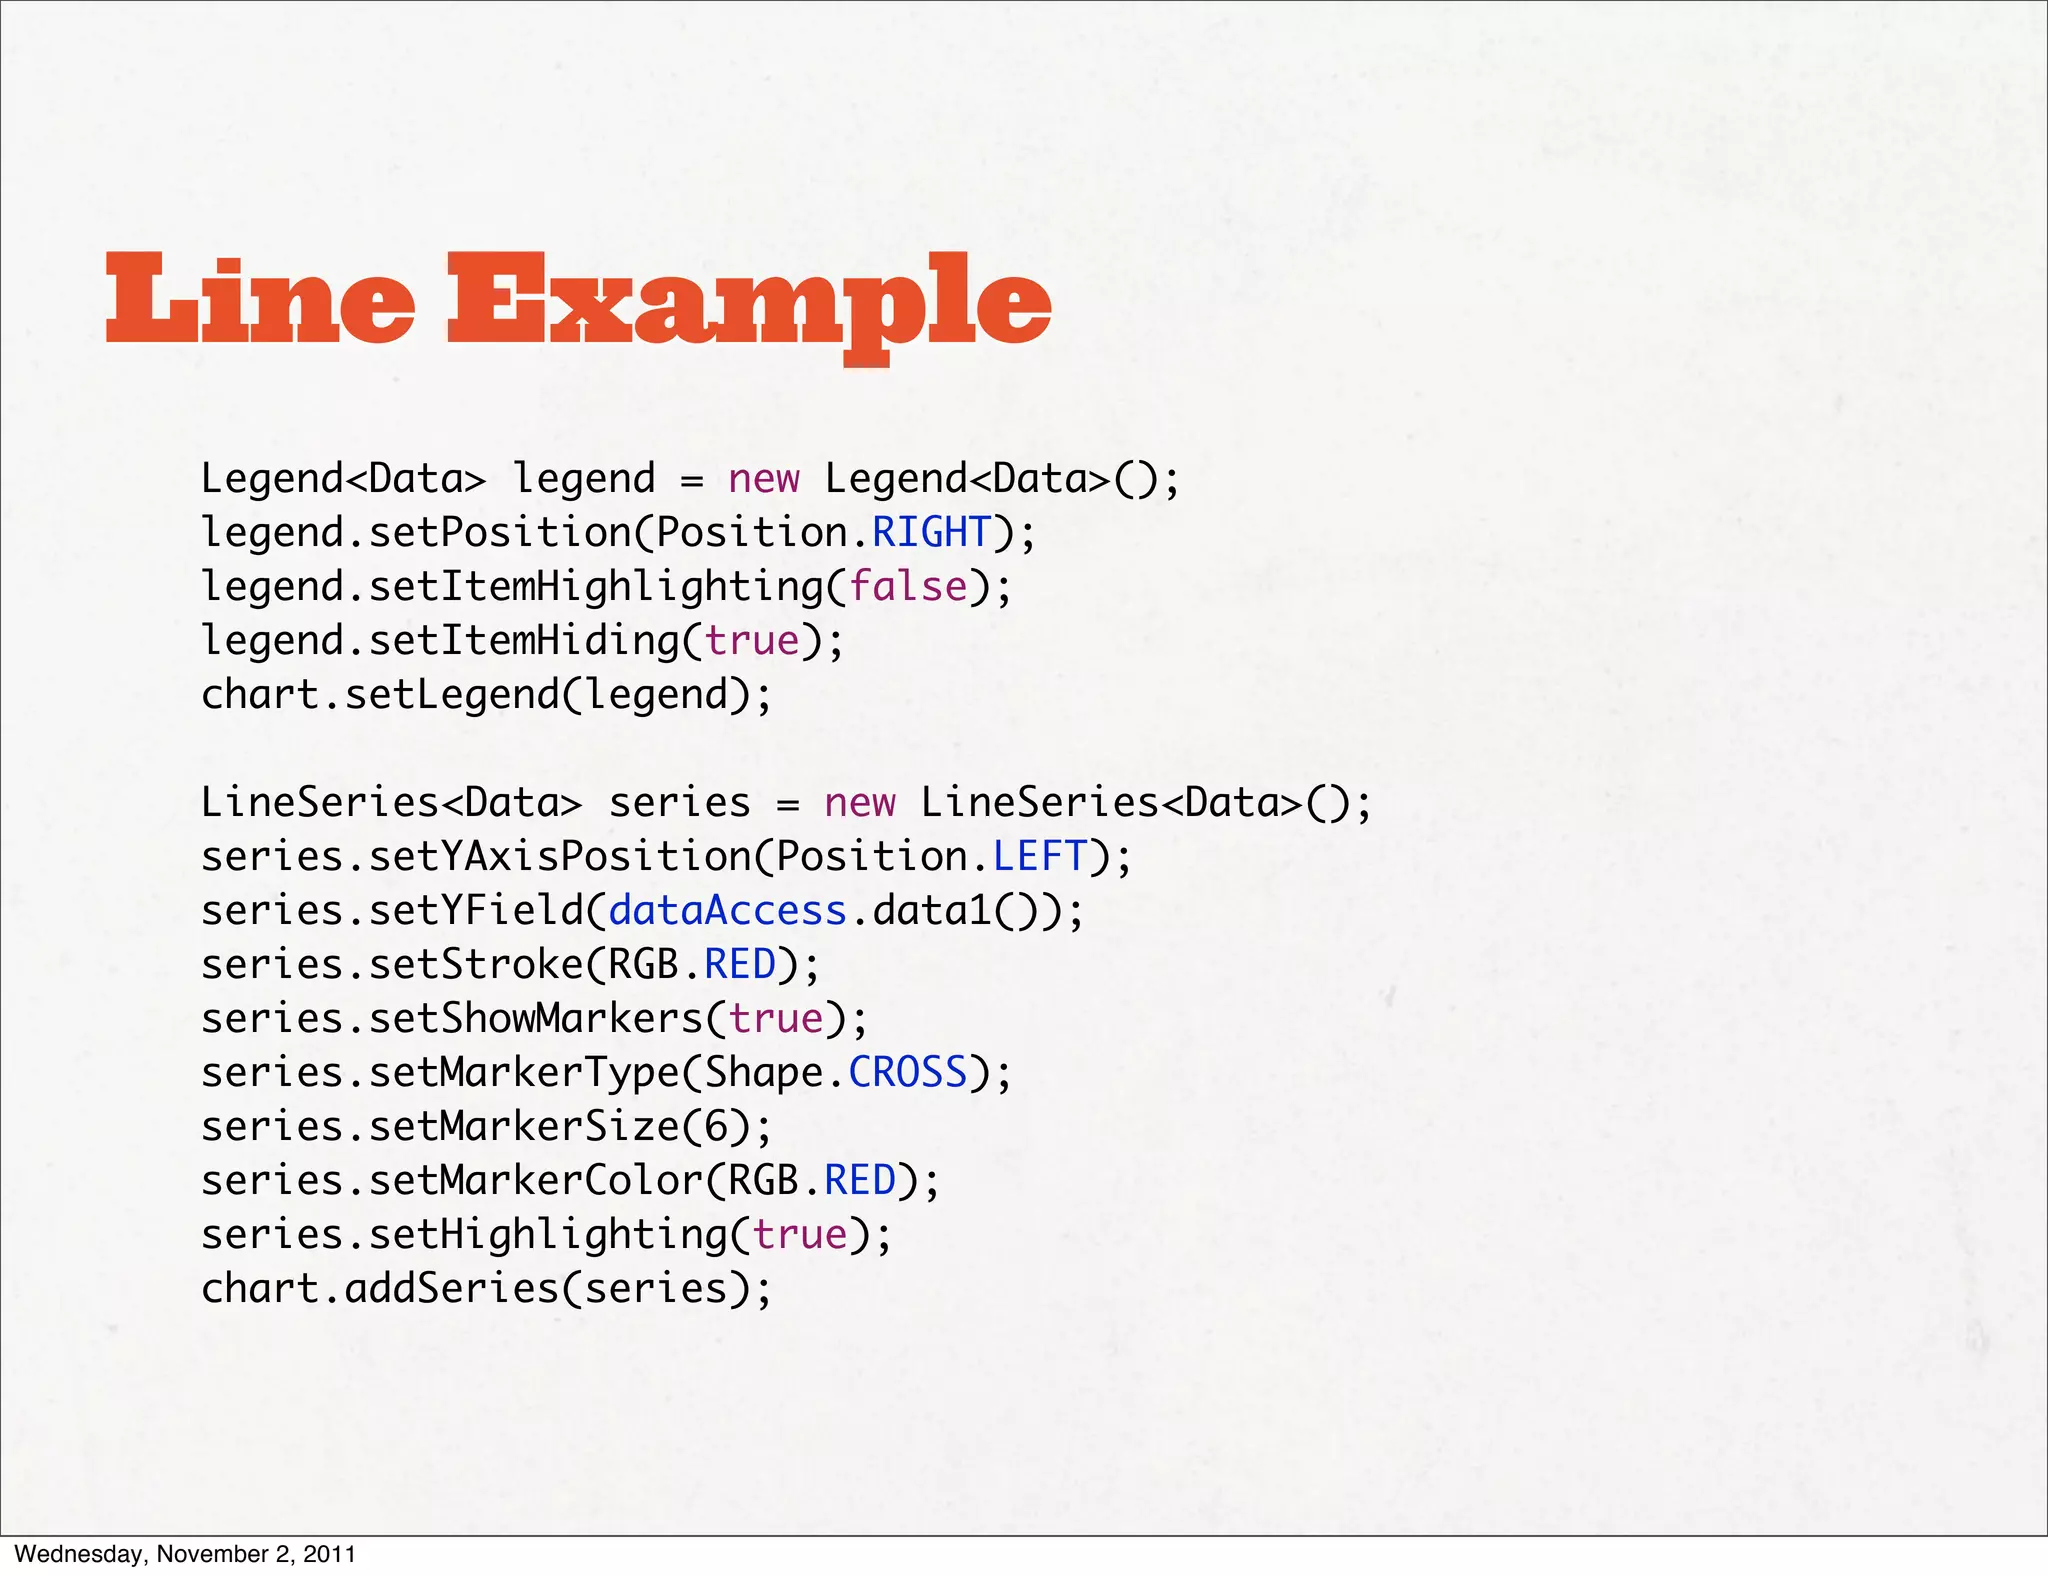
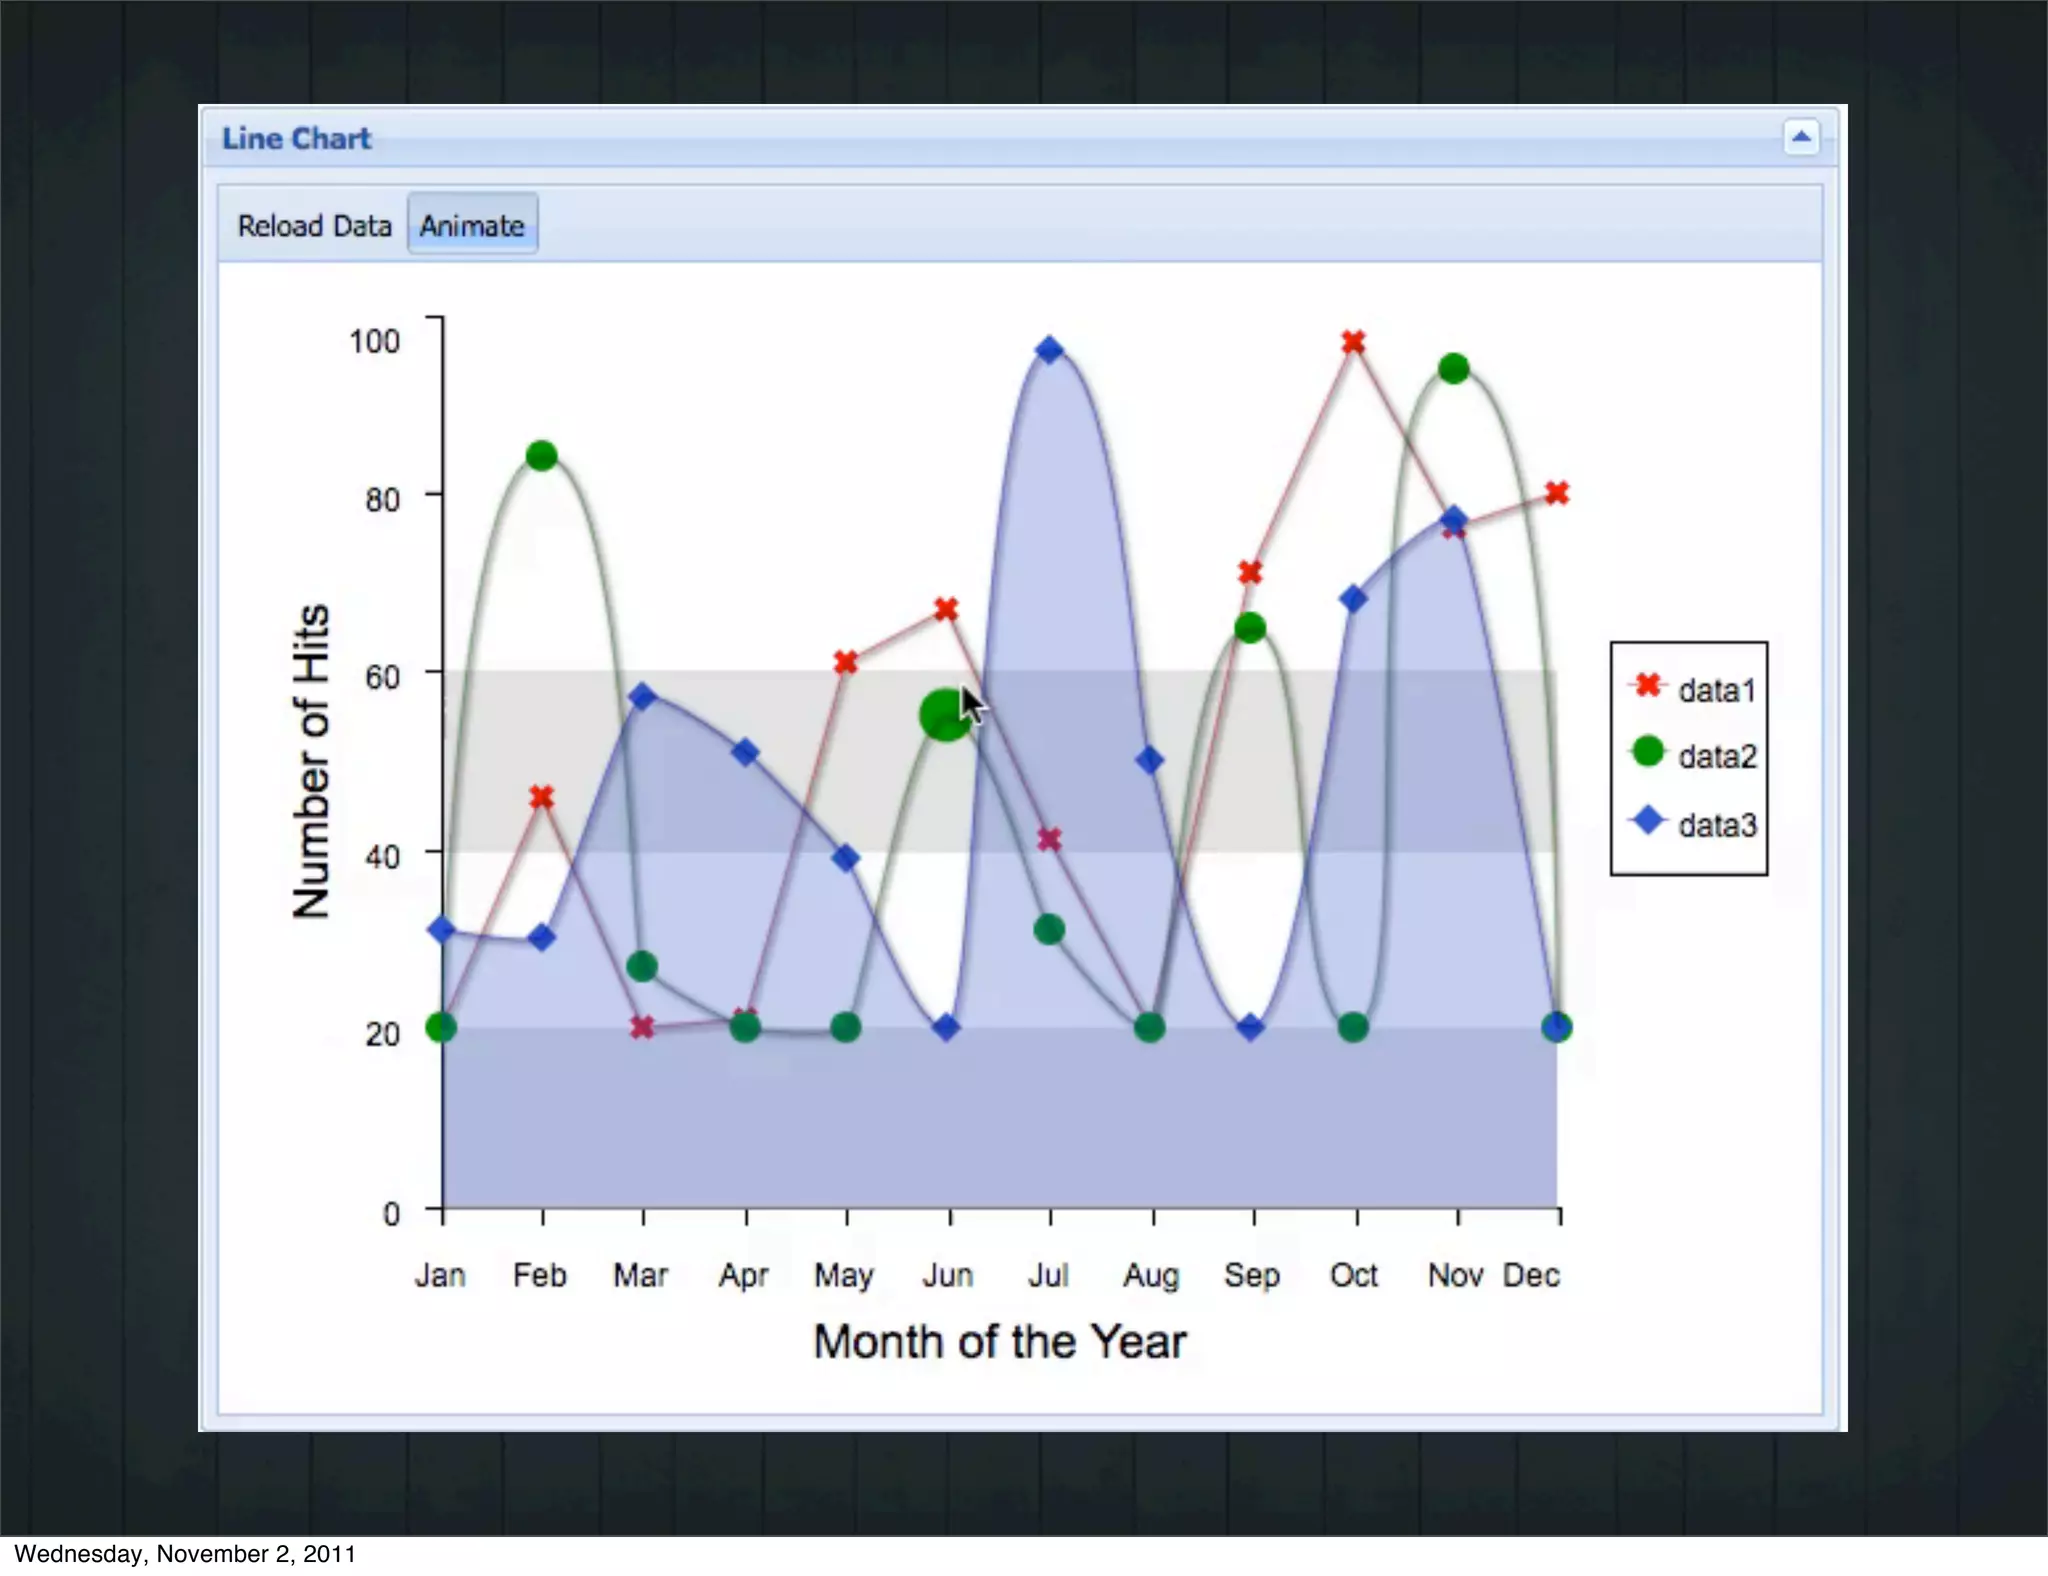
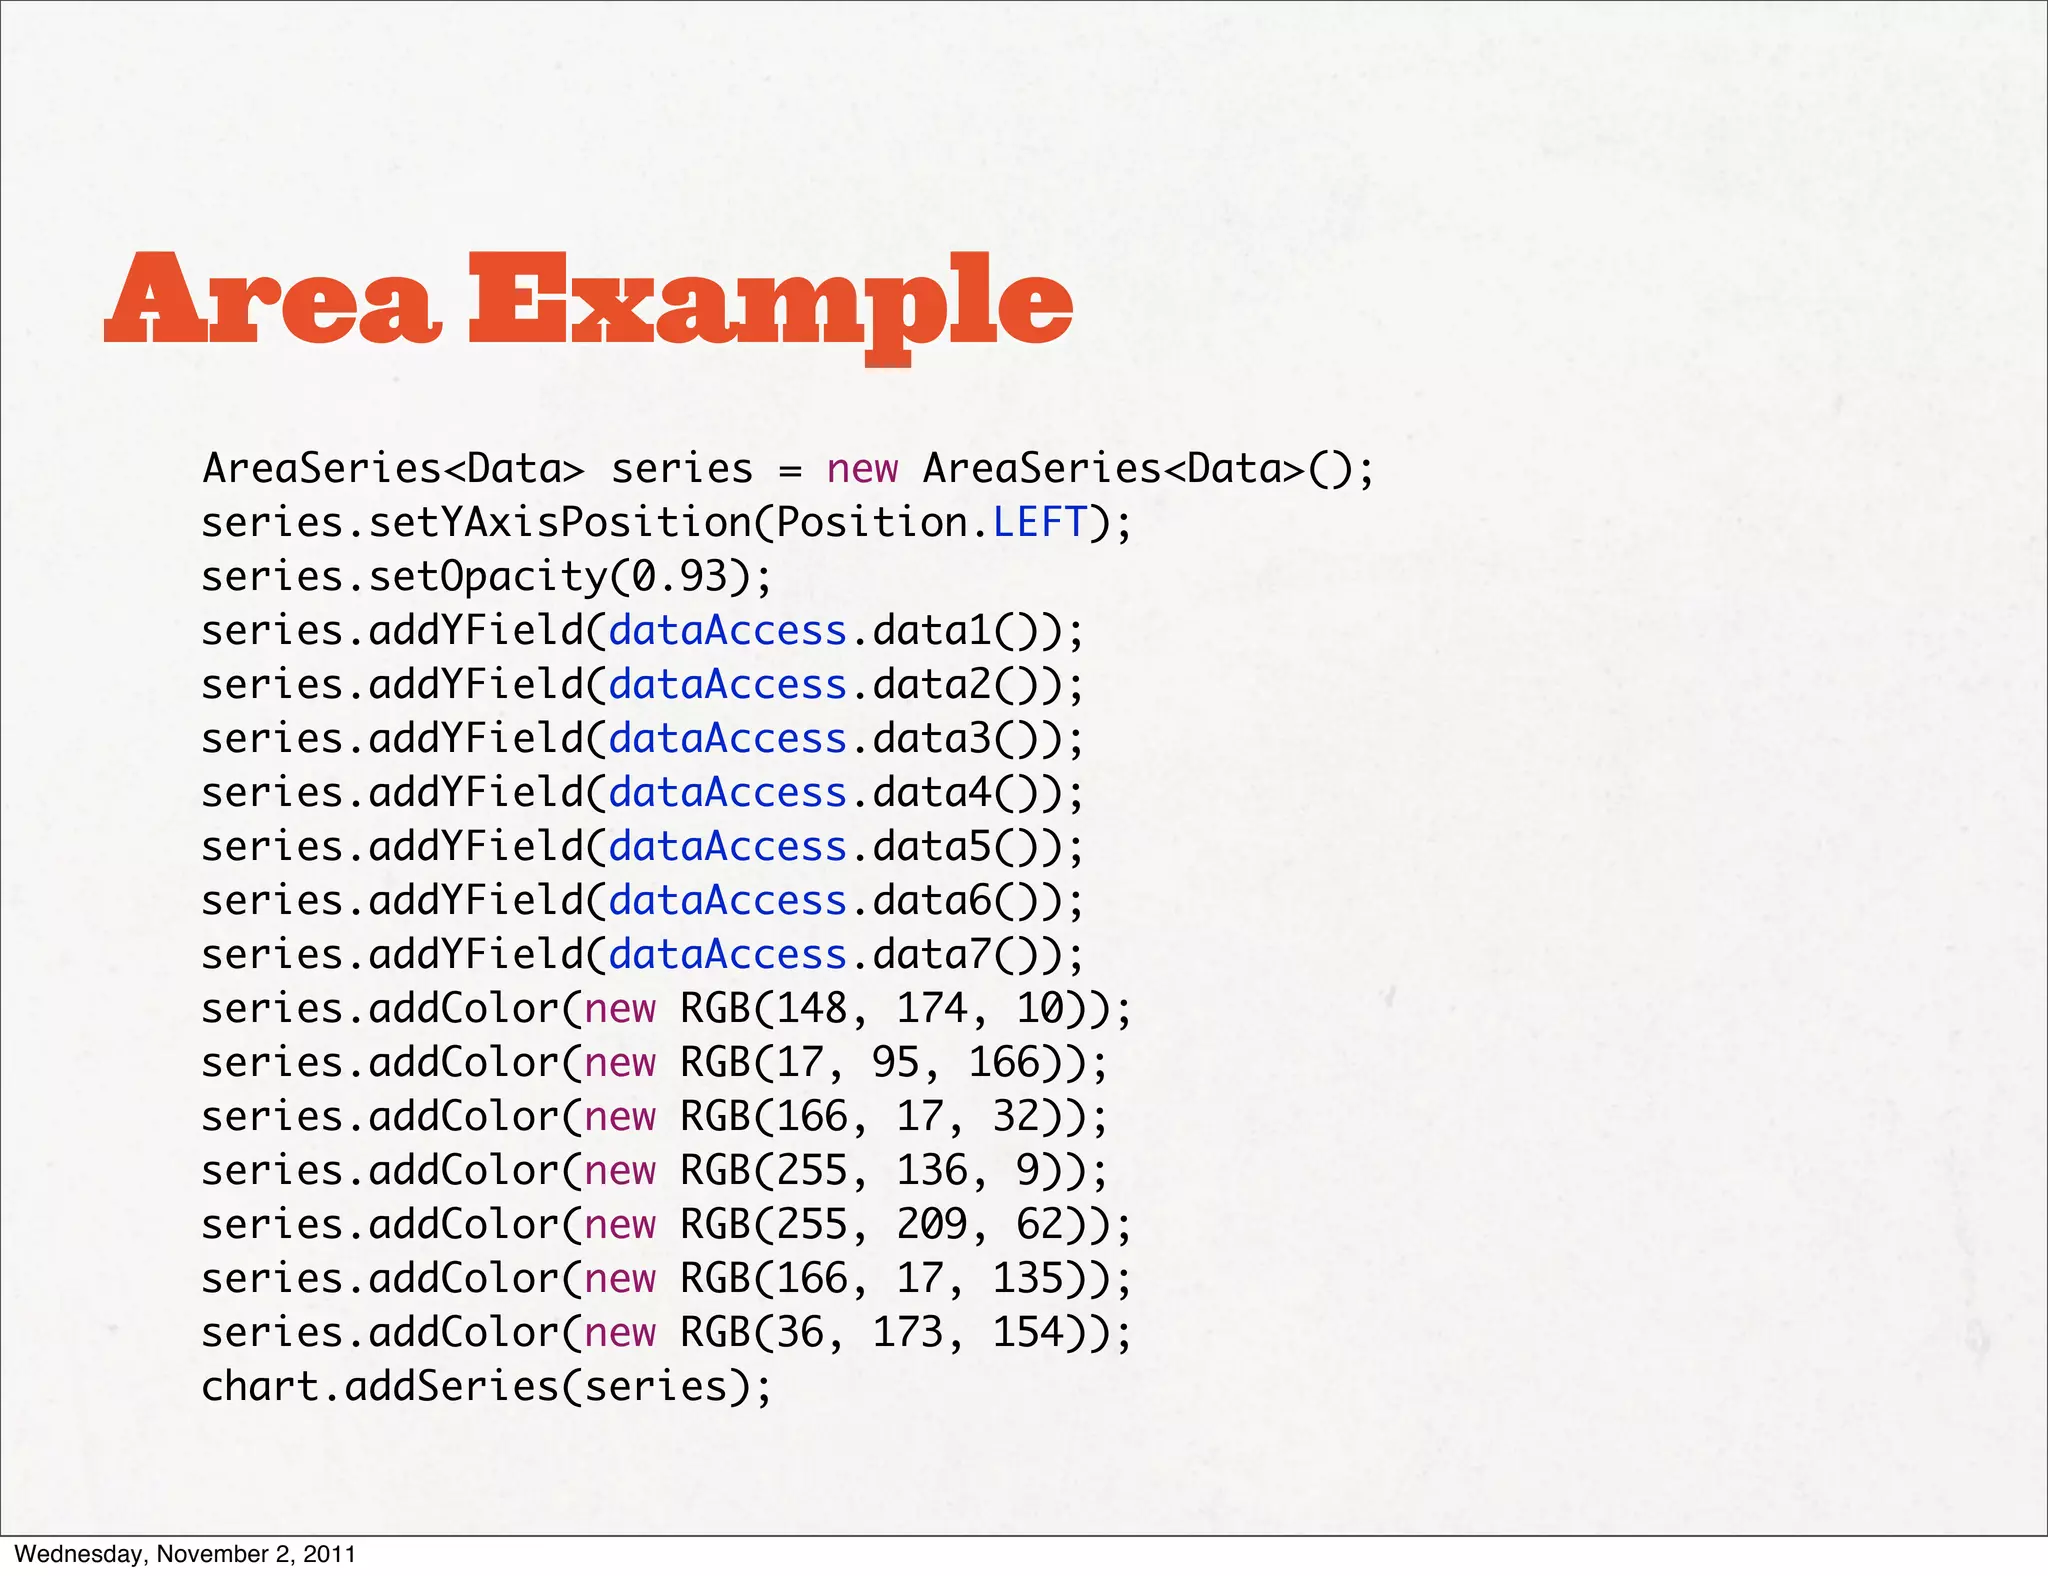
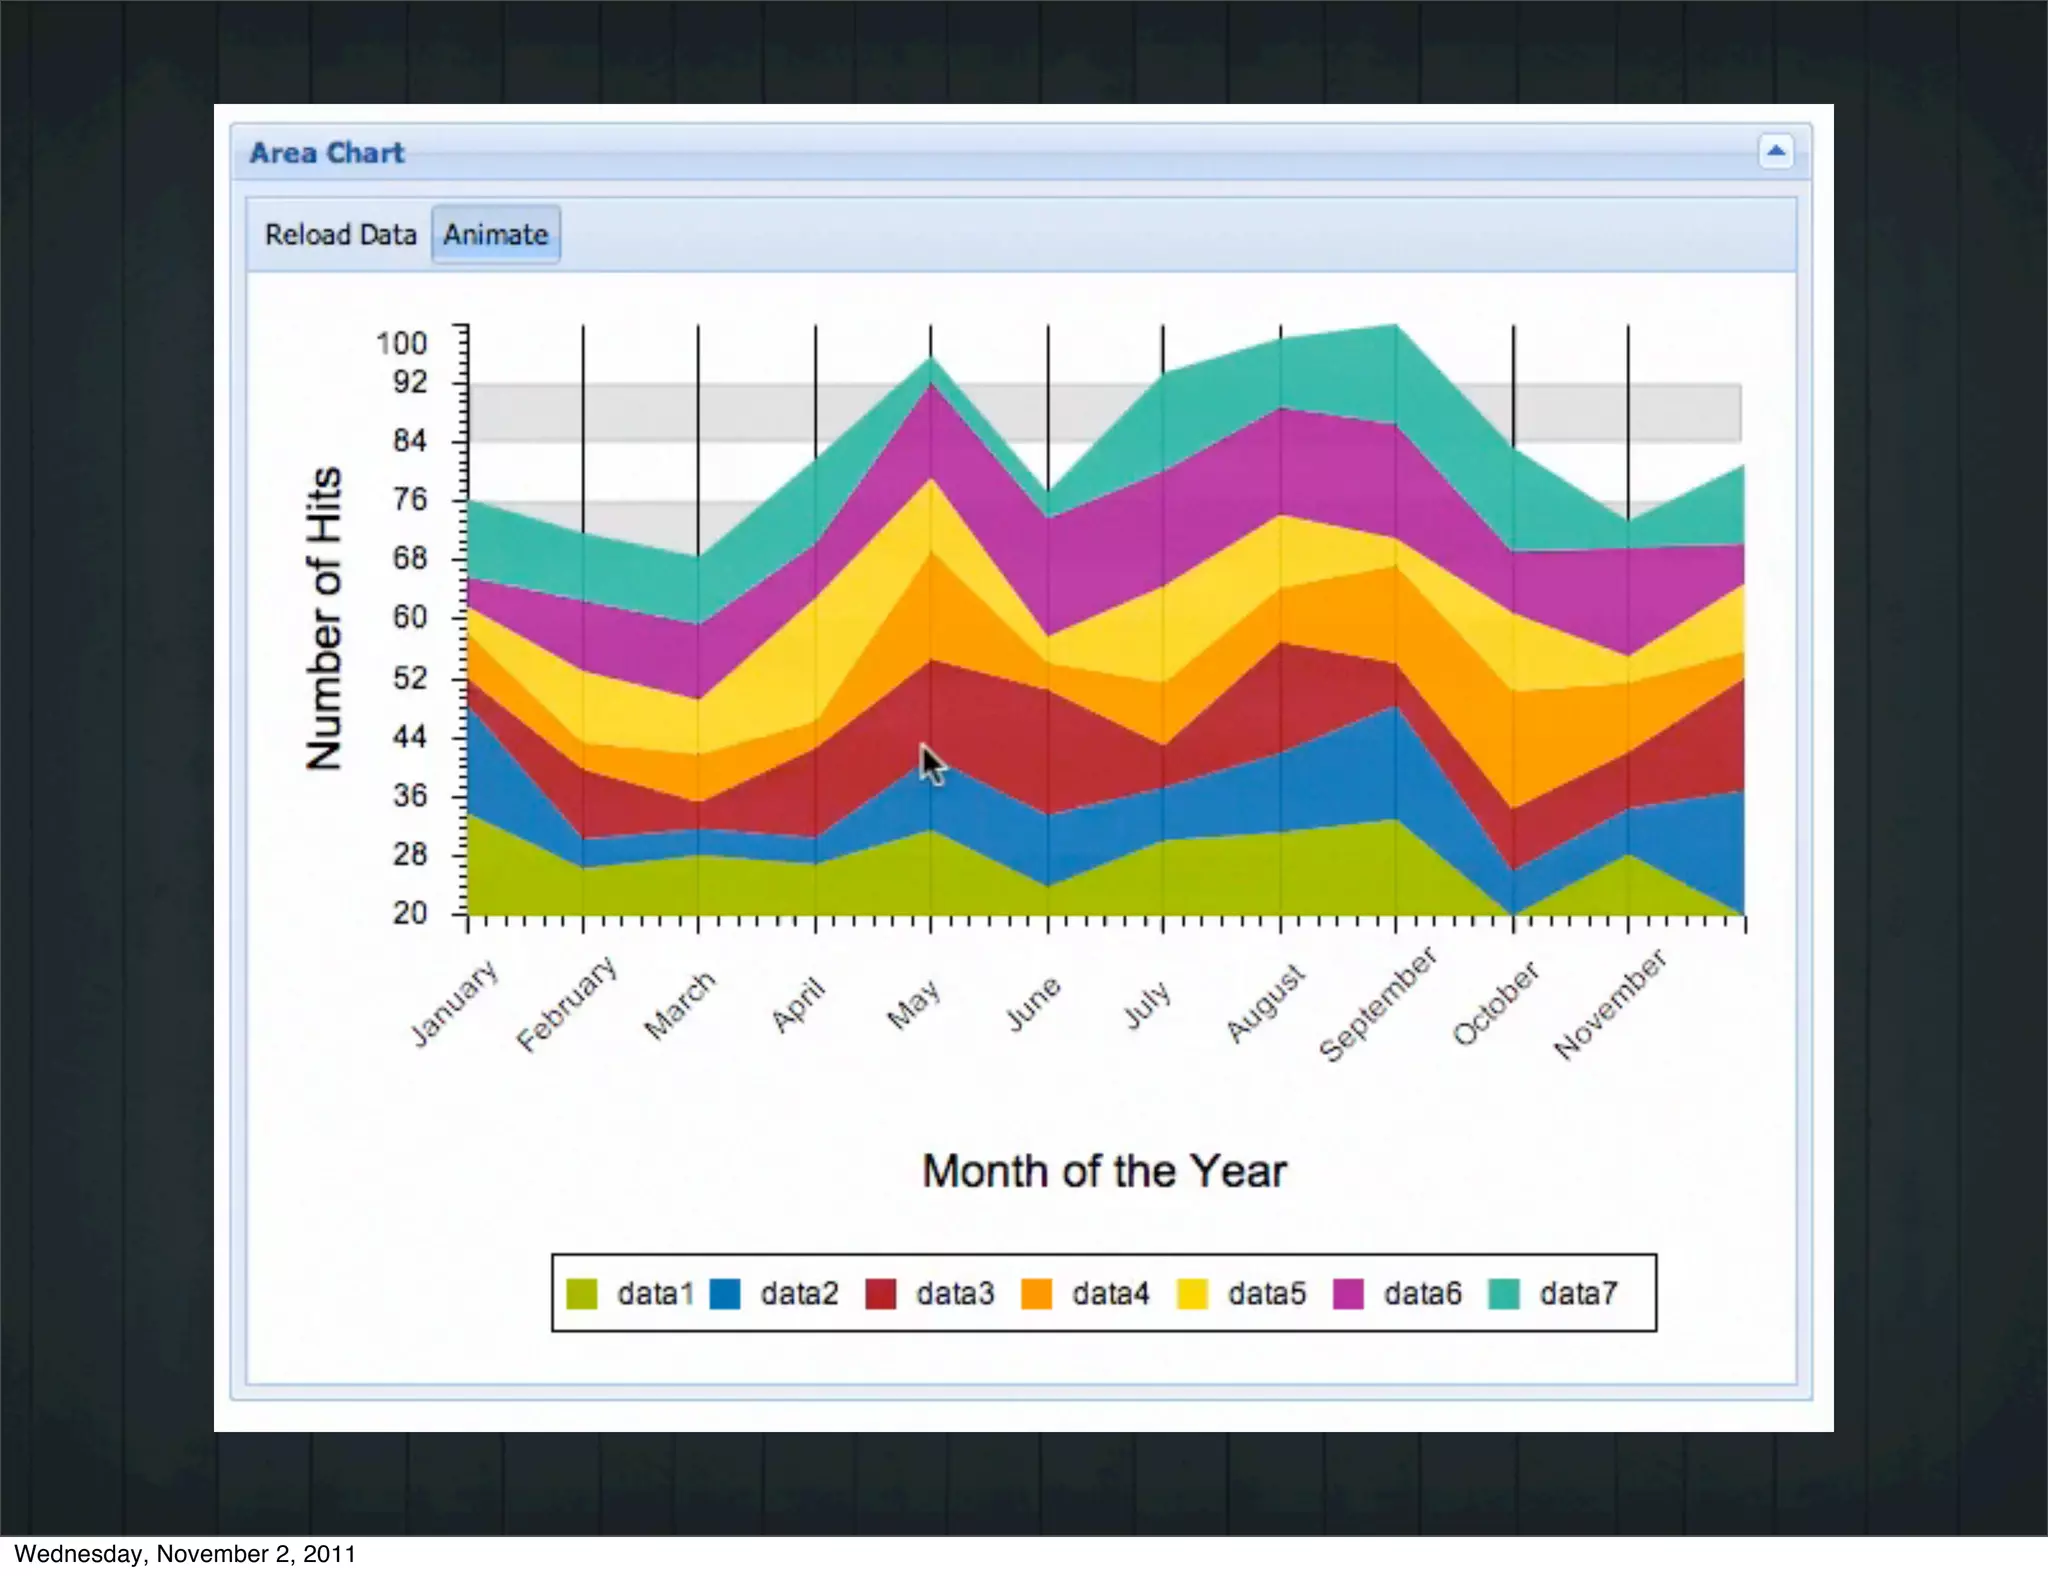
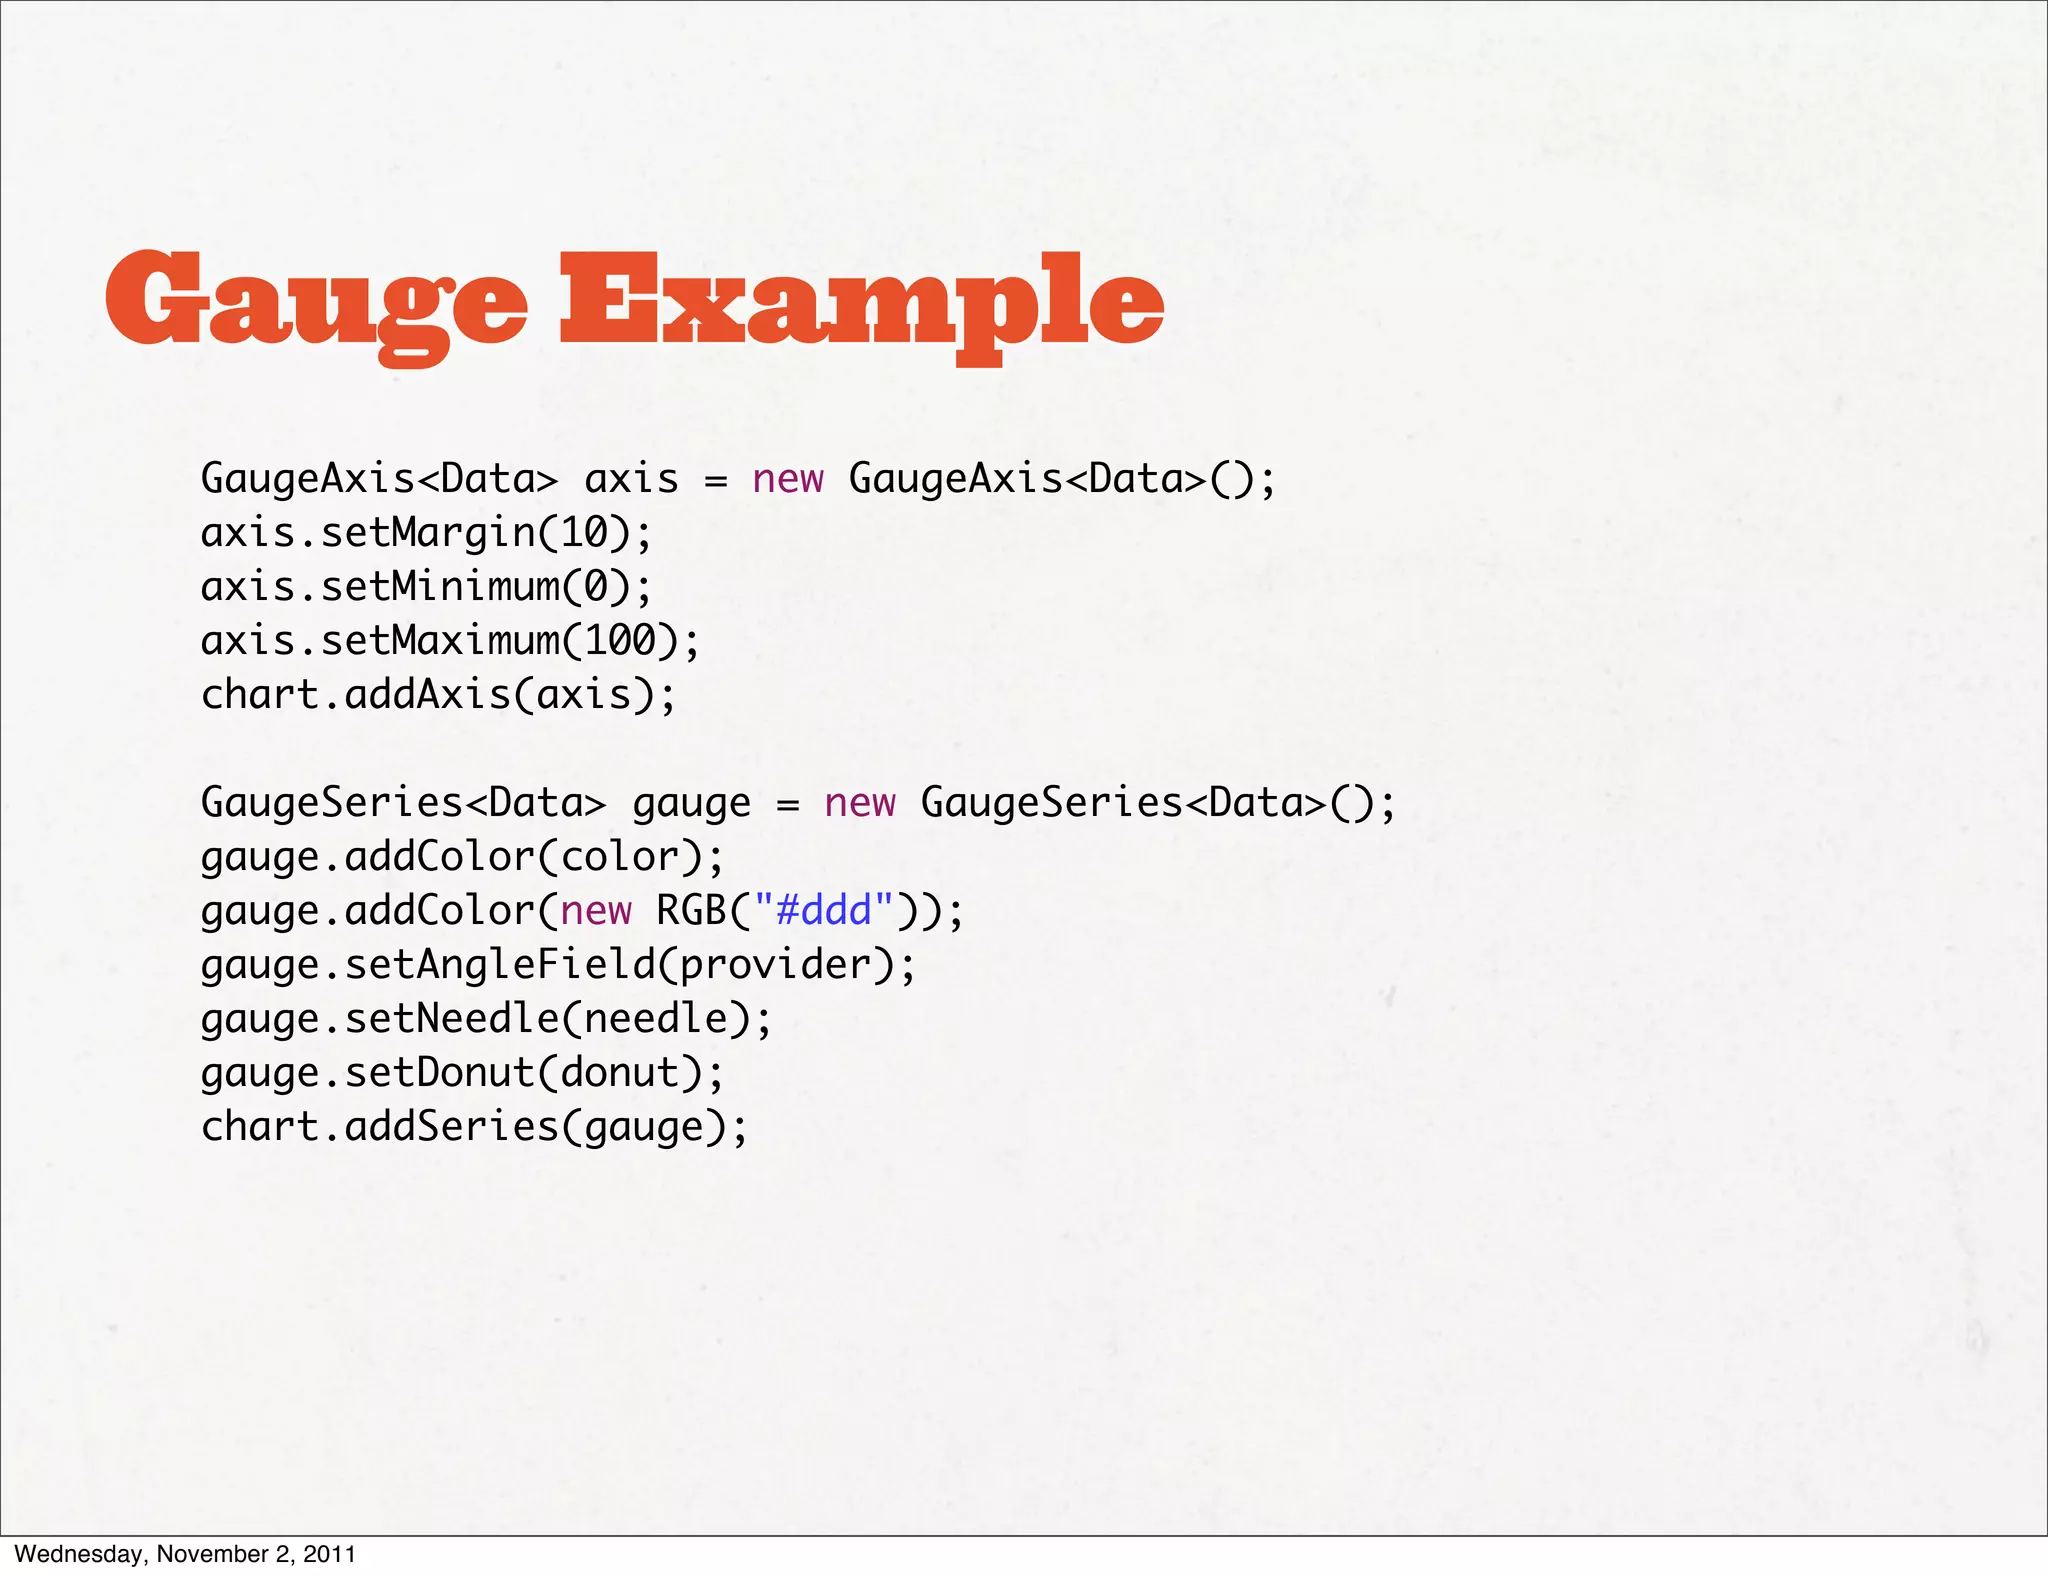
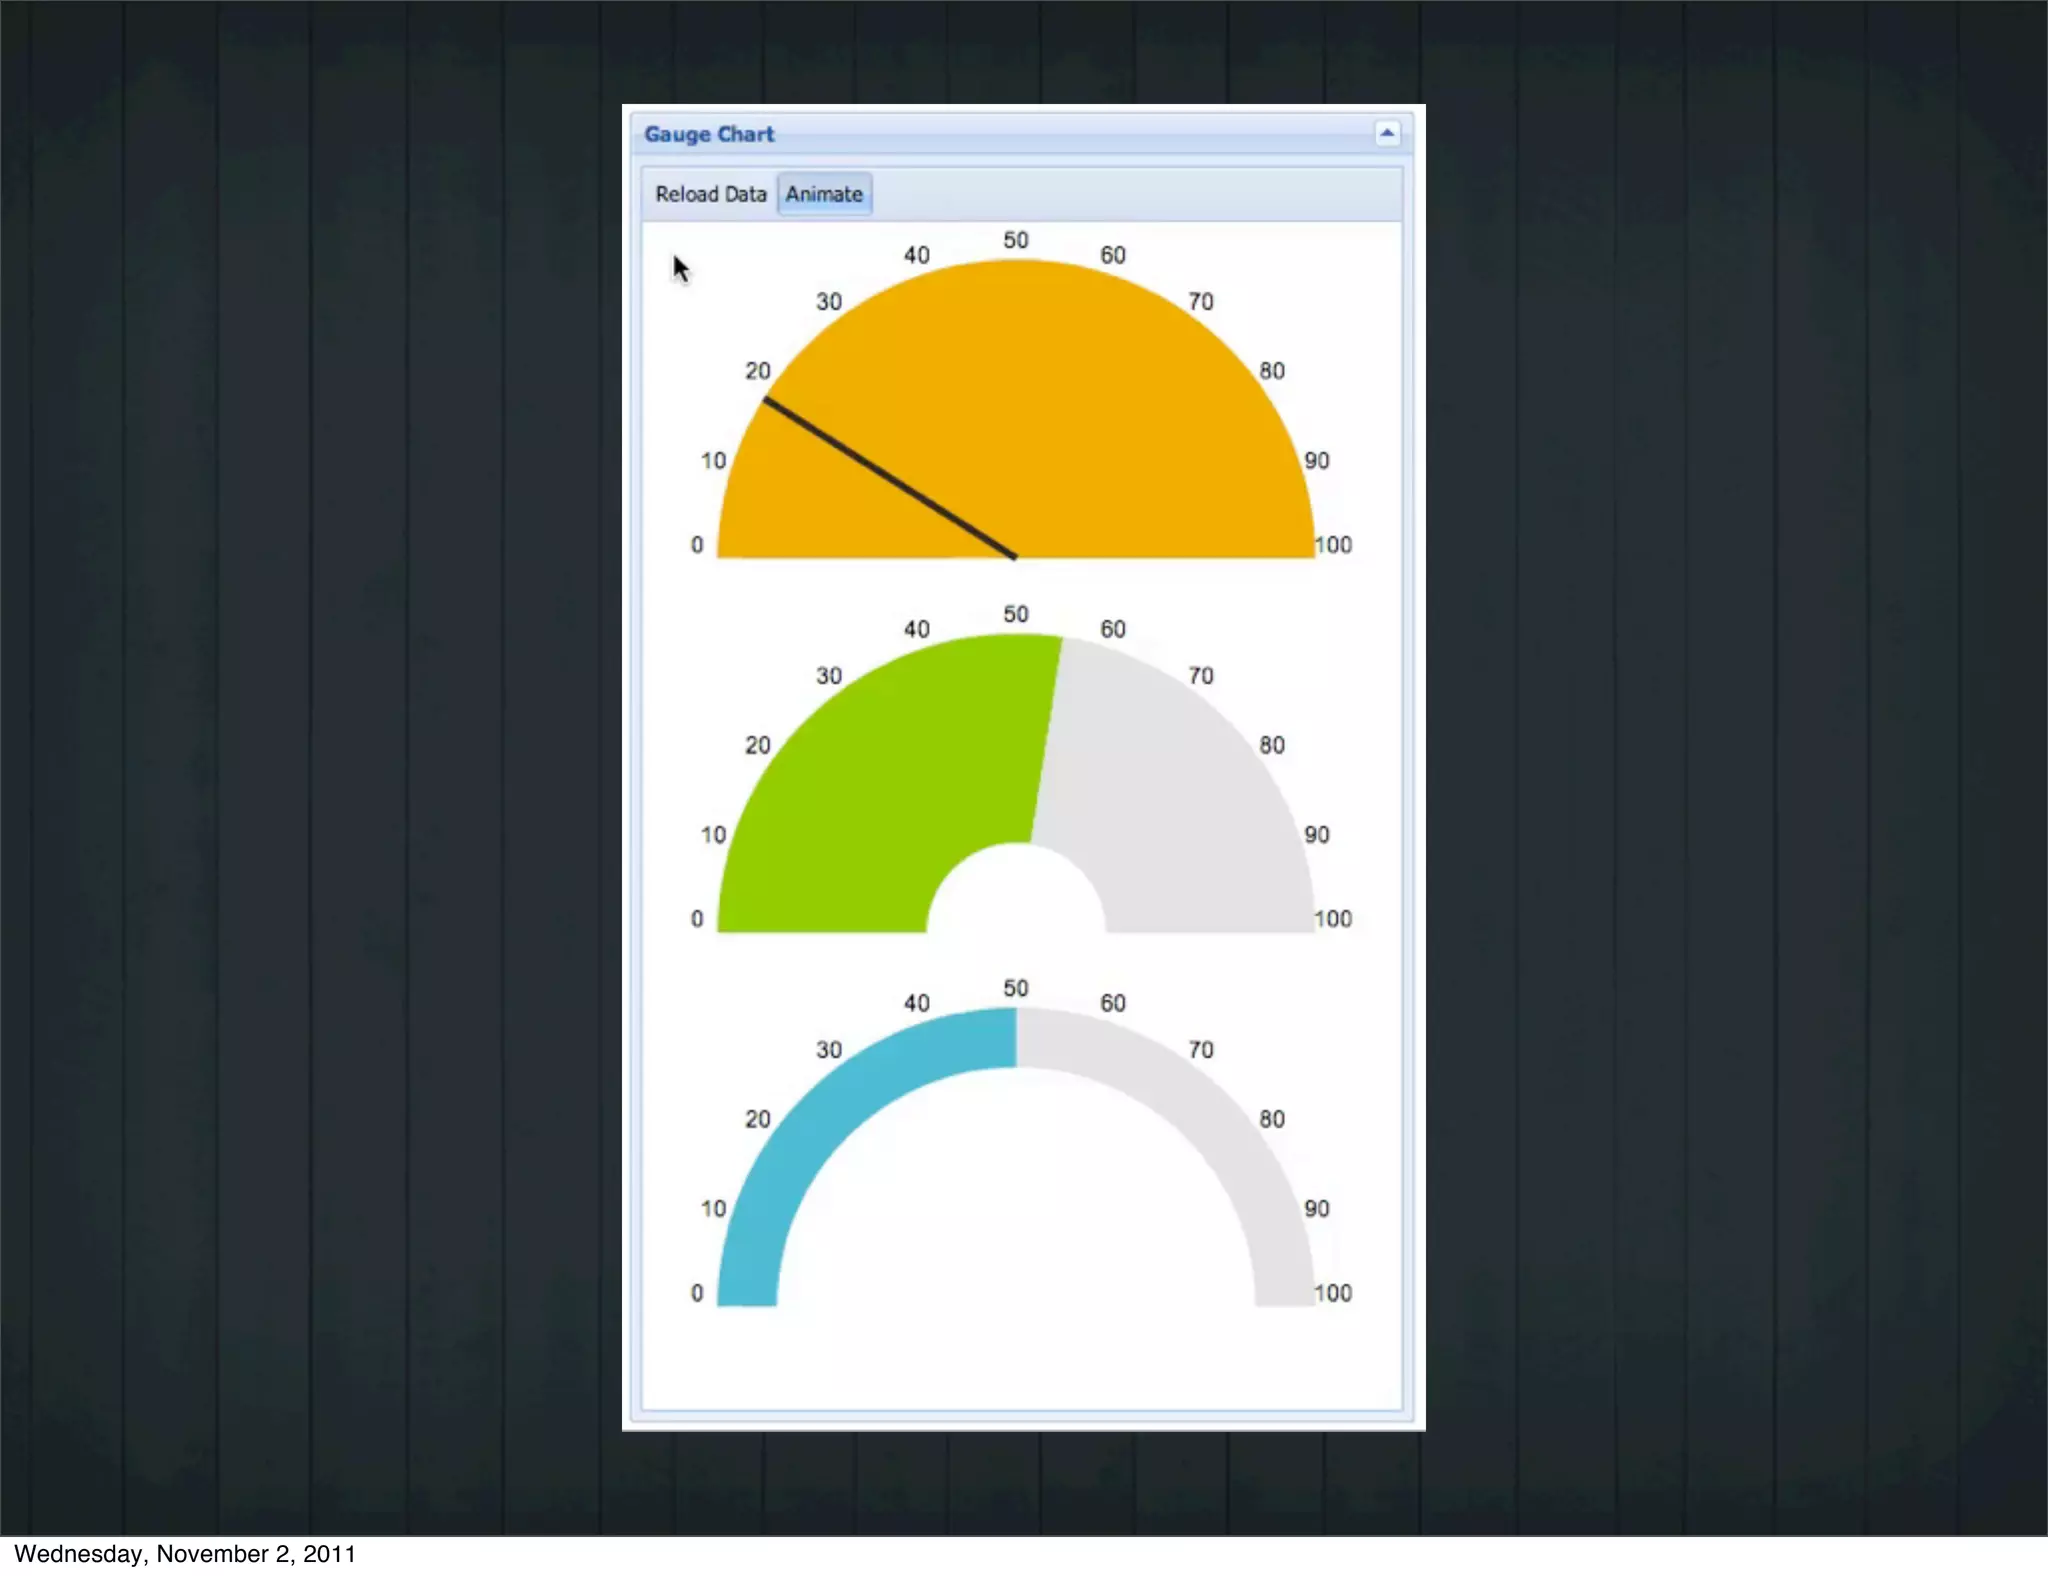
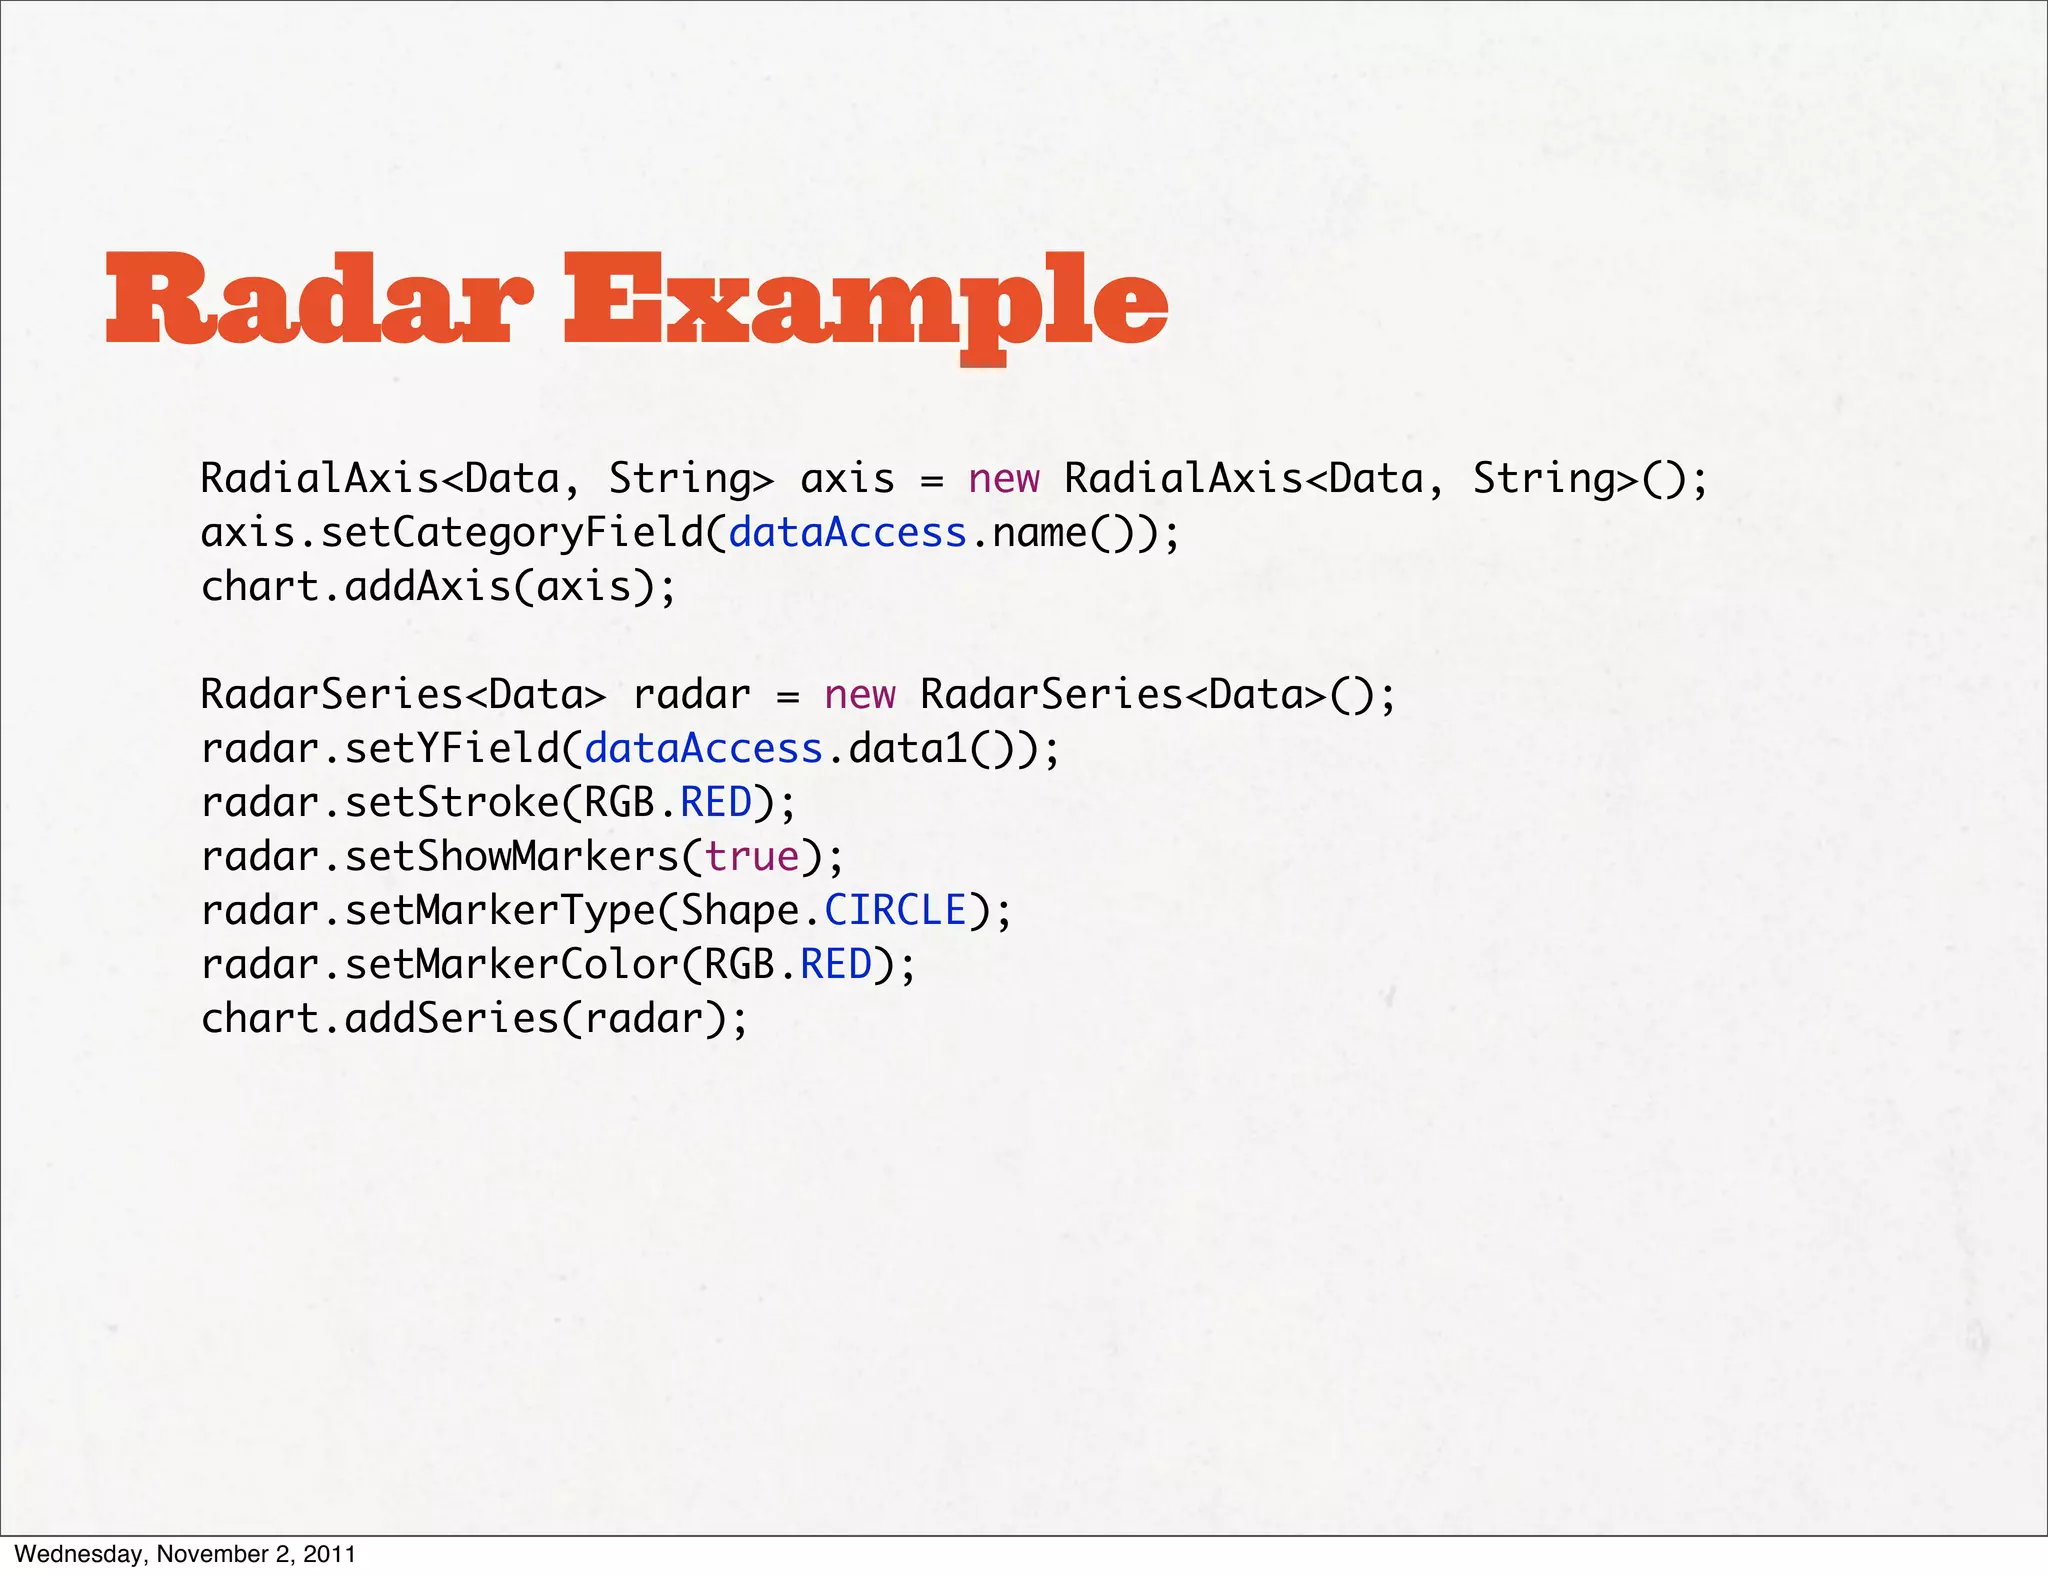
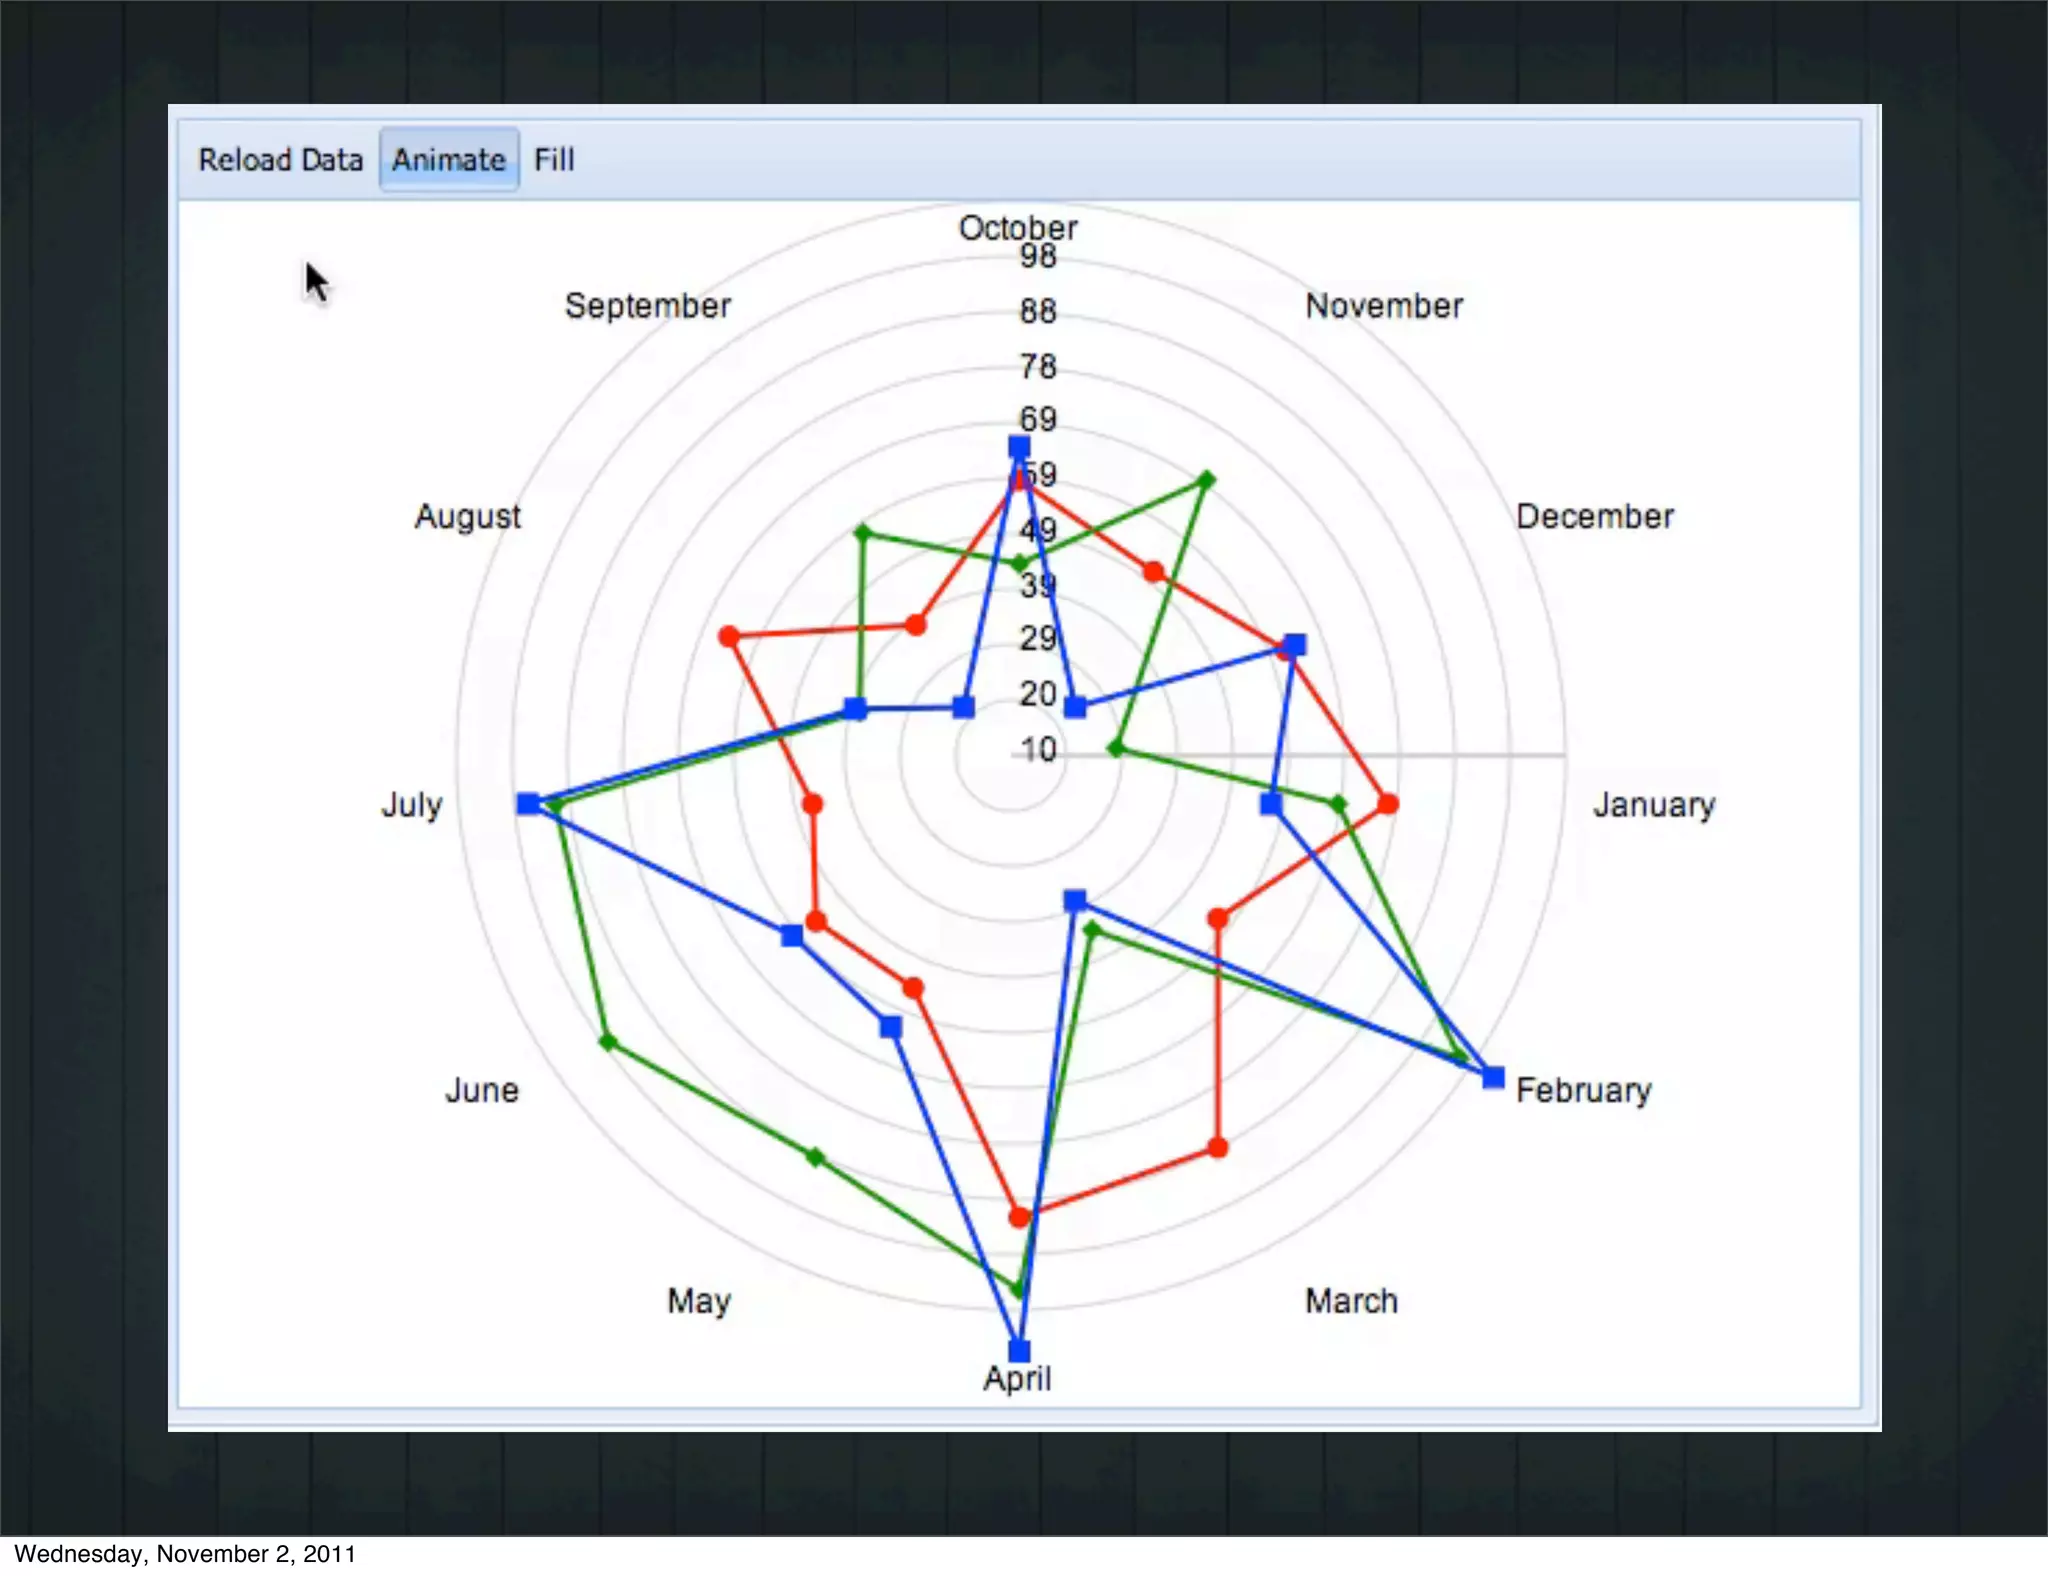
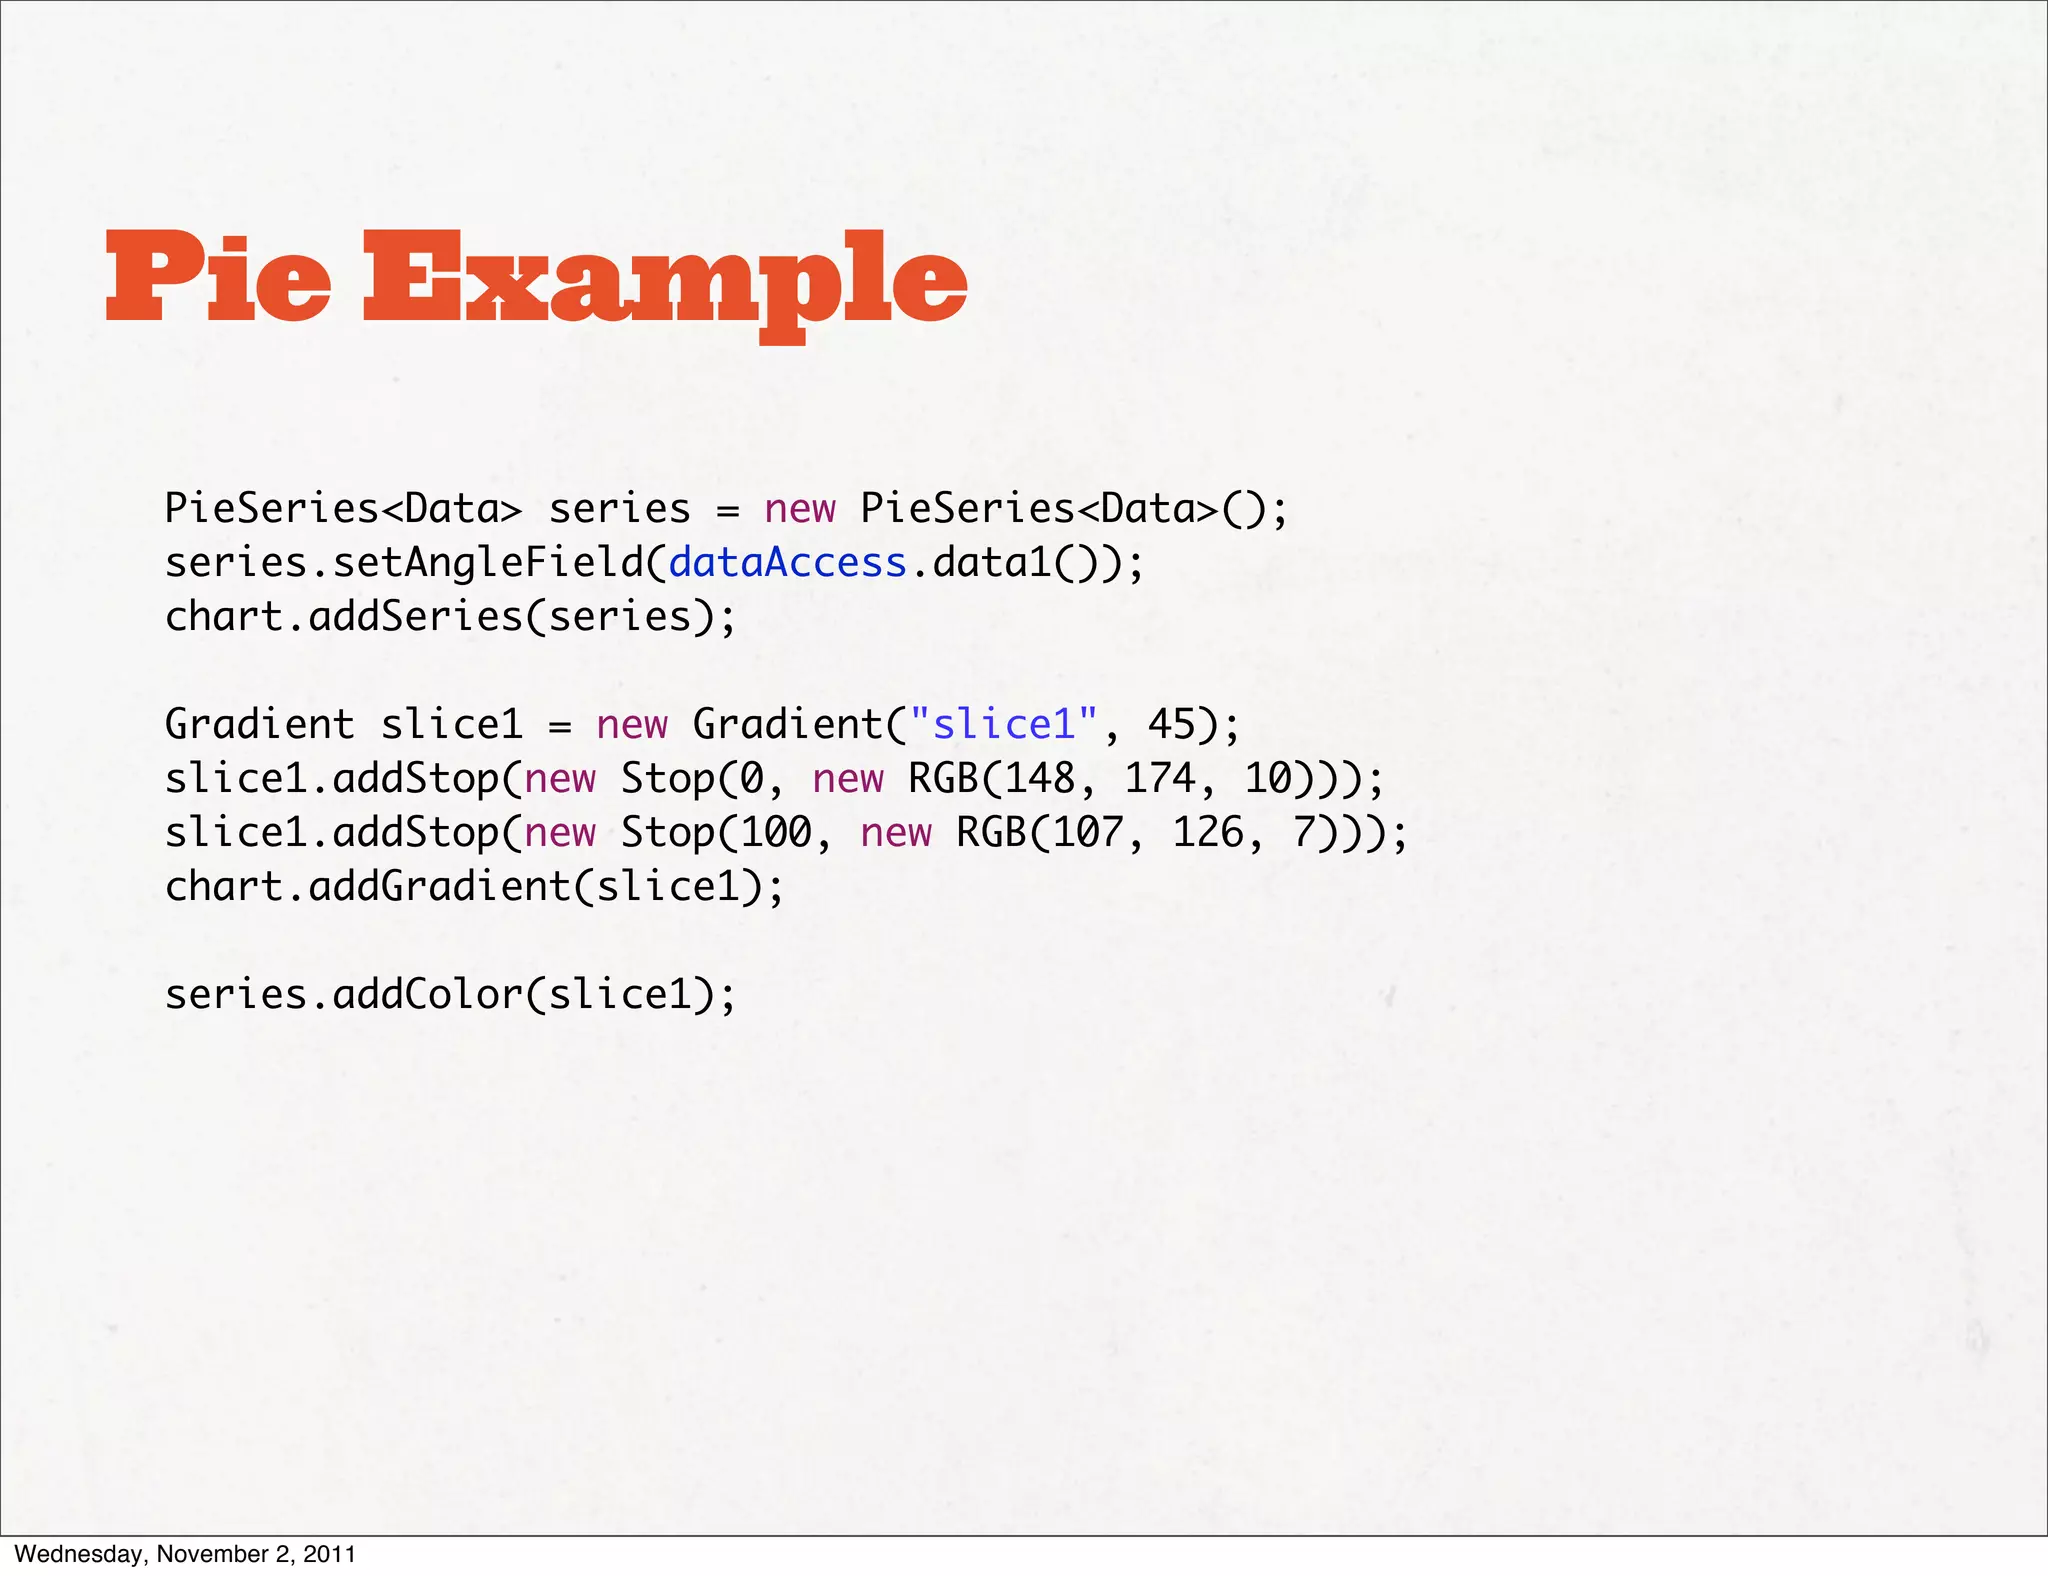
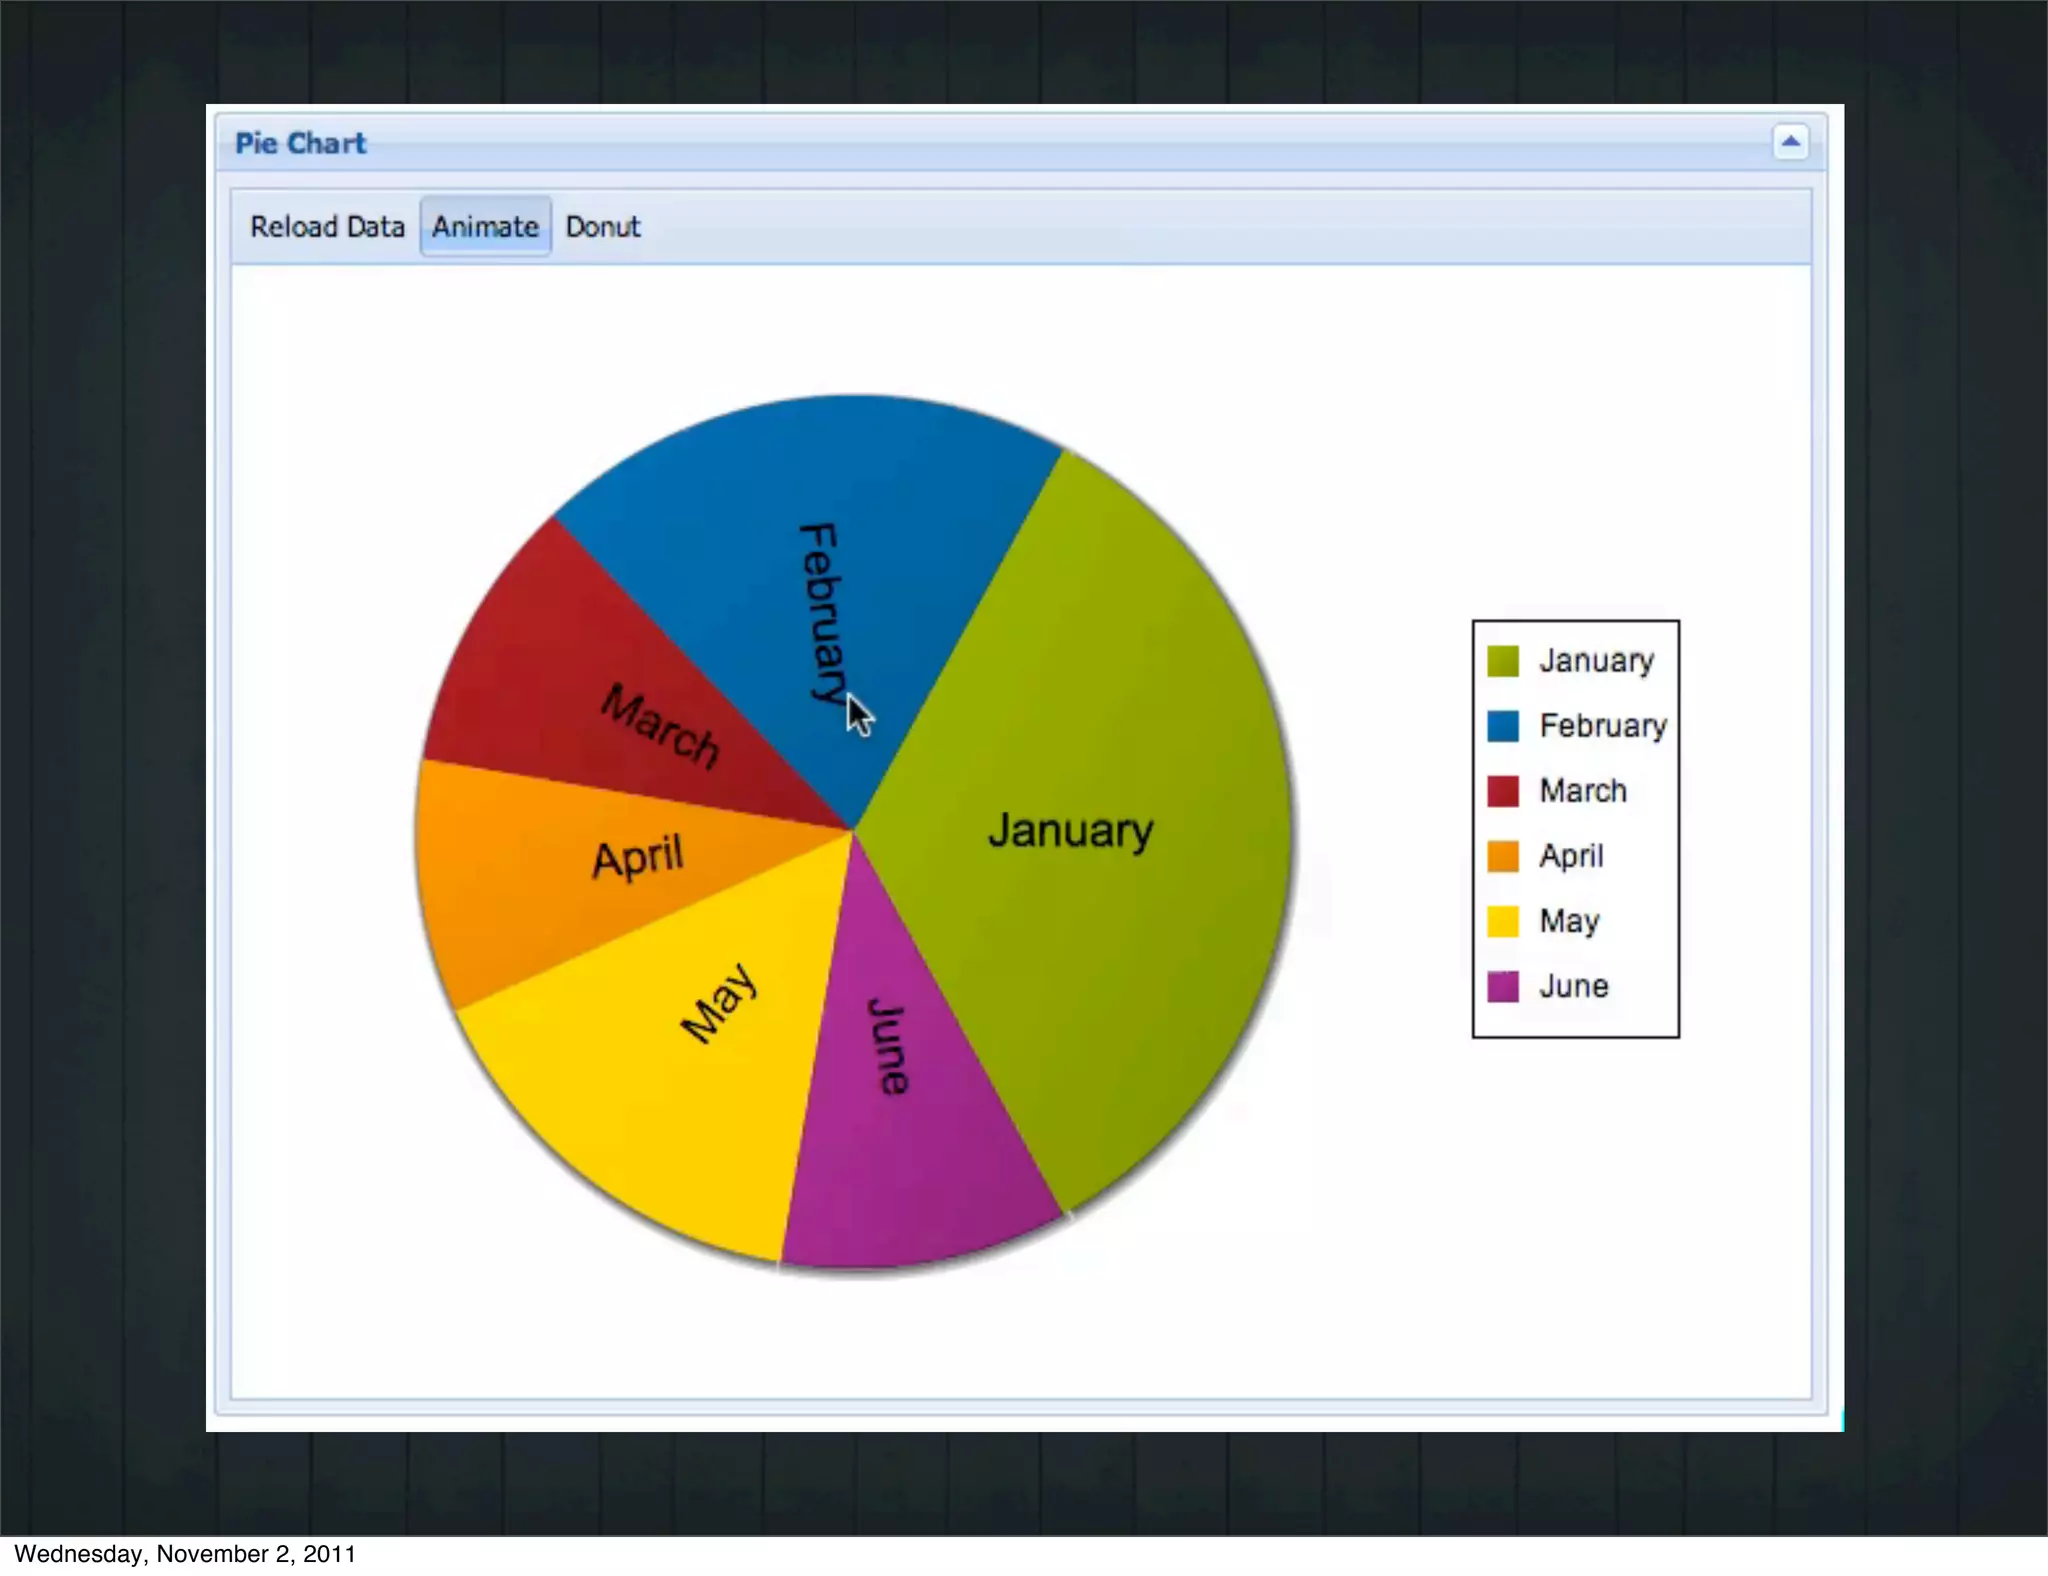
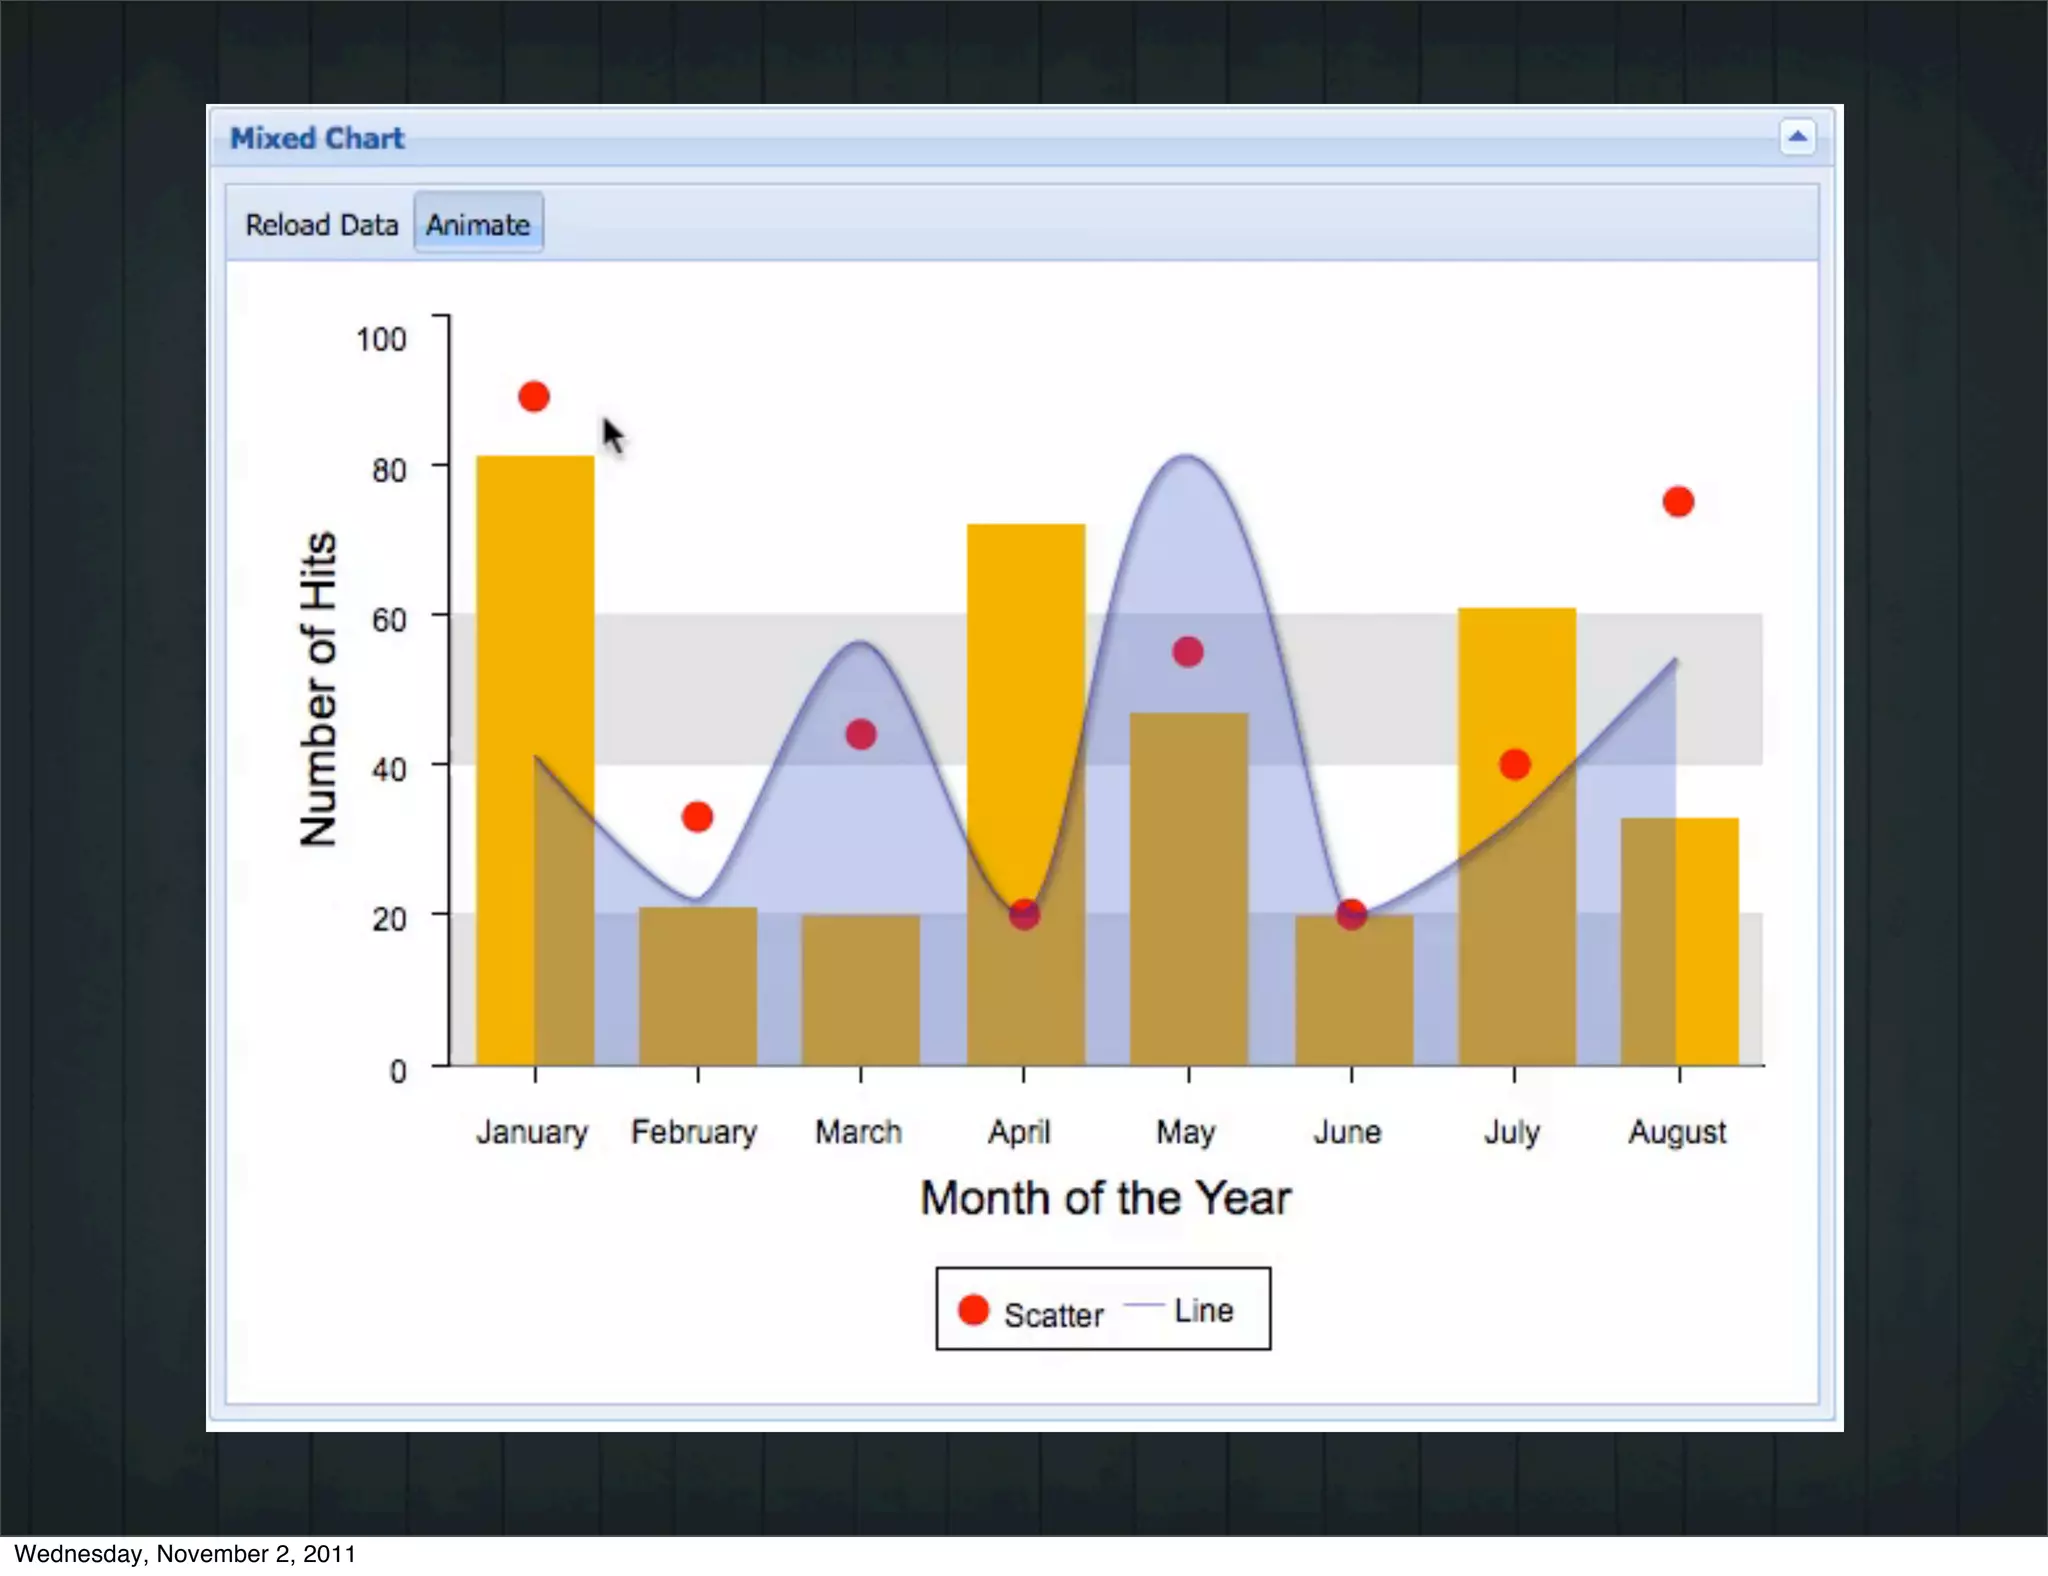
The document details various methods and examples for drawing and charting using a specific software framework. It covers different types of graphical components, such as scatter plots, bar charts, line charts, pie charts, and customization options for each. Additionally, it includes examples of implementing animation and interactivity within the charts.


![Vibe Coding vs. Spec-Driven Development [Free Meetup]](https://cdn.slidesharecdn.com/ss_thumbnails/vibecodingvsspecdrivendevelopment-251209105622-43f455e7-thumbnail.jpg?width=640&height=640&fit=bounds)


