Download to read offline
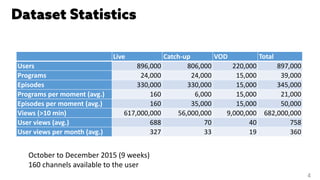
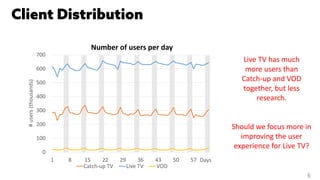
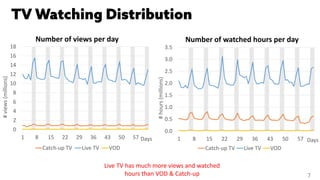
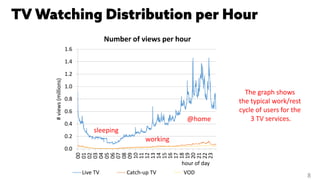
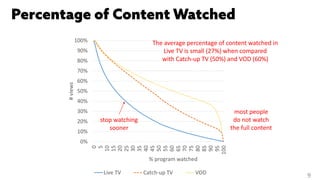
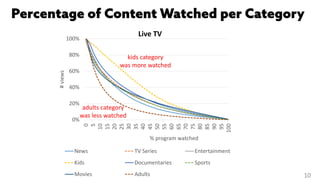
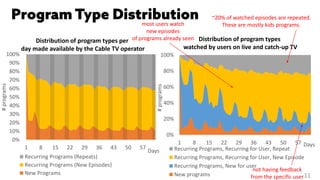
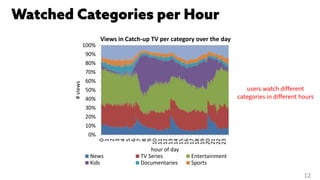
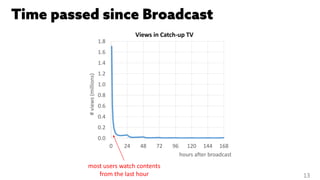
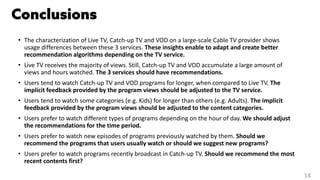

The document characterizes user behavior across live TV, video on demand (VOD), and catch-up TV in a large-scale cable TV environment, highlighting significant differences in usage patterns. Live TV garners the highest viewership and engagement, yet VOD and catch-up TV also accumulate substantial viewing hours, necessitating tailored recommendation systems. Users display preferences for content types based on time of day and show histories, emphasizing the need for adaptive recommendation strategies.


