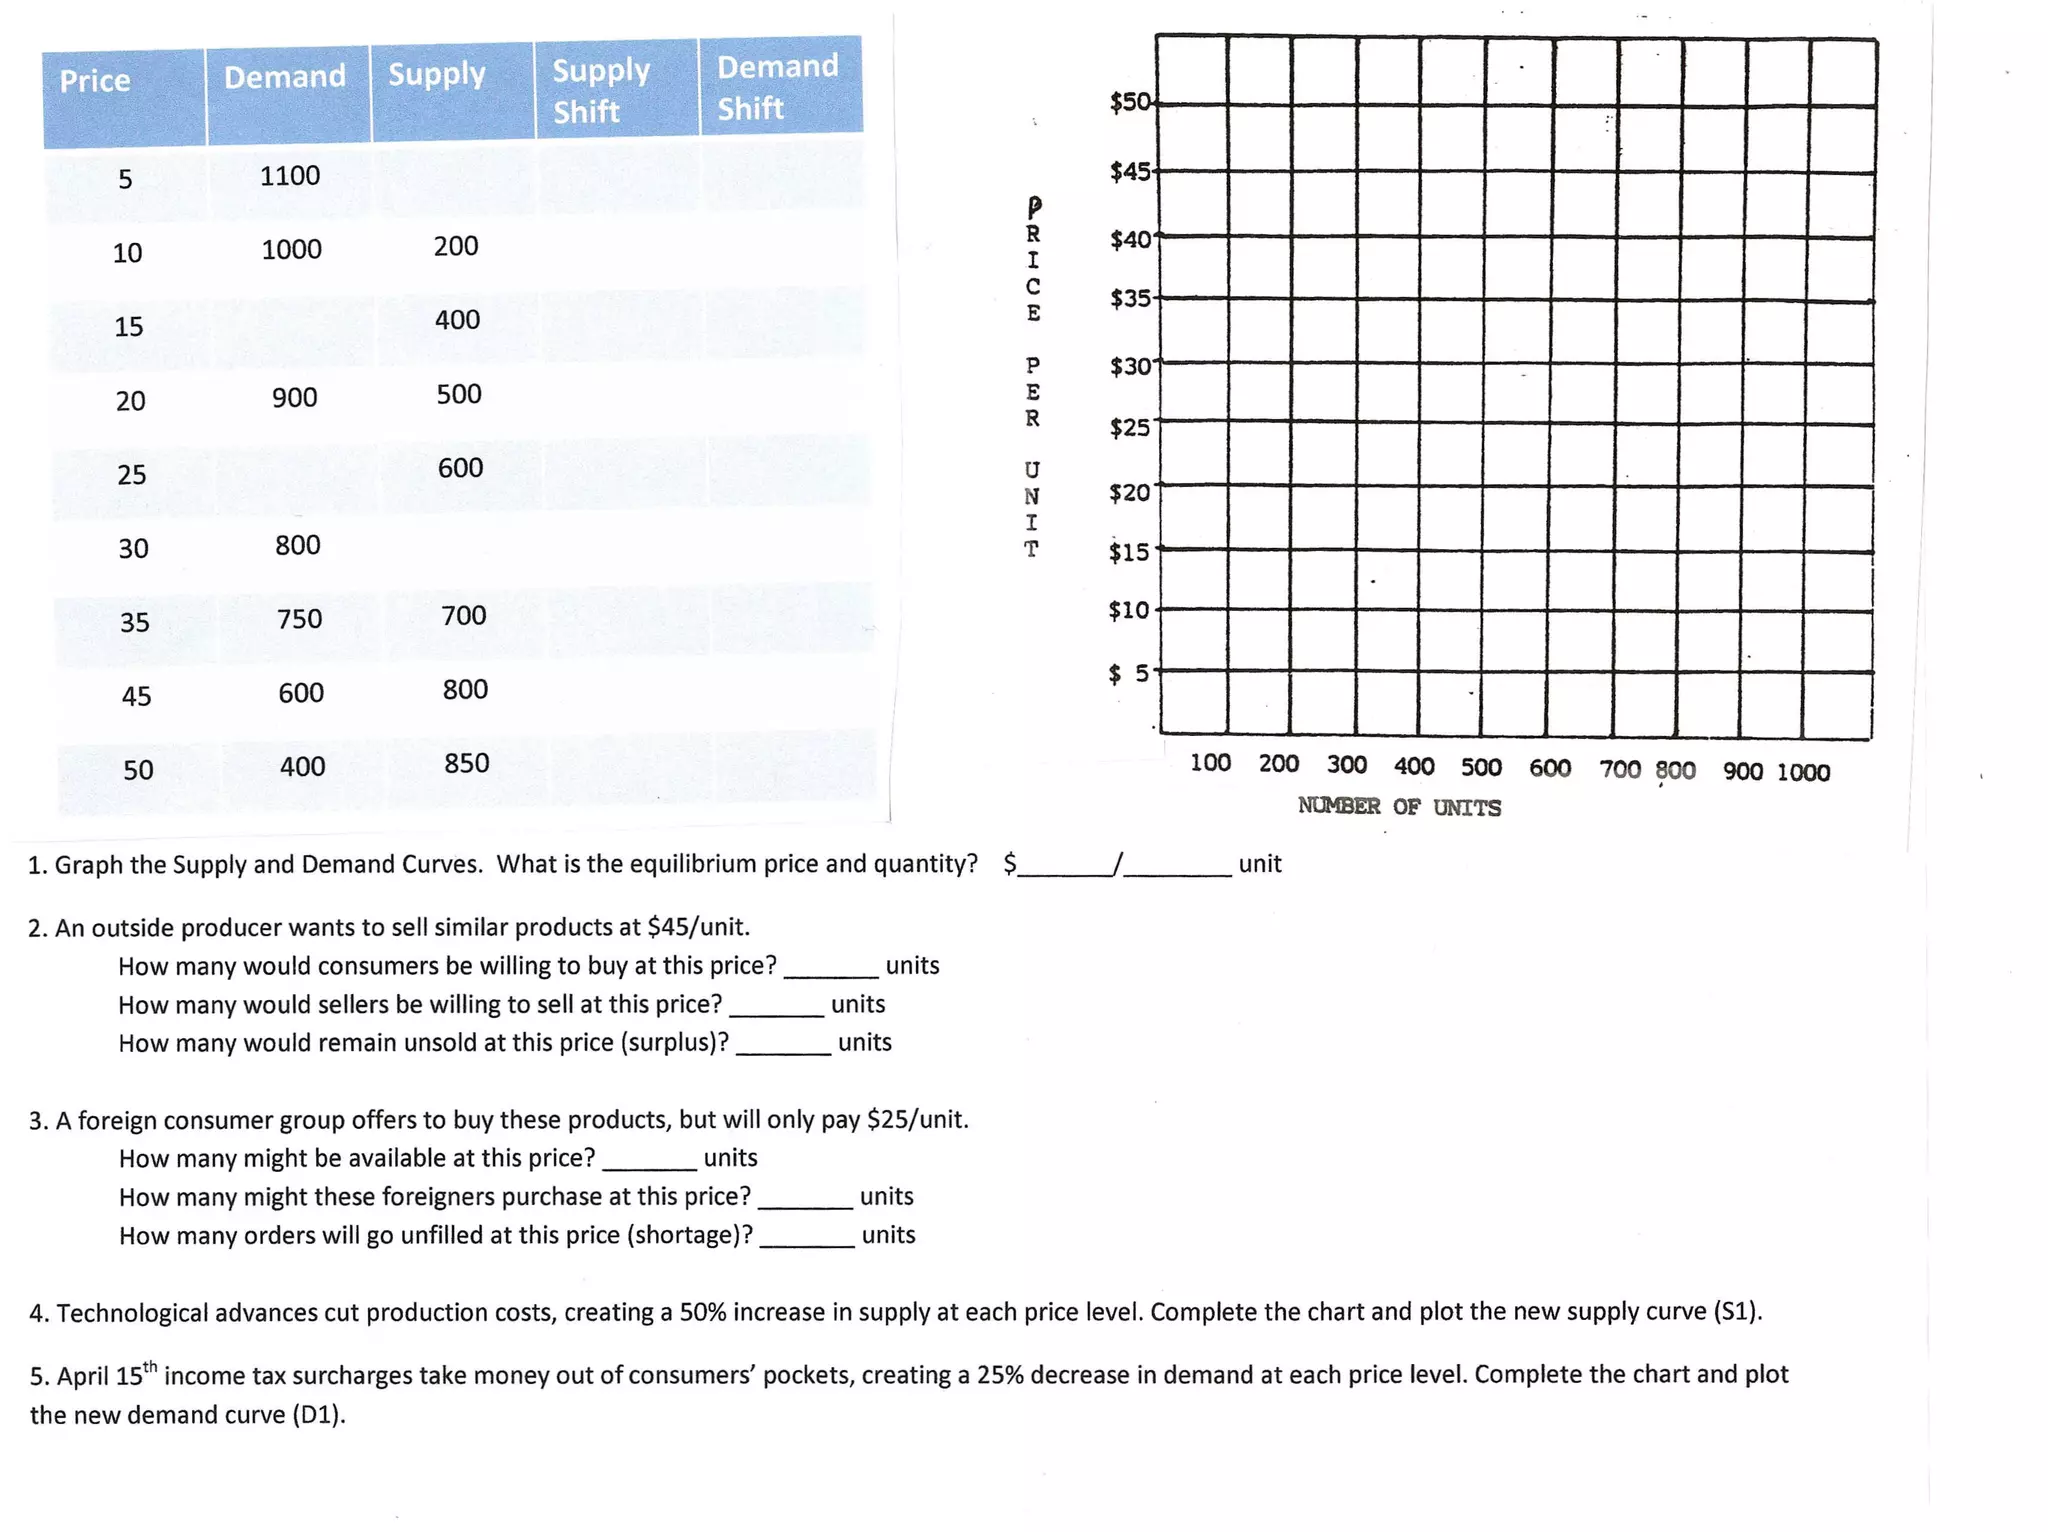
The document contains a supply and demand chart showing equilibrium price and quantity. It then asks 3 questions about how price changes would affect quantity supplied, demanded and market surplus/shortage. Specifically, it asks what would happen at a price of $45/unit and $25/unit. It also asks the reader to factor in a 25% reduction in demand due to a tax and plot the new demand curve.


![Chapter 6 [recovered]](https://cdn.slidesharecdn.com/ss_thumbnails/chapter6recovered-100615133422-phpapp01-thumbnail.jpg?width=640&height=640&fit=bounds)


