Downloaded 348 times
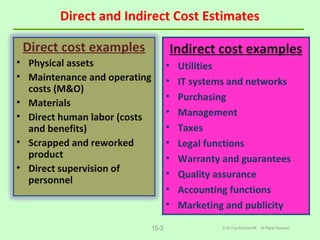
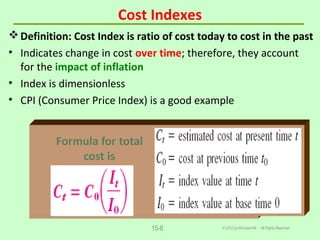
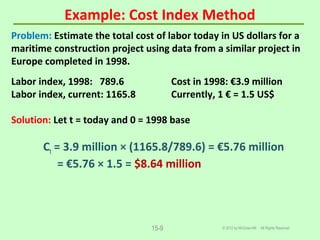
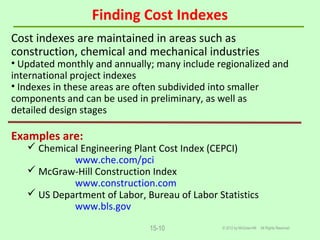
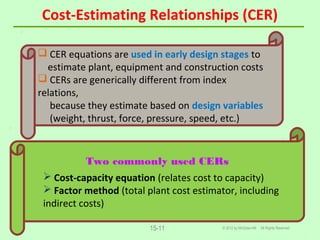
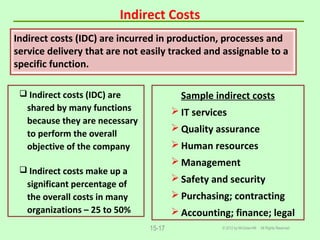
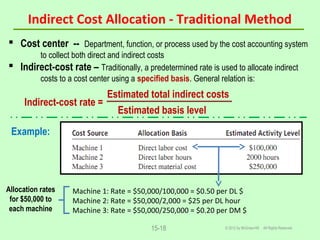
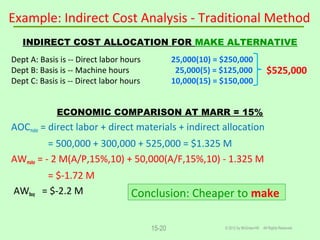
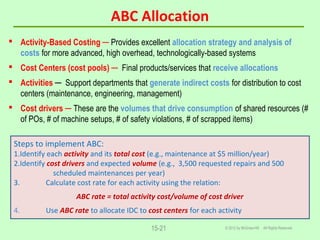
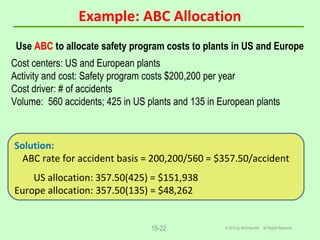
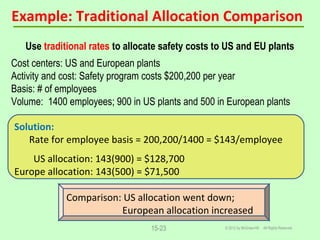
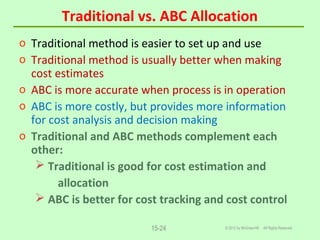
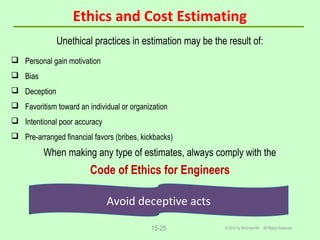
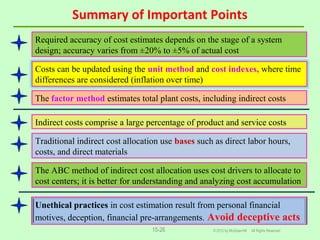

Direct and indirect costs must be estimated for engineering projects. Common direct cost estimation techniques include the unit method, cost indexes, and cost-estimating relationships. Indirect costs can comprise 25-50% of total costs and are traditionally allocated using predetermined rates. Activity-based costing is a more accurate method that uses cost drivers to allocate indirect costs to cost centers. Ethical practices, like avoiding deception, are important for creating unbiased cost estimates.


