Downloaded 52 times

![UK Renewable Energy Policy since Privatization 259
incentivized minimization of expenditure on pre- development.” Institutional barriers emerged
paring realistic bids (Mitchell and Connor 2004). early on as a critical factor in successful project
In reviewing the failure of the NFFO policy, implementation (McGowan 1991).
it is important to remember the context in which In particular, it became clear that projects had
it operated. Renewables were then a very low a problem with gaining the necessary consents
priority for UK government policy, and it was a required to start building, known as “planning
period of a rapid switch from coal- to gas-fired permission” in the United Kingdom, and that a
power. Prices and pollution, in terms of quantities lack of attention was given to proper environmen-
of CO2, SOx, and NOx, fell substantially. The tal impact assessments (Coles and Taylor 1993).
focus on market-driven investments was good for Hull (1995) noted that in the early years, less than
energy and carbon-efficient combined heat and half of all councils, the local government bodies
power (CHP) investment in the industrial and responsible for consents, had planning guidance
commercial sectors (Bonilla 2006; Harvey 1994; for renewable energy projects, and more impor-
Marshall 1993), which had struggled prior to pri- tant, there was a lack of learning among councils.
vatization (Jarvis 1986). UK privatization was a Calls came for clearer guidelines for the planning
significant policy success in economic terms, process to facilitate wind power (Roberts and
especially when the benefits to the environment Weightman 1994). Early industry views of the
are considered (Newbery and Pollitt 1997). scheme were positive, recognizing that it did con-
The privatization and market liberalization stitute a significant increase in expenditure over
policies ensured that the United Kingdom would previous levels (Porter and Steen 1996). However,
easily meet its Kyoto targets for 2012 without any the successive rounds of auctions were thought
further action, which was not the case for other not to provide assurance of continuity of support
leading European countries. The mood at the for renewables generally (Elliott 1994; Mitchell
time was nicely summarized by a government 1995), and some worried that although they sup-
minister for energy in 1988, Michael Spicer, who ported near-market technologies, declines in
wrote that “privatisation of the electricity supply R&D expenditure were bad for less advanced
industry should boost the commercial prospects technologies such as marine (Elliott 1994).
for these [green] technologies as a free market is The final years of NFFO, 1999–2001, coin-
established” (Elliott 1992, 266). Indeed, Friends cided with a sharp decline in wholesale electricity
of the Earth was optimistic that the opening up of prices as significant amounts of new gas-fired
the residential energy market to competition in capacity came into the market and competition
1998–1999 would give rise to demand for green increased within the initially duopolistic genera-
tariffs and stimulate the production of green tion sector (Evans and Green 2003). NFFO gen-
energy (Stanford 1998). It was only as the EU erators had made overoptimistic bids, and their
moved toward substantial targets for renewables situation was exacerbated by the end of the com-
that it became clear that the United Kingdom pulsory wholesale power pool, which had guaran-
needed a policy that delivered large quantities of teed the pool price to all generators, in March
renewables.10 Nevertheless, significant lessons can 2001. It was replaced with a contract market and a
be learned from the NFFO experience. balancing market. Imbalance between supply and
Somewhat surprisingly, little quantitative demand for an individual generator was now
analysis has been done on the bids that were suc- more likely to result in a financial penalty. Inter-
cessful under NFFO and the factors in their suc- mittent renewable generators were more likely to
cess and failure. Elliott (1992, 267) criticized the need to participate in the balancing market to bal-
NFFO scheme as a “somewhat half-hearted ance their physical and contractual positions;
hybrid market/interventionist system” that because of the exogenous effects of weather, wind
“would still leave short-term price and market generators have less capacity to match supply and
factors to shape important long term strategic demand than fossil-fuel generators, who can
choice concerning patterns of technological adjust their spinning reserve. This is not necessar-](https://image.slidesharecdn.com/hrech13web-100914115702-phpapp01/85/Chapter-13-UK-Renewable-Energy-Policy-since-Privatization-7-320.jpg)
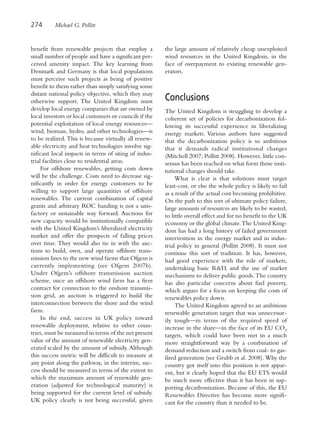
![UK Renewable Energy Policy since Privatization 261
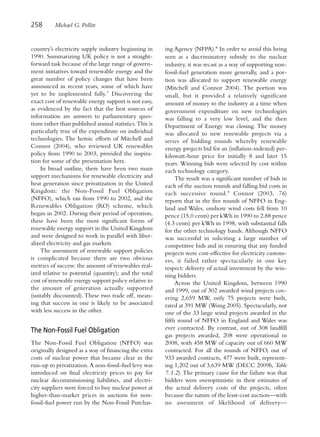
takes the form of allocating the revenue back to The scheme is further complicated by the
the creators of ROCs in proportion to the introduction of “banding” starting on April 1,
number they created. 2009 (see Table 13.5). This changes the exchange
The renewable energy industry was very posi- rate to ROCs of some renewable generation:
tive about the new incentive mechanism (Hill and established technologies will get less than 1 ROC
Hay 2004). So they should have been, because the per MWh, newer more. This change breaks the
scheme is very generous. Thus for example in link between the total number of ROCs and the
2007–2008, the buyout (penalty) price was share of renewable energy generation and will
£34.30 ($51.45) per MWh, and only 64% of the presumably result in a reduced amount of elec-
required ROCs were created by generators, tricity being produced from renewables if the
meaning the buyout price was binding in the cer- scheme is fully successful (if the share of high-
exchange-rate technologies were to take off, as it
tificate market. The total payment by suppliers
might with offshore wind). The Carbon Trust
was the target quantity of renewables multiplied
by £34.30 ($51.45) per MWh. This meant that Table 13.5. Banding of ROCs from April 1, 2009
36% of the total ROC payment made by suppliers
was available to be recycled and was divided pro- Generation type ROCs per MWh
portionally among the generators who created Landfill gas 0.25
actual ROCs. Accordingly, for each ROC actually Sewage gas
presented, the renewable generators received 0.5
Cofiring of biomass
£34.30 plus £18.65 ($27.98) (i.e., an additional Onshore wind
36/64 times £34.30 less costs of the scheme) This Hydro
sum is in addition to the wholesale cost of power. Cofiring of energy crops
As the total cost to suppliers of the ROC scheme Energy from waste with CHP
was £876 million ($1,314 million), this implies Cofiring of biomass with 1.0
that consumers overpaid, relative to what was CHP
necessary to secure the renewable generation Geopressure
actually supplied, by at least the value of the Standard gasification
buyout revenue of around £315 million (36% of Standard pyrolysis
Offshore wind
£876 million [$1,314 million], or 1% of the total
Biomass
electricity expenditure of £30.7 billion [$46 bil- 1.5
Cofiring of energy crops
lion] in 2008) (DUKES 2009).12 Interestingly, the
with CHP
government collects the associated ROC pay-
Wave
ments on the generation contracted under NFFO Tidal stream
via the NFFO fund, which creates a surplus above Advanced gasification
the payments to generators under that program; Advanced pyrolysis
this surplus is estimated to be around £200 mil- Anaerobic digestion
lion ($300 million) per year (Tickell 2008). Energy crops
The RO scheme is curious for two reasons. Biomass with CHP
First, it relies on underdelivery to trigger the 2.0
Energy crops with CHP
maximum subsidy amount. If the target number Solar photovoltaic
of ROCs (or more) were presented, then the Geothermal
price would drop to zero. Second, in the case of Tidal impoundment—tidal
underdelivery, the maximum amount of subsidy is barrage
paid to those actually creating ROCs. Thus the Tidal impoundment—tidal
scheme assumes failure to meet the target and lagoon
ensures that a fixed total subsidy is paid, given this,
regardless of how few ROCs are created. Source: DECC 2009d](https://image.slidesharecdn.com/hrech13web-100914115702-phpapp01/85/Chapter-13-UK-Renewable-Energy-Policy-since-Privatization-9-320.jpg)
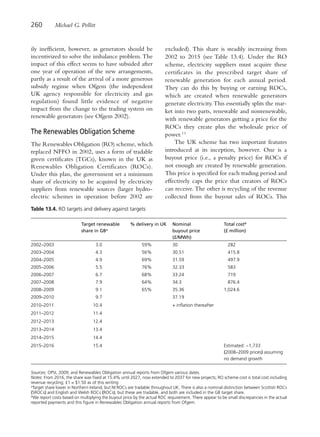
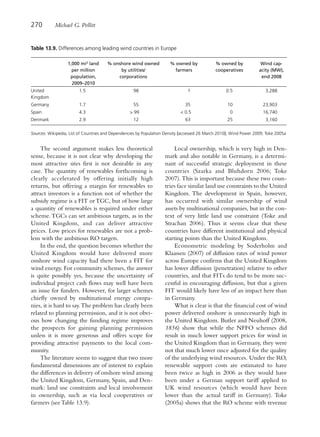
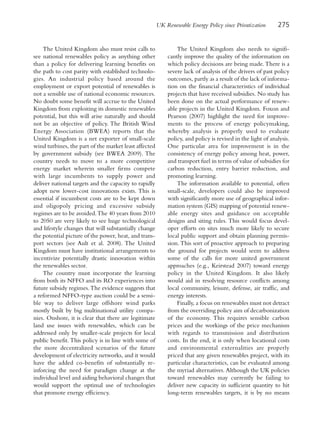
![262 Michael G. Pollitt
(2006) recommended the move to banding to Table 13.6. Financial support (£ million) for
recognize the different stages of development that renewables in the United Kingdom (nominal)
the technologies had reached, and hence the
higher learning benefits associated with increased R&D RO NFFO
funding to earlier-stage technologies. Oxera 1990–1991 14.7 6.1
(2005) points out the cost implications of allowing 1991–1992 17.1 11.7
NFFO plants to earn ROCs once their NFFO 1992–1993 16.1 28.9
contracts expired (around £620 million [$930 1993–1994 15.2 68.1
million]), giving those projects unexpected addi- 1994–1995 9.1 96.4
tional subsidy. Oxera calculated that as much as 1995–1996 9.1 94.5
half the payment via ROCs was in excess of that 1996–1997 6.2 112.8
required to ensure that the funded projects went
1997–1998 4.3 126.5
ahead, and that existing landfill gas projects did
1998–1999 3.3 127
not require any ROCs to be economically viable.
1999–2000 4.6 56.4
The scheme, as shown in the table, implies
that the subsidy to offshore wind could be 2000–2001 4.4 64.9
increased by £26.47 ($39.71) per MWh (50% of 2001–2002 6.1 54.7
the 2007–2008 ROC revenue) and to tidal by 2002–2003 10.5 282.0 -
£52.95 ($79.43) per MWh (100% of the 2007– 2003–2004 11.6 415.8 -
2008 ROC revenue). In the 2009 budget, off- 2004–2005 19.7 497.9 -
shore wind was subject to an emergency 2005–2007 36.6 583.0 -
rebanding provision, which saw the offshore wind 2006–2007 49.5 719.0 -
ROC band go to 2 for 2009–2010 and 1.75 for 2007–2008 41.6 876.4 -
2010–2011, now increased back to 2 from 2010–
Sources: UK government renewable R&D budget data from IEA
2014. 2009; Mitchell and Connor 2004, 1943
Policy Costs and Delivery port is up 47% in real terms from the figure esti-
under NFFO and RO mated by Wordsworth and Grubb (2003) of £1.3
billion ($1.95 million) in 2002–2003.13
Table 13.6 summarizes the financial commitments As the above discussion of the progress with
made under the NFFO and RO schemes, as well the RO scheme has made clear, the development
as a reference amount for the amount of public of electricity from renewables has been disap-
R&D expenditure reported to the International pointing in terms of overall cost relative to deliv-
Energy Agency (IEA). The increased significance ery, given the United Kingdom’s resource poten-
of the RO scheme is evident. tial and ambitious targets. Table 13.8 gives the fig-
While the RO scheme is the most significant ures in terms of total electricity generation. A
element of the United Kingdom’s expenditure on number of features stand out. First of all, electri-
renewables, it is not the only element. Table 13.7 city from biomass in 2008 is larger than that from
is a summary offered in a ministerial answer to a wind. Hydro remains significant within the UK
parliamentary select committee question. It is renewable portfolio. Connor (2003) reported esti-
noteworthy that significant additional amounts are mates from 2002 that suggested the United King-
still being spent by the taxpayer on supporting dom would meet only two-thirds of its target level
earlier-stage technologies outside the CO2 price by 2010. This still seems likely. However, the
and RO support mechanisms. However, the order striking thing about the 2002 estimates is that for
of magnitude of energy customer support for biomass, offshore wind, and hydro, they seem
renewables is of the order of £1.8 billion ($2.7 likely to be met or exceeded, though not by
billion) in 2008, in addition to £400 million onshore wind. The United Kingdom is failing to
($600 million) by the taxpayer. This level of sup- meet its projections for renewables as predicted,](https://image.slidesharecdn.com/hrech13web-100914115702-phpapp01/85/Chapter-13-UK-Renewable-Energy-Policy-since-Privatization-10-320.jpg)

![UK Renewable Energy Policy since Privatization 279
M. Grubb, T. Jamasb, and M. Pollitt. Cambridge, Junginger, M., T. Bolkesjo, D. Bradley, P. Dolzan, A.
UK: Cambridge University Press, 229–256. Faaij, J. Heinimö, B. Hektor, Ø. Leistad, E. Ling, M.
Hammond, G. P., S. Kallu, and M.C. McManus. 2008. Perry, E. Piacente, F. Rosillo-Calle, Y. Ryckmans,
Development of Biofuels for the UK Automotive P-P. Schouwenberg, B. Solberg, E. Trømborg, A. da
Market. Applied Energy 85 (6): 506–515. Silva Walter, and M. de Wit. 2008. Developments in
International Bioenergy Trade. Biomass and Bioenergy
Harvey, K. 1994. The Development of Combined Heat
32 (8): 717–729.
and Power in the UK. Energy Policy 22 (2): 179–181.
Kannan, R. 2009. Uncertainties in Key Low Carbon
Hedger, M. M. 1995. Wind Power: Challenges to Plan-
Power Generation Technologies: Implication for UK
ning Policy in the UK. Land Use Policy 12 (1): Decarbonisation Targets. Applied Energy 86 (10):
17–28. 1873–1886.
Helm, D. 2002. A Critique of Renewables Policy in the Keirstead, J. 2007. The UK Domestic Photovoltaics
UK. Energy Policy 30 (3): 185–188. Industry and the Role of Central Government.
Hill, A., and M. Hay. 2004. UK Renewables: Harness- Energy Policy 35 (4): 2268–2280.
ing Wind, Wave and Tide. Refocus 5 (2): 20–21. Kelly, G. 2007. Renewable Energy Strategies in Eng-
HM Treasury. 2009. Budget 2009 Building Britain’s land, Australia and New Zealand. Geoforum 38 (2):
Future. Economic and Fiscal Strategy Report and Finan- 326–338.
cial Statement and Budget Report. London: Stationery Klessmann, C., C. Nabe, and K. Burges. 2008. Pros and
Office. Cons of Exposing Renewables to Electricity Market
House of Lords. 2008. Economic Affairs—Fourth Risks: A Comparison of the Market Integration
Report. Chapter 6: Policy on Renewable Energy. Approaches in Germany, Spain, and the UK. Energy
www.publications.parliament.uk/pa/ld200708/ Policy 36 (10): 3646–3661.
ldselect/ldeconaf/195/19509.htm#a53 (accessed Lipp, J. 2007. Lessons for Effective Renewable Electri-
February 22, 2010). city Policy from Denmark, Germany and the United
Hull, A. 1995. Local Strategies for Renewable Energy: Kingdom. Energy Policy 35 (11): 5481–5495.
Policy Approaches in England and Wales. Land Use Lupton, M. 2008. Chasing the Dream [Micro-
Policy 12 (1): 7–16. generation Strategy]. Engineering & Technology
IEA (International Energy Agency). 2006. Energy Poli- (17509637) 3 (12): 54–57.
cies of IEA Countries: The United Kingdom: 2006 MacKay, D. 2008. Sustainable Energy—without the Hot
Review. Paris: OECD Publishing. Air. Cambridge: UIT.
———. 2009. Energy Technology RD&D Database. Mander, S. 2008. The Role of Discourse Coalitions in
wds.iea.org/WDS/ReportFolders/ Planning for Renewable Energy: A Case Study of
ReportFolders.aspx (accessed August 28, 2009). Wind-Energy Deployment. Environment and Plan-
Jacobsson, S., A. Bergek, D. Finon, V. Lauber, C. ning C: Government and Policy 26 (3): 583–600.
Mitchell, D. Toke, and A. Verbruggen. 2009. EU Marshall, E. 1993. CHP and Deregulation: The Regu-
Renewable Energy Support Policy: Faith or Facts? lator’s Viewpoint. Energy Policy 21 (1): 73–78.
Energy Policy 37 (6): 2143–2146. McGowan, F. 1991. Controlling the Greenhouse
Jamasb, T., H. Kiamil, and R. Nepal. 2008a. Hot Issue Effect:The Role of Renewables. Energy Policy 19 (2):
and Burning Options in Waste Management: A 110–118.
Social Cost Benefit Analysis of Waste-to-Energy in Meyer, N. I. 2003. European Schemes for Promoting
the UK. Cambridge Working Papers in Economics: Renewables in Liberalised Markets. Energy Policy 31
24–24. Cambridge, UK: University of Cambridge, (7): 665–676.
Faculty of Economics. Mitchell, C. 1995. Renewable Energy in the UK: Finan-
Jamasb, T., W. Nuttall, M. Pollitt, and A. Maratou. cing Options for the Future. London: Campaign for the
2008b. Technologies for a Low Carbon Electricity Protection of Rural England.
System: An Assessment of the UK’s Issues and ———. 2007. The Political Economy of Sustainable
Options. Delivering a Low Carbon Electricity System, Energy. Basingstoke, UK: Palgrave.
edited by M. Grubb, T. Jamasb, and M. Pollitt. Cam- Mitchell, C., D. Bauknecht, and P. M. Connor. 2006.
bridge, UK: Cambridge University Press, 64–99. Effectiveness through Risk Reduction: A Compari-
Jarvis, I. 1986. Can a successful city-wide CHP scheme son of the Renewable Obligation in England and
be launched in the UK?’, Energy Policy, 14 (2), 160– Wales and the Feed-In System in Germany. Energy
163. Policy 34 (3): 297–305.](https://image.slidesharecdn.com/hrech13web-100914115702-phpapp01/85/Chapter-13-UK-Renewable-Energy-Policy-since-Privatization-27-320.jpg)
![UK Renewable Energy Policy since Privatization 281
Porter, D., and N. Steen. 1996. Renewable Energy in a Operation and Development of the UK Electricity
Competitive Electricity Market. Renewable Energy 9 Systems. Electric Power Systems Research 77: 1214–
(1–4): 1120–1123. 1227.
QEP (Quarterly Energy Prices). 2009. Average Annual Swedish Energy Agency. No date. Swedish Energy
Domestic Electricity Bills by Home and Non-home Agency home page. www.swedishenergyagency.se
Supplier (QEP 2.2.1). Available at DECC n.d.a. (accessed February 22, 2010).
Riddell, R. 2008. Turning Tides [Tidal Power Technol- Swider, D. J., L. Beurskens, S. Davidson, J. Twidell, J.
ogy]. Engineering & Technology (17509637) 3 (16): Pyrko, W. Pruggler, H. Auer, K. Vertin, and R.
46–49.
Skema. 2008. Conditions and Costs for Renewables
Roberts, S., and F. Weightman. 1994. Cleaning Up the
Electricity Grid Connection: Examples in Europe.
World with Renewable Energy: From Possibilities to
Renewable Energy 8: 1832–1842.
Practicalities. Renewable Energy 5 (5–8): 1314–1321.
Szarka, J. 2006. Wind Power, Policy Learning and Para-
Rodrik, D. 2008. Second Best Institutions. American
digm Change. Energy Policy 34 (17): 3041–3048.
Economic Review 98 (2): 100–104.
Szarka, J., and I. Bluhdorn. 2006. Wind Power in Britain
SDC (Sustainable Development Commission). 2007.
and Germany: Explaining Contrasting Development
Turning the Tide: Tidal Power in the UK. London:
Paths. London: Anglo-German Foundation for the
SDC.
Study of Industry.
SKM (Sinclair Knight Merz). 2008. Growth Scenarios for
Taylor, G. 2008. Bioenergy for Heat and Electricity in
UK Renewables Generation and Implications for Future
the UK: A Research Atlas and Roadmap. Energy
Developments and Operation of Electricity Networks.
Policy 36 (12): 4383–4389.
London: BERR.
Slade, R., C. Panoutsou, and A. Bauen. 2009. Recon- Thomson, M., and D. G. Infield. 2007. Impact of
ciling Bio-energy Policy and Delivery in the UK: Widespread Photovoltaics Generation on Distribu-
Will UK Policy Initiatives Lead to Increased tion Systems. IET Renewable Power Generation 1 (1):
Deployment? Biomass and Bioenergy 33 (4): 679–688. 33–40.
Snyder, B., and M. J. Kaiser. 2009. A Comparison of Thornley, P. 2006. Increasing Biomass Based Power
Offshore Wind Power Development in Europe and Generation in the UK. Energy Policy 34 (15): 2087–
the U.S.: Patterns and Drivers of Development. 2099.
Applied Energy 86 (10): 1845–1856. Tickell, Oliver. 2008. Robbing Us of Renewables.
Soderholm, P., and G. Klaassen. 2007. Wind Power in Guardian, September 6.
Europe: A Simultaneous Innovation-Diffusion Toke, D. 2003. Wind Power in the UK: How Planning
Model. Environmental and Resource Economics 36 (2): Conditions and Financial Arrangements Affect Out-
163–190. comes. International Journal of Sustainable Energy 23
Stainforth, D., A. Cole, P. Dolley, H. Edwards, J. (4): 207–216.
Wilczek, and M. Wood. 1996. An Overview of the ———. 2005a. Are Green Electricity Certificates the
UK Department of Trade and Industry’s (DTI’s) Pro- Way Forward for Renewable Energy? An Evaluation
gramme in Solar Energy. Solar Energy 58 (1–3): 111– of the United Kingdom’s Renewables Obligation in
119. the Context of International Comparisons. Environ-
Stanford, A. 1998. Liberalisation of the UK Energy ment and Planning C: Government and Policy 23 (3):
Market: An Opportunity for Green Energy. Renew- 361–374.
able Energy 15 (1–4): 215–217. ———. 2005b. Explaining Wind Planning Outcomes.
Stenzel, T., and A. Frenzel. 2008. Regulating Techno- Some findings from a study in England and Wales.
logical Change: The Strategic Reactions of Utility Energy Policy 33 (12): 1527–1539.
Companies towards Subsidy Policies in the German, ———. 2007. Renewable Financial Support Systems
Spanish and UK Electricity Markets. Energy Policy 36 and Cost-Effectiveness. Journal of Cleaner Production
(7): 2645–2657. 15 (3): 280–287.
Strachan, P. A., and D. Lal. 2004. Wind Energy Policy, Toke, D., and V. Lauber. 2007. Anglo-Saxon and Ger-
Planning and Management Practice in the UK: Hot man Approaches to Neoliberalism and Environmen-
Air or a Gathering Storm? Regional Studies 38 (5): tal Policy: The Case of Financing Renewable
549–569. Energy. Geoforum 38 (4): 677–687.
Strbac, G., A. Shakoor, M. Black, D. Pudjianto, and T. Toke, D., and P. A. Strachan. 2006. Ecological Mod-
Bopp. 2007. Impact of Wind Generation on the ernization and Wind Power in the UK. European](https://image.slidesharecdn.com/hrech13web-100914115702-phpapp01/85/Chapter-13-UK-Renewable-Energy-Policy-since-Privatization-29-320.jpg)

The document summarizes the progress of renewable energy policy in the UK since privatization in 1990. It finds that while the UK has considerable potential for renewable energy, it has failed to realize this potential relative to other European countries. The document examines reasons for this failure and proposes policy changes that could better support renewable energy growth given the UK's decarbonization targets and resources. Key points: - The UK has ambitious decarbonization and renewable energy targets but is expected to miss these nationally, likely relying on purchasing offsets from abroad. - The UK privatized its power industry in 1990, lowering coal use and unintentionally aiding decarbonization, but setting a favorable baseline for emissions targets.


