Download to read offline

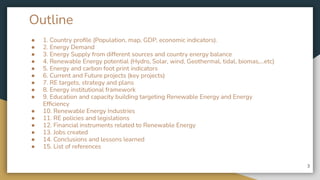


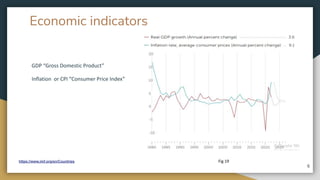


Analysis of Renewable Energy Potential for the UK. This presentation was prepared as part of my Masters degree in the REMENA program (dual degree from Kassel University & Cairo university). The following outline Country profile (Population, map, GDP, economic indicators). ● 2. Energy Demand ● 3. Energy Supply from different sources and country energy balance ● 4. Renewable Energy potential (Hydro, Solar, wind, Geothermal, tidal, biomas,...etc) ● 5. Energy and carbon foot print indicators ● 6. Current and Future projects (key projects) ● 7. RE targets, strategy and plans ● 8. Energy institutional framework ● 9. Education and capacity building targeting Renewable Energy and Energy Efficiency ● 10. Renewable Energy Industries ● 11. RE policies and legislations ● 12. Financial instruments related to Renewable Energy ● 13. Jobs created ● 14. Conclusions and lessons learned


