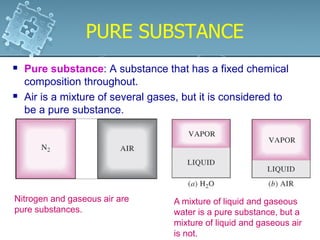
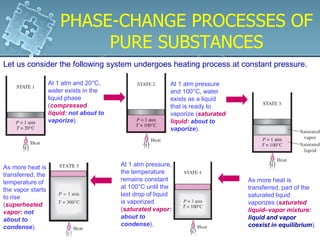
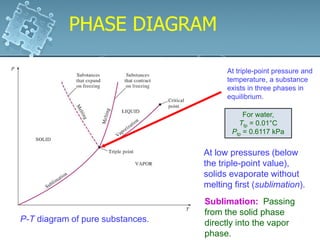
1. The chapter discusses the properties of pure substances and how they exist in different phases - solid, liquid, gas - depending on temperature and pressure conditions.
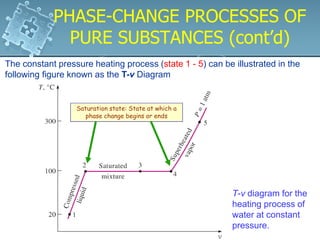
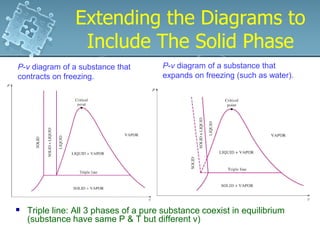
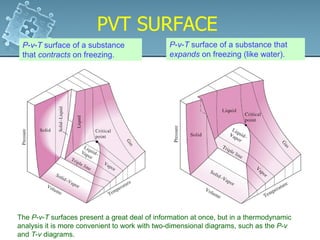
2. Phase change processes like vaporization, melting and sublimation occur at characteristic saturation temperatures and pressures and can be illustrated using pressure-volume-temperature diagrams.
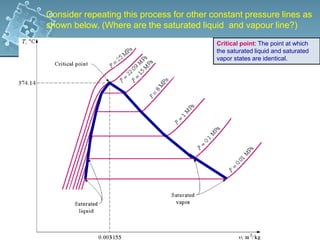
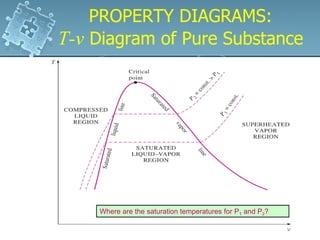
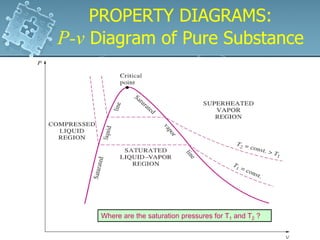
3. The diagrams show the relationship between pressure, volume and temperature for different phases of a pure substance, including saturation lines and the critical point where liquid and gas phases become indistinguishable.