This document provides an overview of international trade concepts including:
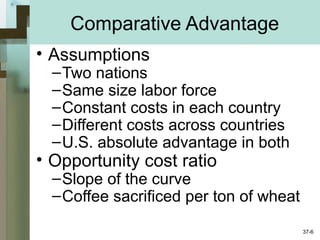
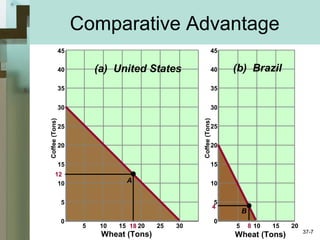
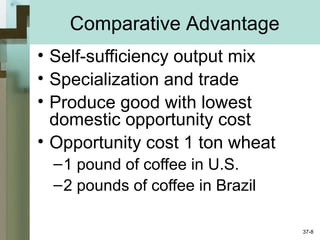
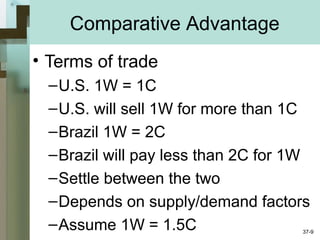
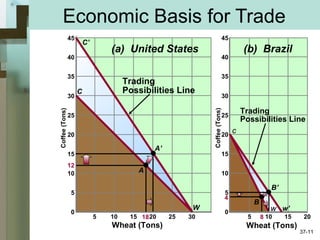
- Comparative advantage allows nations to specialize and gain from trade by producing goods where they have a lower opportunity cost.
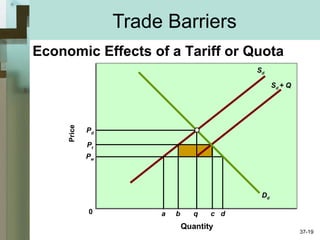
- Tariffs and quotas create inefficiencies by raising domestic prices and reducing trade quantities from free trade levels.
- Arguments for protectionism include infant industries needing support and unfair foreign competition, but protection reduces overall economic welfare.