Here are the answers:
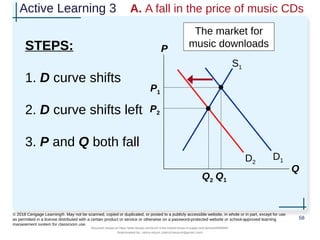
A. The demand curve shifts right - iPods and music downloads are complements, so a lower iPod price increases demand for downloads.
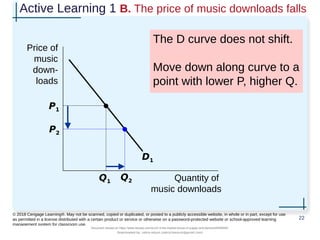
B. The demand curve shifts left and downward - a lower price for the good directly increases the quantity demanded at each price according to the law of demand.
C. The demand curve shifts left - CDs and downloads are substitutes, so a higher CD price increases demand for the substitute good, downloads.
The key is understanding whether the related goods are substitutes or complements and how their price changes would affect demand. A lower (higher) price for a substitute good increases (decreases) demand, while for complements the impact is