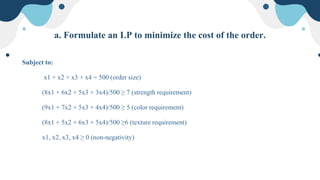
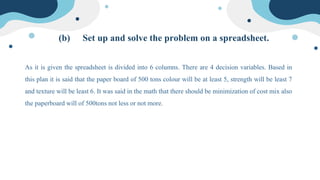
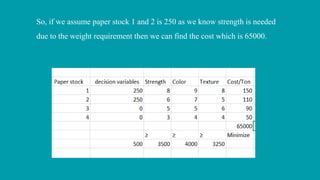
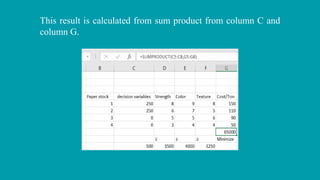
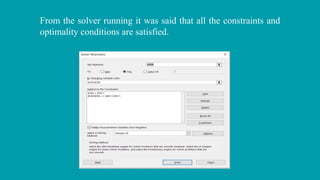
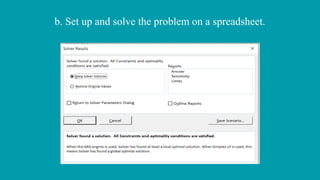
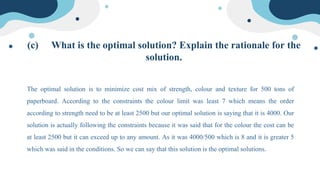
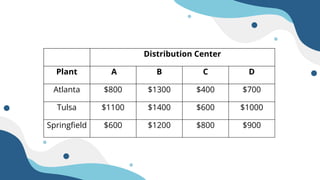
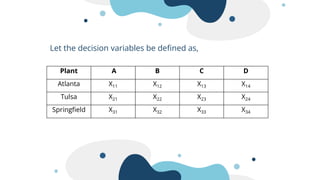
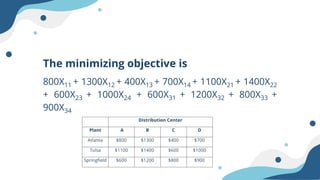
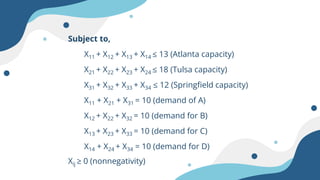
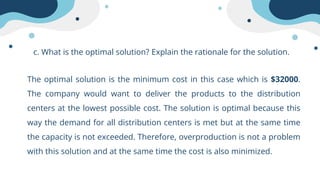
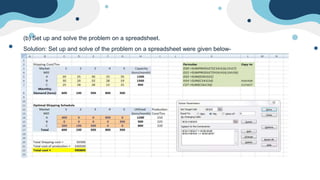
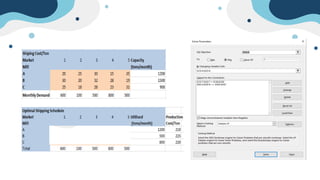
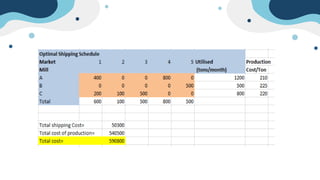
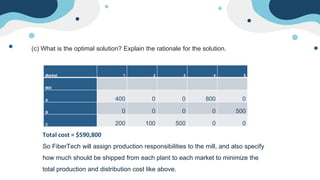
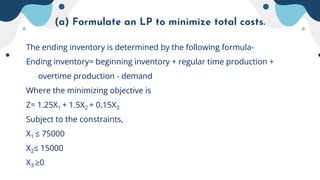
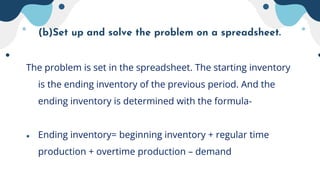
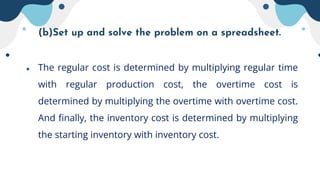
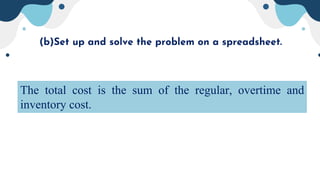
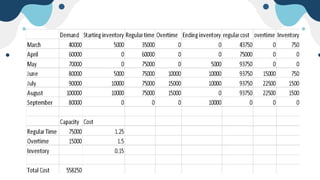
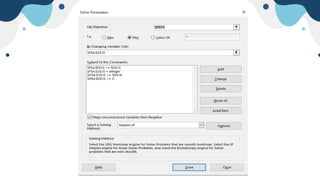
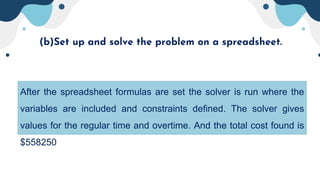
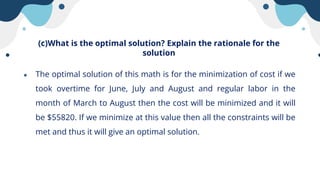
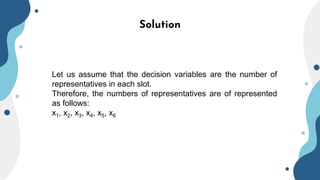
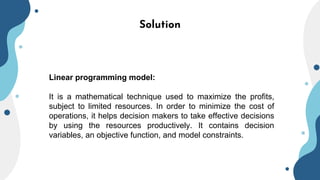
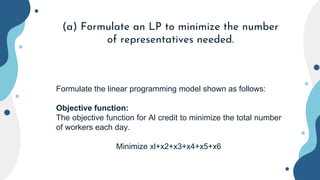
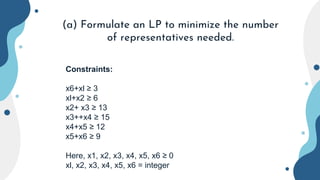
Chapter-7
Linear Optimization
Problem-2
Montana Pulp (MP) produces recycled paperboard by combining 4 grades of recycled
paper stock. Each grade of stock has a different strength, color, and texture. The
strength, color, and texture of the finished paperboard are a weighted average of those
characteristics of the paper stock inputs. The table provides the characteristics of the
paper inputs and their costs per ton. An order for 500 tons of paperboard with a strength
of at least 7, a color of at least 5, and a texture of at least 6 has been received. MP needs
to find the minimal-cost mix of inputs required to satisfy this order.
a. Formulate an LP to minimize the cost of the order.
Let, the decision variables are
x1 = tons of paper stock 1 to use
x2 = tons of paper stock 2 to use
x3 = tons of paper stock 3 to use
x4 = tons of paper stock 4 to use
The objective function is,
Minimize: 150x1 + 110x2 + 90x3 + 50x4
Problem-2
Paper Stock Strength Color Texture Cost/Ton
1 8 9 8 $150
2 6 7 5 $110
3 5 5 6 $90
4 3 4 5 $50
a. Formulate an LP to minimize the cost of the order.
Subject to:
x1 + x2 + x3 + x4 = 500 (order size)
(8x1 + 6x2 + 5x3 + 3x4)/500 ≥ 7 (strength requirement)
(9x1 + 7x2 + 5x3 + 4x4)/500 ≥ 5 (color requirement)
(8x1 + 5x2 + 6x3 + 5x4)/500 ≥6 (texture requirement)
x1, x2, x3, x4 ≥ 0 (non-negativity)
(b) Set up and solve the problem on a spreadsheet.
As it is given the spreadsheet is divided into 6 columns. There are 4 decision variables. Based in
this plan it is said that the paper board of 500 tons colour will be at least 5, strength will be least 7
and texture will be least 6. It was said in the math that there should be minimization of cost mix also
the paperboard will of 500tons not less or not more.
So, if we assume paper stock 1 and 2 is 250 as we know strength is needed
due to the weight requirement then we can find the cost which is 65000.
This result is calculated from sum product from column C and
column G.
From the solver running it was said that all the constraints and
optimality conditions are satisfied.
b. Set up and solve the problem on a spreadsheet.
(c) What is the optimal solution? Explain the rationale for the
solution.
The optimal solution is to minimize cost mix of strength, colour and texture for 500 tons of
paperboard. According to the constraints the colour limit was least 7 which means the order
according to strength need to be at least 2500 but our optimal solution is saying that it is 4000. Our
solution is actually following the constraints because it was said that for the colour the cost can be
at least 2500 but it can exceed up to any amount. As it was 4000/500 which is 8 and it is greater 5
which was said in the conditions. So we can say that this solution is the optimal solutions.
Problem-3
A company has 3 manufacturing plants (in Atlanta, Tulsa, and Springfield)
that produce a product that is then shipped to 1 of 4 distribution centers.
The 3 plants can produce 13, 18, and 12 truckloads of product each week,
respectively. Each distribution center needs 10 truckloads of product each
week. The shipping costs per truckload between the plants and
distribution centers are given in the table. The company needs to
determine how much to ship from each plant to each distribution center,
and would like to minimize total shipping costs.
Distribution Center
Plant A B C D
Atlanta $800 $1300 $400 $700
Tulsa $1100 $1400 $600 $1000
Springfield $600 $1200 $800 $900
a. Formulate an LP to minimize the total shipping costs.
Let the decision variables be defined as,
Plant A B C D
Atlanta X11 X12 X13 X14
Tulsa X21 X22 X23 X24
Springfield X31 X32 X33 X34
The minimizing objective is
800X11 + 1300X12 + 400X13 + 700X14 + 1100X21 + 1400X22
+ 600X23 + 1000X24 + 600X31 + 1200X32 + 800X33 +
900X34
Subject to,
X11 + X12 + X13 + X14 ≤ 13 (Atlanta capacity)
X21 + X22 + X23 + X24 ≤ 18 (Tulsa capacity)
X31 + X32 + X33 + X34 ≤ 12 (Springfield capacity)
X11 + X21 + X31 = 10 (demand of A)
X12 + X22 + X32 = 10 (demand for B)
X13 + X23 + X33 = 10 (demand for C)
X14 + X24 + X34 = 10 (demand for D)
Xij ≥ 0 (nonnegativity)
b. Set up and solve the problem on a spreadsheet.
Unit Transportation Costs and Estimates
Distribution Centers
Plant A B C D Capacity
Atlanta 800 1300 400 700 13
Tulsa 1100 1400 600 1000 18
Springfield 600 1200 800 900 12
Demand 10 10 10 10
Transportation Plan
Plant Distribution Centers Shipped
Atlanta 0 0 3 10 13
Tulsa 0 8 7 0 15
Springfield 10 2 0 0 12
Received 10 10 10 10
Transportation Costs
Distribution Centers
Plant A B C D Outbound
Atlanta 0 0 1200 7000 8200
Tulsa 0 11200 4200 0 15400
Springfield 6000 2400 0 0 8400
Inbound 6000 13600 5400 7000
Minimum cost 32000
constraints
supply Atlanta 13 ≤ 13
Tulsa 15 ≤ 18
Springfield 12 ≤ 12
demand A 10 10
B 10 10
C 10 10
D 10 10
When the solver is run the following result is obtained:
c. What is the optimal solution? Explain the rationale for the solution.
The optimal solution is the minimum cost in this case which is $32000.
The company would want to deliver the products to the distribution
centers at the lowest possible cost. The solution is optimal because this
way the demand for all distribution centers is met but at the same time
the capacity is not exceeded. Therefore, overproduction is not a problem
with this solution and at the same time the cost is also minimized.
Problem 04
FiberTech makes newsprint for newspapers at 3 mills, A, B, and C. The cost of
producing newsprint is estimated to be $210 at mill A, $225 at B, and $220 at C.
Five primary geographical markets are served from these mills. The monthly
demand at each market, the shipping cost (per ton) between each mill and
market, and the monthly production capacity of each mill are given in the table.
Mill 1 2 3 4 5
Capacity
(tons/mont
h)
Shipping A $20 $25 $30 $15 $35 1200
Cost/Ton B $30 $20 $32 $28 $19 1500
C $25 $18 $28 $23 $31 900
Monthly 600 100 500 800 500
Demand
(tons)
FiberTech would like to assign production responsibilities to the mills, and also specify
how much should be shipped from each plant to each market, so as to minimize total
production and distribution costs.
(a) Formulate an LP to minimize total production and distribution costs.
(b) Set up and solve the problem on a spreadsheet.
(c) What is the optimal solution? Explain the rationale for the solution.
Solution
(a) Formulate an LP to minimize total production and distribution costs.
Solution: Formulation Objective function:
Minimize Z = ∑Xij*cij, where Xij is the qty shipped from mill i to market j,
i = A,B,C.
j= 1,2,3,4,5.
Cij is the shipping cost from mill i to market j
s.t. Constraints:
∑Xij ≤ bi , for each i, where bi is the capacity of mill i, i = A,B,C ∑Xij = Dj, for
each j, where Dj is the demand of market j, j = 1,2,3,4,5 Xij ≥ 0
(b) Set up and solve the problem on a spreadsheet.
Solution: Set up and solve of the problem on a spreadsheet were given below-
(c) What is the optimal solution? Explain the rationale for the solution.
Market 1 2 3 4 5
Mill
A 400 0 0 800 0
B 0 0 0 0 500
C 200 100 500 0 0
Total cost = $590,800
So FiberTech will assign production responsibilities to the mill, and also specify
how much should be shipped from each plant to each market to minimize the
total production and distribution cost like above.
Problem 5
● Northwest Pipe (NP) makes water pipe. NP is planning
production for the next 7 months, March through
September. The forecast demands (in thousands of feet)
are, respectively, 40, 60, 70, 80, 90, 100, and 80. NP can
make 75,000 feet of pipe per month using regular time
production, at a cost of $1.25 per foot. They can make up to
an additional 15,000 feet using overtime production at a
cost of $1.50 per foot.
Problem 5
● Any pipe made in one month and sold in a later
month incurs an inventory holding cost of $0.15 per
foot, per month. NP expects to end February with
5000 feet of pipe, and would like to plan to end
September with 10,000 feet in inventory. NP would
like to plan their production schedule to minimize
total cost during the next 7 months.
(a) Formulate an LP to minimize total costs.
According to the problem, the production capacity of Northwest pipe is 75000 and cost
is $1.25 per feet. And overtime production capacity is 15000 at a cost of $1.5 per
feet. The cost of holding per foot of pipe per month in the inventory is $0.15. The
ending inventory in February was 5000 and the forecasted ending inventory in
September is 10000.
The decision variables can be defined as,
X1 = regular time production
X2 = overtime production time
X3= inventory
(a) Formulate an LP to minimize total costs.
The ending inventory is determined by the following formula-
Ending inventory= beginning inventory + regular time production +
overtime production - demand
Where the minimizing objective is
Z= 1.25X1 + 1.5X2 + 0.15X3
Subject to the constraints,
X1 ≤ 75000
X2≤ 15000
X3 ≥0
(b)Set up and solve the problem on a spreadsheet.
The problem is set in the spreadsheet. The starting inventory
is the ending inventory of the previous period. And the
ending inventory is determined with the formula-
● Ending inventory= beginning inventory + regular time
production + overtime production – demand
(b)Set up and solve the problem on a spreadsheet.
● The regular cost is determined by multiplying regular time
with regular production cost, the overtime cost is
determined by multiplying the overtime with overtime cost.
And finally, the inventory cost is determined by multiplying
the starting inventory with inventory cost.
(b)Set up and solve the problem on a spreadsheet.
The total cost is the sum of the regular, overtime and
inventory cost.
(b)Set up and solve the problem on a spreadsheet.
After the spreadsheet formulas are set the solver is run where the
variables are included and constraints defined. The solver gives
values for the regular time and overtime. And the total cost found is
$558250
(c)What is the optimal solution? Explain the rationale for the
solution
● The optimal solution of this math is for the minimization of cost if we
took overtime for June, July and August and regular labor in the
month of March to August then the cost will be minimized and it will
be $55820. If we minimize at this value then all the constraints will be
met and thus it will give an optimal solution.
Problem 6
A1 Credit provides credit information to its customers throughout the
country, 24 hours per day. Credit representatives answer customer
calls and provide information. Based on demand patterns, the
estimated number of representatives needed during 4-hour time
periods of each day are shown in the table.
Problem 6
Time Period Number Representatives
Needed
12am to 4am 3
4am to 8am 6
8am to 12pm 13
12pm to 4pm 15
4pm to 8pm 12
8pm to 12am 9
Problem 6
Employees work shifts of 8 consecutive hours, and shifts can
start at the beginning of any of the 6 periods shown in the table.
Assume this schedule will be repeated day after day, so that
someone starting at 8 PM will contribute to the need for
representatives in the Midnight-4 AM time period. The supervisor
has been instructed to schedule employees so that all demands
can be met with a minimum possible number of employees.
Solution
Given,
A1 Credit provides credit information to its customers
throughout the country, 24 hours per day. The estimated
number of representatives needed during 4-hour time periods
of each day is considered to be constants.
Solution
Let us assume that the decision variables are the number of
representatives in each slot.
Therefore, the numbers of representatives are of represented
as follows:
x1, x2, x3, x4, x5, x6
Solution
Linear programming model:
It is a mathematical technique used to maximize the profits,
subject to limited resources. In order to minimize the cost of
operations, it helps decision makers to take effective decisions
by using the resources productively. It contains decision
variables, an objective function, and model constraints.
(a) Formulate an LP to minimize the number
of representatives needed.
Formulate the linear programming model shown as follows:
Objective function:
The objective function for Al credit to minimize the total number
of workers each day.
Minimize xl+x2+x3+x4+x5+x6
(a) Formulate an LP to minimize the number
of representatives needed.
Constraints:
x6+xl ≥ 3
xl+x2 ≥ 6
x2+ x3 ≥ 13
x3++x4 ≥ 15
x4+x5 ≥ 12
x5+x6 ≥ 9
Here, x1, x2, x3, x4, x5, x6 ≥ 0
xl, x2, x3, x4, x5, x6 = integer
(b) Set up and solve the problem on a
spreadsheet.
(c) What is the optimal solution? Explain the
rationale for the solution.
30 numbers of representatives will let the organization to
operate at minimum set of employees at different work time.
This is the optimal solution. Previously it was 58 numbers of
representatives.

Ch 7.pptx Linear Optimization for Finance

  • 1.
  • 2.
    Problem-2 Montana Pulp (MP)produces recycled paperboard by combining 4 grades of recycled paper stock. Each grade of stock has a different strength, color, and texture. The strength, color, and texture of the finished paperboard are a weighted average of those characteristics of the paper stock inputs. The table provides the characteristics of the paper inputs and their costs per ton. An order for 500 tons of paperboard with a strength of at least 7, a color of at least 5, and a texture of at least 6 has been received. MP needs to find the minimal-cost mix of inputs required to satisfy this order.
  • 3.
    a. Formulate anLP to minimize the cost of the order. Let, the decision variables are x1 = tons of paper stock 1 to use x2 = tons of paper stock 2 to use x3 = tons of paper stock 3 to use x4 = tons of paper stock 4 to use The objective function is, Minimize: 150x1 + 110x2 + 90x3 + 50x4
  • 4.
    Problem-2 Paper Stock StrengthColor Texture Cost/Ton 1 8 9 8 $150 2 6 7 5 $110 3 5 5 6 $90 4 3 4 5 $50
  • 5.
    a. Formulate anLP to minimize the cost of the order. Subject to: x1 + x2 + x3 + x4 = 500 (order size) (8x1 + 6x2 + 5x3 + 3x4)/500 ≥ 7 (strength requirement) (9x1 + 7x2 + 5x3 + 4x4)/500 ≥ 5 (color requirement) (8x1 + 5x2 + 6x3 + 5x4)/500 ≥6 (texture requirement) x1, x2, x3, x4 ≥ 0 (non-negativity)
  • 6.
    (b) Set upand solve the problem on a spreadsheet. As it is given the spreadsheet is divided into 6 columns. There are 4 decision variables. Based in this plan it is said that the paper board of 500 tons colour will be at least 5, strength will be least 7 and texture will be least 6. It was said in the math that there should be minimization of cost mix also the paperboard will of 500tons not less or not more.
  • 7.
    So, if weassume paper stock 1 and 2 is 250 as we know strength is needed due to the weight requirement then we can find the cost which is 65000.
  • 8.
    This result iscalculated from sum product from column C and column G.
  • 9.
    From the solverrunning it was said that all the constraints and optimality conditions are satisfied.
  • 10.
    b. Set upand solve the problem on a spreadsheet.
  • 11.
    (c) What isthe optimal solution? Explain the rationale for the solution. The optimal solution is to minimize cost mix of strength, colour and texture for 500 tons of paperboard. According to the constraints the colour limit was least 7 which means the order according to strength need to be at least 2500 but our optimal solution is saying that it is 4000. Our solution is actually following the constraints because it was said that for the colour the cost can be at least 2500 but it can exceed up to any amount. As it was 4000/500 which is 8 and it is greater 5 which was said in the conditions. So we can say that this solution is the optimal solutions.
  • 12.
    Problem-3 A company has3 manufacturing plants (in Atlanta, Tulsa, and Springfield) that produce a product that is then shipped to 1 of 4 distribution centers. The 3 plants can produce 13, 18, and 12 truckloads of product each week, respectively. Each distribution center needs 10 truckloads of product each week. The shipping costs per truckload between the plants and distribution centers are given in the table. The company needs to determine how much to ship from each plant to each distribution center, and would like to minimize total shipping costs.
  • 13.
    Distribution Center Plant AB C D Atlanta $800 $1300 $400 $700 Tulsa $1100 $1400 $600 $1000 Springfield $600 $1200 $800 $900
  • 14.
    a. Formulate anLP to minimize the total shipping costs.
  • 15.
    Let the decisionvariables be defined as, Plant A B C D Atlanta X11 X12 X13 X14 Tulsa X21 X22 X23 X24 Springfield X31 X32 X33 X34
  • 16.
    The minimizing objectiveis 800X11 + 1300X12 + 400X13 + 700X14 + 1100X21 + 1400X22 + 600X23 + 1000X24 + 600X31 + 1200X32 + 800X33 + 900X34
  • 17.
    Subject to, X11 +X12 + X13 + X14 ≤ 13 (Atlanta capacity) X21 + X22 + X23 + X24 ≤ 18 (Tulsa capacity) X31 + X32 + X33 + X34 ≤ 12 (Springfield capacity) X11 + X21 + X31 = 10 (demand of A) X12 + X22 + X32 = 10 (demand for B) X13 + X23 + X33 = 10 (demand for C) X14 + X24 + X34 = 10 (demand for D) Xij ≥ 0 (nonnegativity)
  • 18.
    b. Set upand solve the problem on a spreadsheet.
  • 19.
    Unit Transportation Costsand Estimates Distribution Centers Plant A B C D Capacity Atlanta 800 1300 400 700 13 Tulsa 1100 1400 600 1000 18 Springfield 600 1200 800 900 12 Demand 10 10 10 10 Transportation Plan Plant Distribution Centers Shipped Atlanta 0 0 3 10 13 Tulsa 0 8 7 0 15 Springfield 10 2 0 0 12 Received 10 10 10 10 Transportation Costs Distribution Centers Plant A B C D Outbound Atlanta 0 0 1200 7000 8200 Tulsa 0 11200 4200 0 15400 Springfield 6000 2400 0 0 8400 Inbound 6000 13600 5400 7000 Minimum cost 32000
  • 20.
    constraints supply Atlanta 13≤ 13 Tulsa 15 ≤ 18 Springfield 12 ≤ 12 demand A 10 10 B 10 10 C 10 10 D 10 10
  • 21.
    When the solveris run the following result is obtained:
  • 22.
    c. What isthe optimal solution? Explain the rationale for the solution. The optimal solution is the minimum cost in this case which is $32000. The company would want to deliver the products to the distribution centers at the lowest possible cost. The solution is optimal because this way the demand for all distribution centers is met but at the same time the capacity is not exceeded. Therefore, overproduction is not a problem with this solution and at the same time the cost is also minimized.
  • 23.
    Problem 04 FiberTech makesnewsprint for newspapers at 3 mills, A, B, and C. The cost of producing newsprint is estimated to be $210 at mill A, $225 at B, and $220 at C. Five primary geographical markets are served from these mills. The monthly demand at each market, the shipping cost (per ton) between each mill and market, and the monthly production capacity of each mill are given in the table.
  • 24.
    Mill 1 23 4 5 Capacity (tons/mont h) Shipping A $20 $25 $30 $15 $35 1200 Cost/Ton B $30 $20 $32 $28 $19 1500 C $25 $18 $28 $23 $31 900 Monthly 600 100 500 800 500 Demand (tons)
  • 25.
    FiberTech would liketo assign production responsibilities to the mills, and also specify how much should be shipped from each plant to each market, so as to minimize total production and distribution costs. (a) Formulate an LP to minimize total production and distribution costs. (b) Set up and solve the problem on a spreadsheet. (c) What is the optimal solution? Explain the rationale for the solution.
  • 26.
    Solution (a) Formulate anLP to minimize total production and distribution costs. Solution: Formulation Objective function: Minimize Z = ∑Xij*cij, where Xij is the qty shipped from mill i to market j, i = A,B,C. j= 1,2,3,4,5. Cij is the shipping cost from mill i to market j
  • 27.
    s.t. Constraints: ∑Xij ≤bi , for each i, where bi is the capacity of mill i, i = A,B,C ∑Xij = Dj, for each j, where Dj is the demand of market j, j = 1,2,3,4,5 Xij ≥ 0
  • 28.
    (b) Set upand solve the problem on a spreadsheet. Solution: Set up and solve of the problem on a spreadsheet were given below-
  • 32.
    (c) What isthe optimal solution? Explain the rationale for the solution. Market 1 2 3 4 5 Mill A 400 0 0 800 0 B 0 0 0 0 500 C 200 100 500 0 0 Total cost = $590,800 So FiberTech will assign production responsibilities to the mill, and also specify how much should be shipped from each plant to each market to minimize the total production and distribution cost like above.
  • 33.
    Problem 5 ● NorthwestPipe (NP) makes water pipe. NP is planning production for the next 7 months, March through September. The forecast demands (in thousands of feet) are, respectively, 40, 60, 70, 80, 90, 100, and 80. NP can make 75,000 feet of pipe per month using regular time production, at a cost of $1.25 per foot. They can make up to an additional 15,000 feet using overtime production at a cost of $1.50 per foot.
  • 34.
    Problem 5 ● Anypipe made in one month and sold in a later month incurs an inventory holding cost of $0.15 per foot, per month. NP expects to end February with 5000 feet of pipe, and would like to plan to end September with 10,000 feet in inventory. NP would like to plan their production schedule to minimize total cost during the next 7 months.
  • 35.
    (a) Formulate anLP to minimize total costs. According to the problem, the production capacity of Northwest pipe is 75000 and cost is $1.25 per feet. And overtime production capacity is 15000 at a cost of $1.5 per feet. The cost of holding per foot of pipe per month in the inventory is $0.15. The ending inventory in February was 5000 and the forecasted ending inventory in September is 10000. The decision variables can be defined as, X1 = regular time production X2 = overtime production time X3= inventory
  • 36.
    (a) Formulate anLP to minimize total costs. The ending inventory is determined by the following formula- Ending inventory= beginning inventory + regular time production + overtime production - demand Where the minimizing objective is Z= 1.25X1 + 1.5X2 + 0.15X3 Subject to the constraints, X1 ≤ 75000 X2≤ 15000 X3 ≥0
  • 37.
    (b)Set up andsolve the problem on a spreadsheet. The problem is set in the spreadsheet. The starting inventory is the ending inventory of the previous period. And the ending inventory is determined with the formula- ● Ending inventory= beginning inventory + regular time production + overtime production – demand
  • 38.
    (b)Set up andsolve the problem on a spreadsheet. ● The regular cost is determined by multiplying regular time with regular production cost, the overtime cost is determined by multiplying the overtime with overtime cost. And finally, the inventory cost is determined by multiplying the starting inventory with inventory cost.
  • 39.
    (b)Set up andsolve the problem on a spreadsheet. The total cost is the sum of the regular, overtime and inventory cost.
  • 43.
    (b)Set up andsolve the problem on a spreadsheet. After the spreadsheet formulas are set the solver is run where the variables are included and constraints defined. The solver gives values for the regular time and overtime. And the total cost found is $558250
  • 44.
    (c)What is theoptimal solution? Explain the rationale for the solution ● The optimal solution of this math is for the minimization of cost if we took overtime for June, July and August and regular labor in the month of March to August then the cost will be minimized and it will be $55820. If we minimize at this value then all the constraints will be met and thus it will give an optimal solution.
  • 45.
    Problem 6 A1 Creditprovides credit information to its customers throughout the country, 24 hours per day. Credit representatives answer customer calls and provide information. Based on demand patterns, the estimated number of representatives needed during 4-hour time periods of each day are shown in the table.
  • 46.
    Problem 6 Time PeriodNumber Representatives Needed 12am to 4am 3 4am to 8am 6 8am to 12pm 13 12pm to 4pm 15 4pm to 8pm 12 8pm to 12am 9
  • 47.
    Problem 6 Employees workshifts of 8 consecutive hours, and shifts can start at the beginning of any of the 6 periods shown in the table. Assume this schedule will be repeated day after day, so that someone starting at 8 PM will contribute to the need for representatives in the Midnight-4 AM time period. The supervisor has been instructed to schedule employees so that all demands can be met with a minimum possible number of employees.
  • 48.
    Solution Given, A1 Credit providescredit information to its customers throughout the country, 24 hours per day. The estimated number of representatives needed during 4-hour time periods of each day is considered to be constants.
  • 49.
    Solution Let us assumethat the decision variables are the number of representatives in each slot. Therefore, the numbers of representatives are of represented as follows: x1, x2, x3, x4, x5, x6
  • 50.
    Solution Linear programming model: Itis a mathematical technique used to maximize the profits, subject to limited resources. In order to minimize the cost of operations, it helps decision makers to take effective decisions by using the resources productively. It contains decision variables, an objective function, and model constraints.
  • 51.
    (a) Formulate anLP to minimize the number of representatives needed. Formulate the linear programming model shown as follows: Objective function: The objective function for Al credit to minimize the total number of workers each day. Minimize xl+x2+x3+x4+x5+x6
  • 52.
    (a) Formulate anLP to minimize the number of representatives needed. Constraints: x6+xl ≥ 3 xl+x2 ≥ 6 x2+ x3 ≥ 13 x3++x4 ≥ 15 x4+x5 ≥ 12 x5+x6 ≥ 9 Here, x1, x2, x3, x4, x5, x6 ≥ 0 xl, x2, x3, x4, x5, x6 = integer
  • 53.
    (b) Set upand solve the problem on a spreadsheet.
  • 54.
    (c) What isthe optimal solution? Explain the rationale for the solution. 30 numbers of representatives will let the organization to operate at minimum set of employees at different work time. This is the optimal solution. Previously it was 58 numbers of representatives.