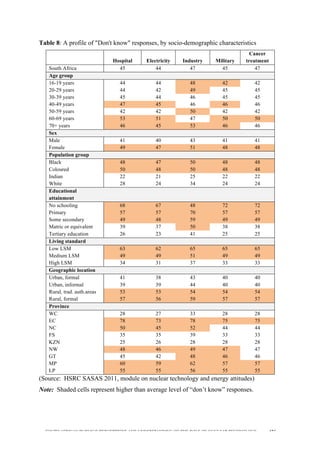
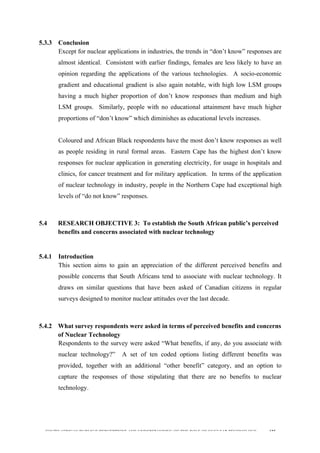
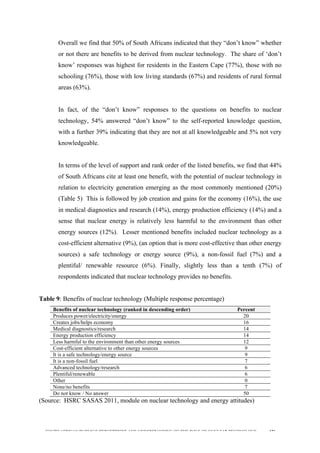
This document is a research report submitted to the University of South Africa in partial fulfillment of a Masters degree in Business Administration. The report examines public perceptions and understanding of the role of nuclear technology in South Africa. It includes 8 research objectives aimed at determining the South African public's knowledge of and views on nuclear energy. The report provides background on the global and South African nuclear industries and regulatory frameworks. It also presents a literature review related to each research objective and a discussion of the research methodology used, which involved a survey to collect data on public perceptions. The results and discussion chapter analyzes the survey findings for each research objective. In conclusion, the report summarizes the key findings and their implications.

![SOUTH AFRICAN PUBLIC’S PERCEPTIONS AND UNDERSTANDING OF THE ROLE OF NUCLEAR TECHNOLOGY 104
Refer to Appendix A: The Questionnaire.
2011 SASAS module on nuclear energy]
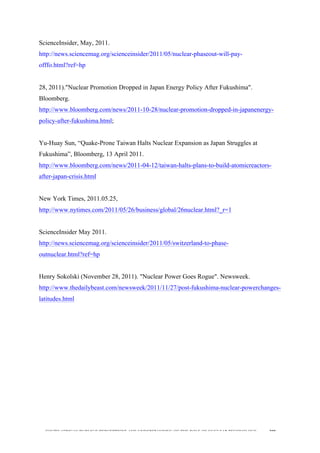
Research sample:
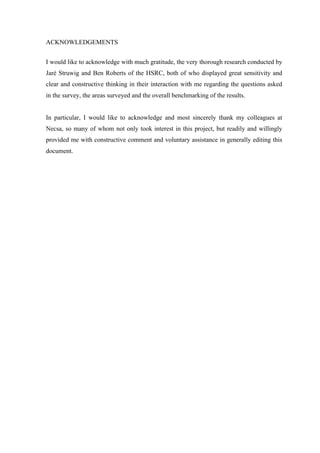
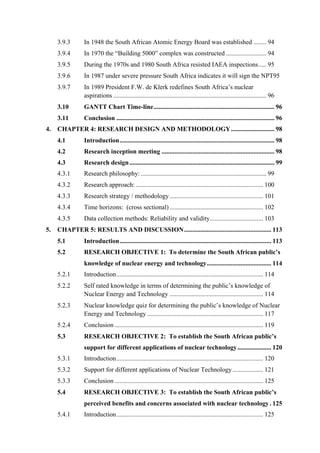
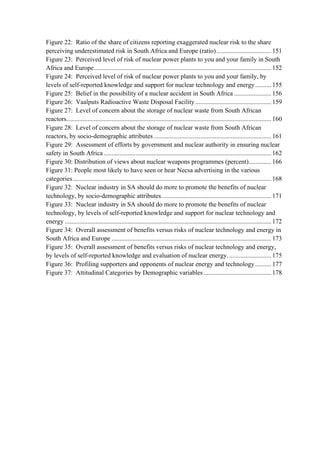
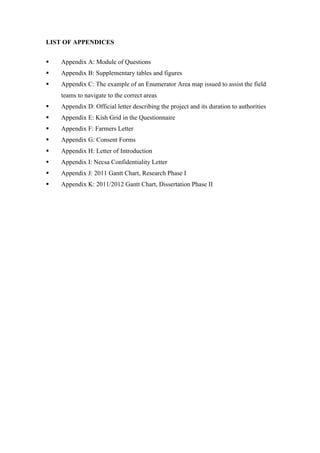
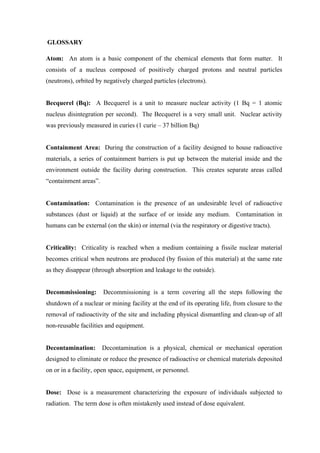
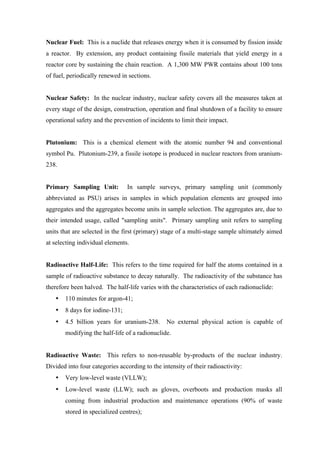
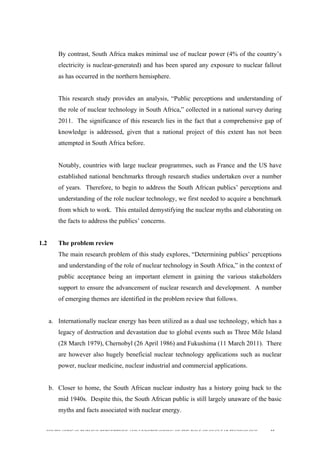
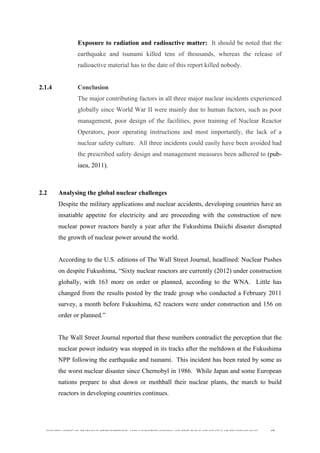
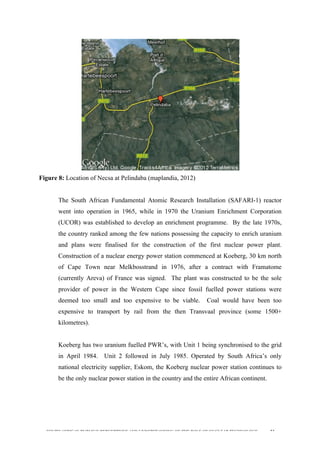
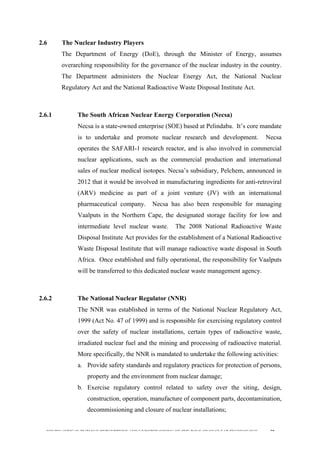
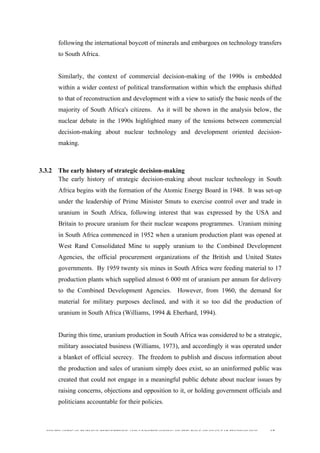
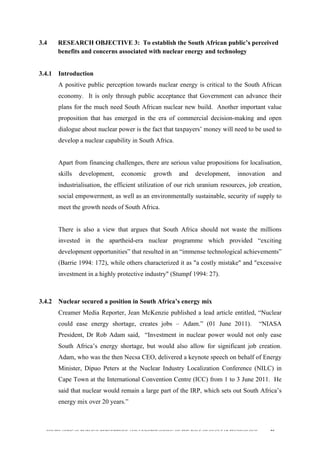
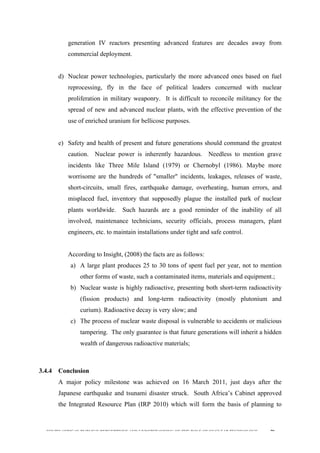
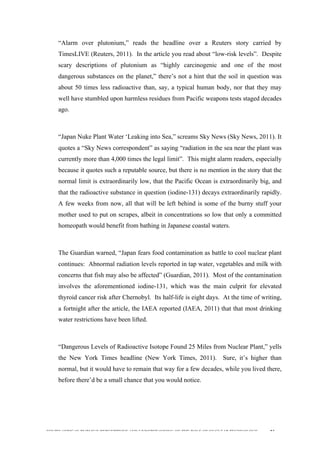
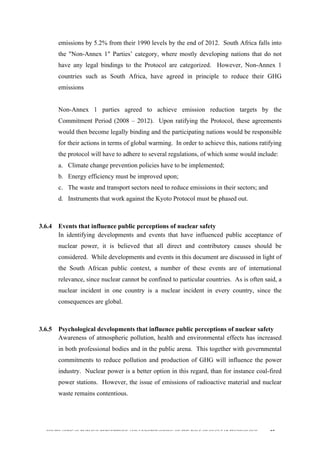
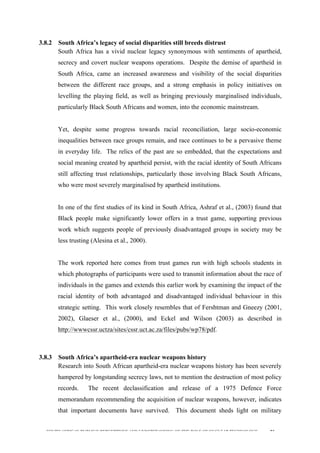
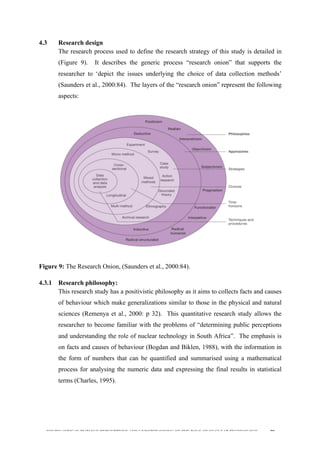
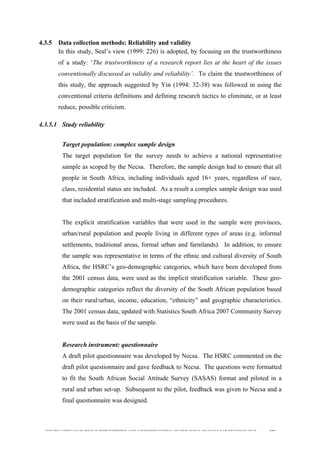
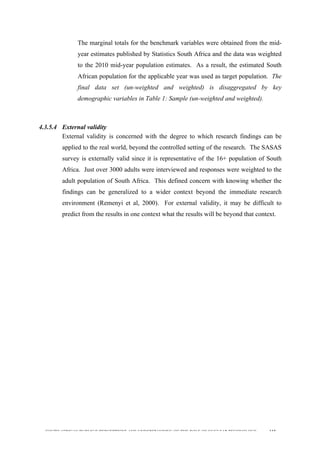
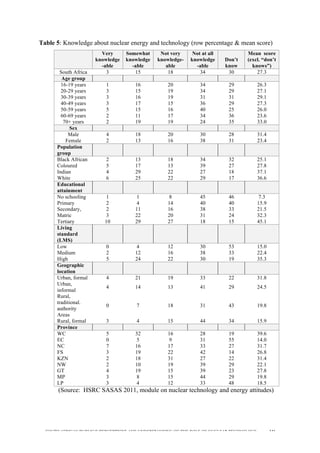
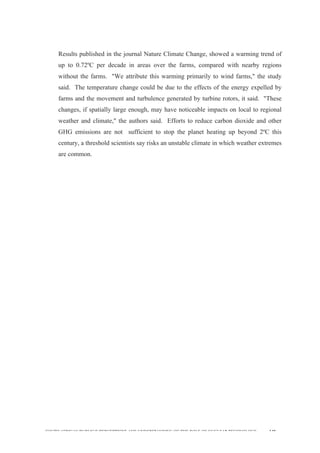
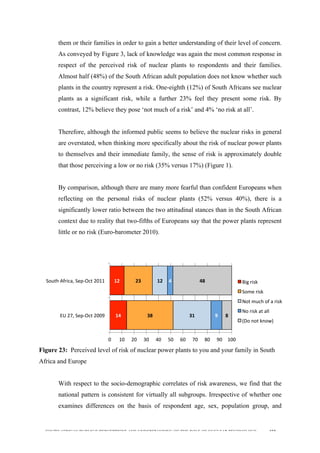
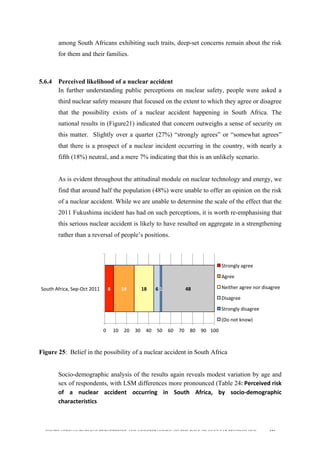
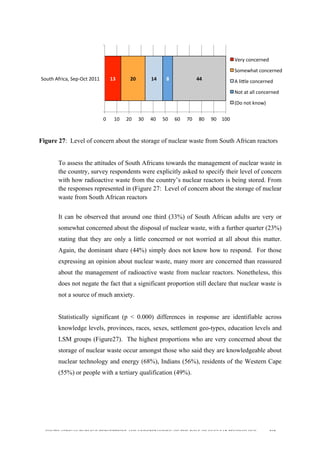
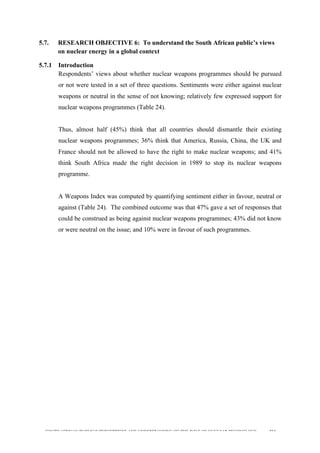
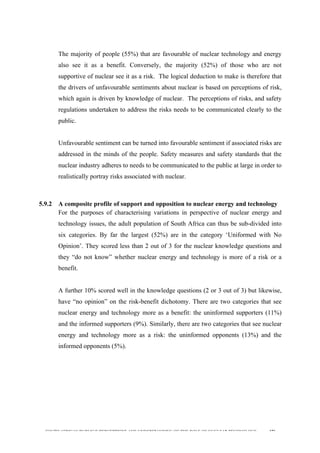
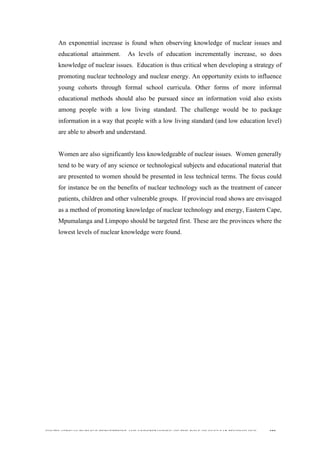
The 2011 sample was updated and drawn by Prof. David Stoker, a statistician who
has also been responsible for many of Statistics South Africa’s national surveys
based on international best practice. The sample had to be updated since the
previous SASAS samples were based on the HSRC’s second master sample EA’s
which was compiled many years before (2003). The new sampling frame was
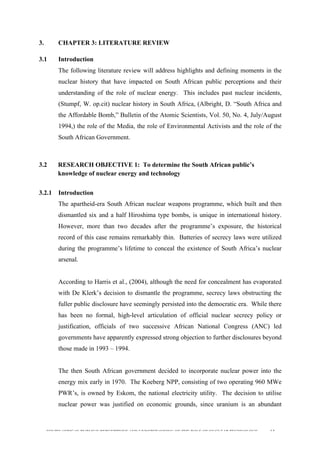
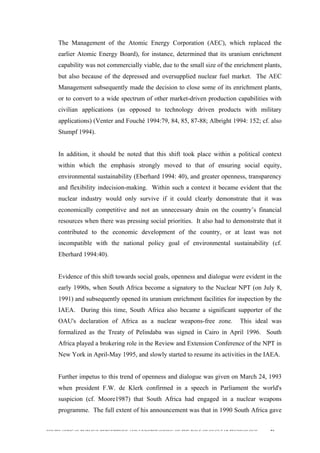
developed using the 2011 census midyear population estimates. A summary
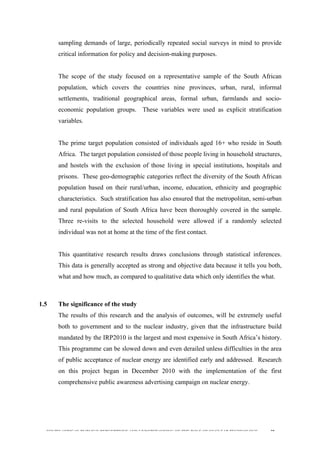
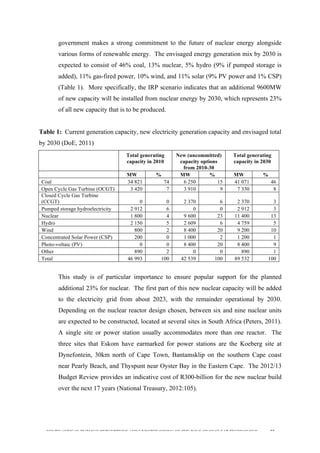
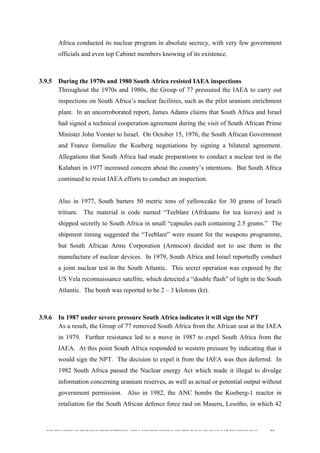
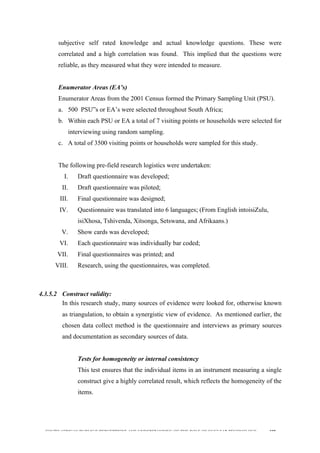
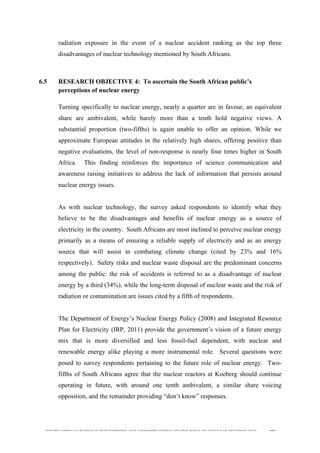
disaggregated by race and province is illustrated in Table 3.
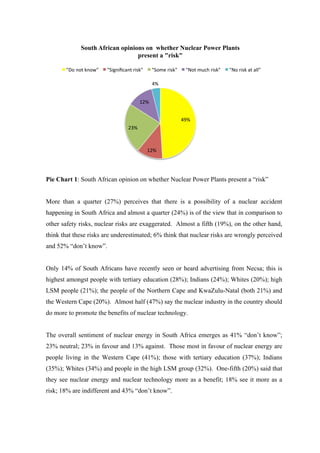
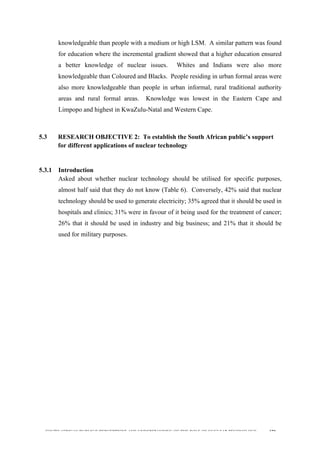
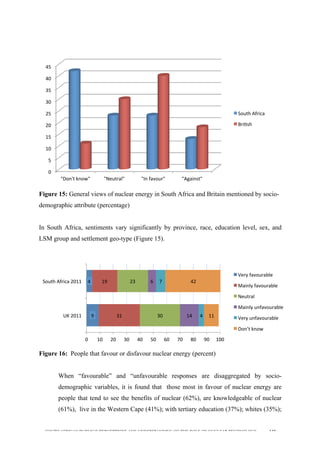
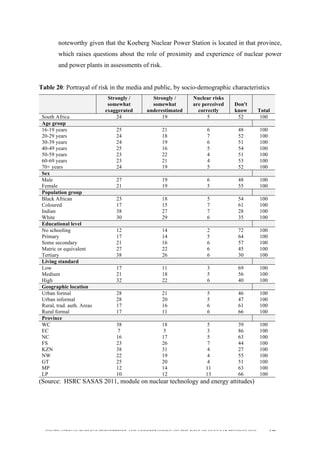
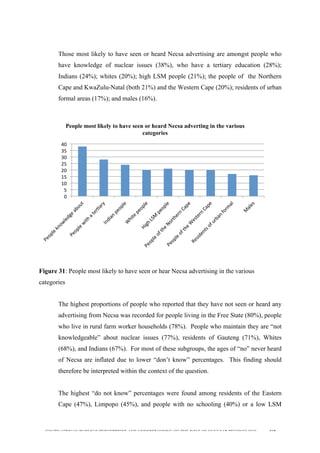
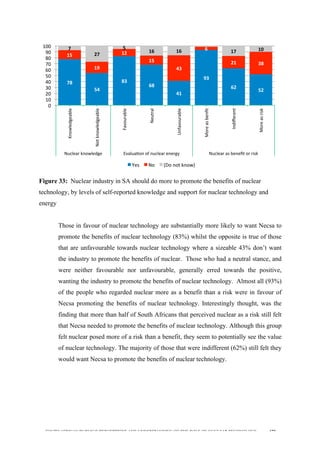
Table 3: Number of Enumerator Areas selected by Province and Race
Province African Coloured Indians White Total 2011
WC 15 32 3 21 71
EC 32 13 3 12 60
FC 9 14 0 6 29
FS 22 4 0 10 36
KZN 39 6 25 15 85
NW 24 3 2 9 38
GT 43 12 15 33 103
MP 25 2 2 9 38
LP 30 2 1 7 40
Total 2011 239 88 51 122 500
(Source: HSRC SASAS 2011, module on number of Enumerator Areas selected by Province & Race)
Navigation to the selected areas
Once the sample was selected, a navigational toolkit was developed to assist the
field teams in finding the correct areas. These kits assisted the Supervisors and
Fieldworkers to locate the exact EA where the interviews were to take place. The
navigational kits included:
a. Route descriptions, to assist the teams to navigate their way into the selected
EA’s;
b. Maps using aerial photographs as a base, identified the exact geographic location
of the EA’s to be sampled throughout the country;](https://image.slidesharecdn.com/d3c1ff48-1e29-4982-bd07-eb4da38db9e1-170206210034/85/Determining-Public-Perceptions-and-understanding-of-the-role-of-Nuclear-Technology-in-South-Africa-by-CC-Janneker-Thesis-14-May-2012-FINAL-104-320.jpg)
![SOUTH AFRICAN PUBLIC’S PERCEPTIONS AND UNDERSTANDING OF THE ROLE OF NUCLEAR TECHNOLOGY 181
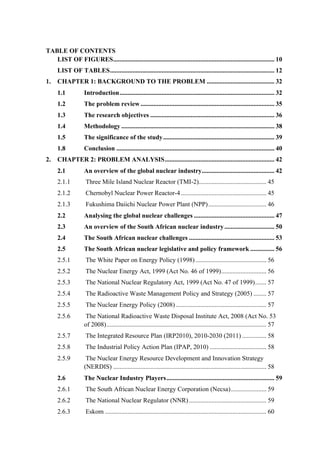
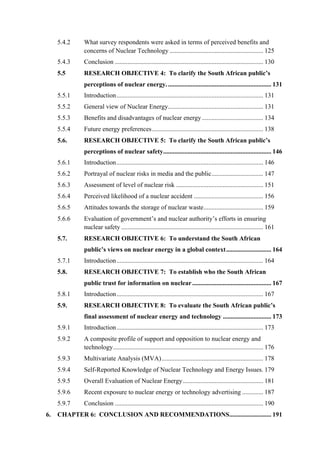
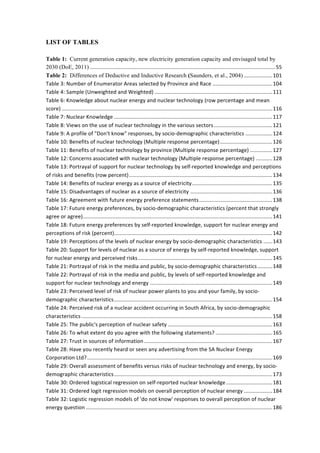
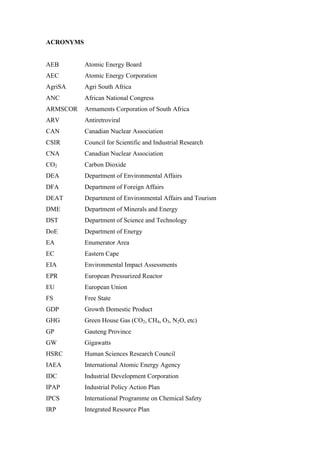
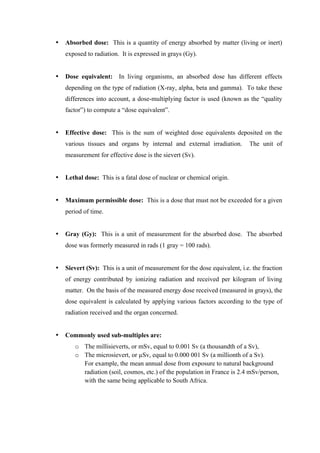
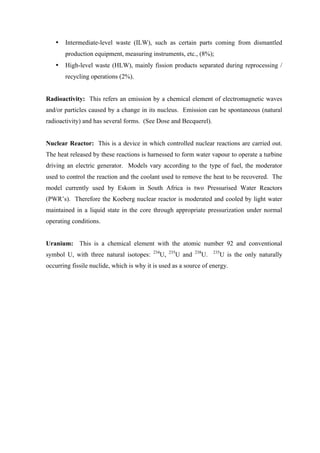
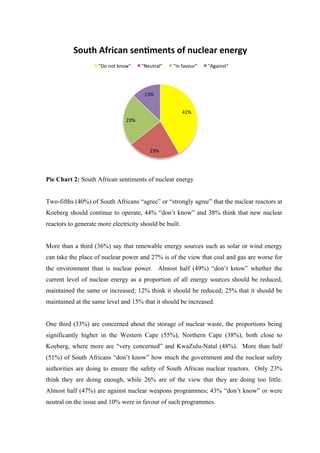
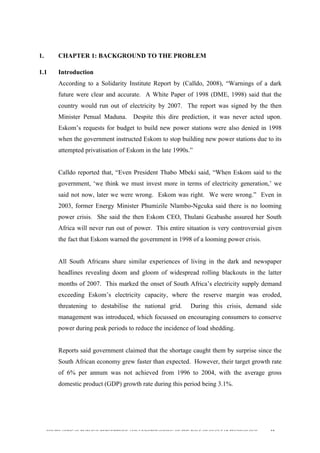
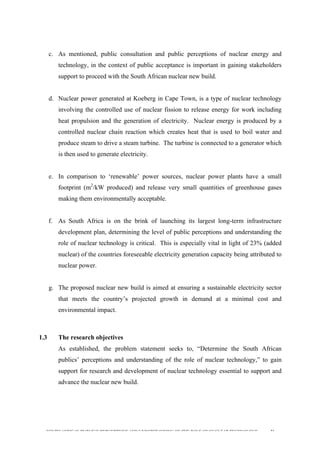
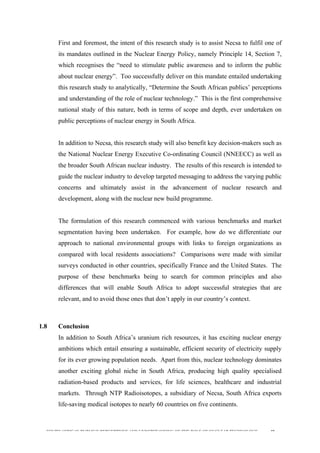
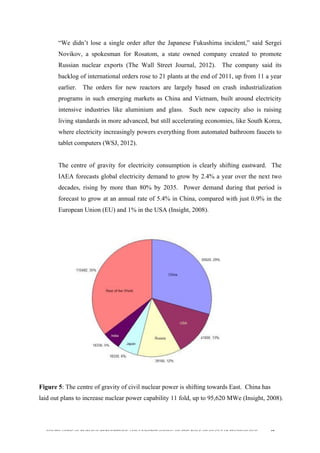
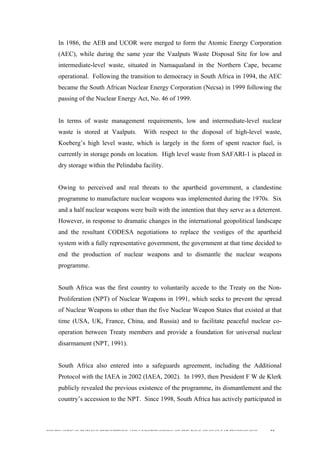
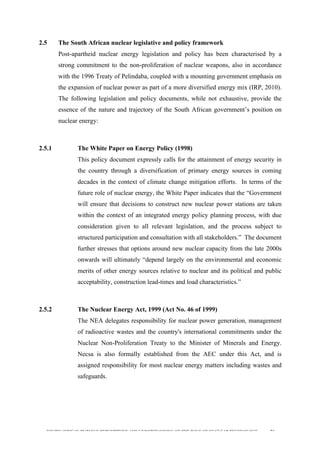
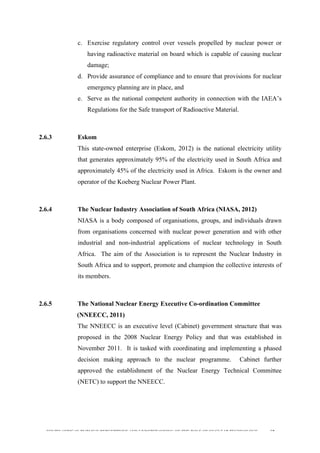
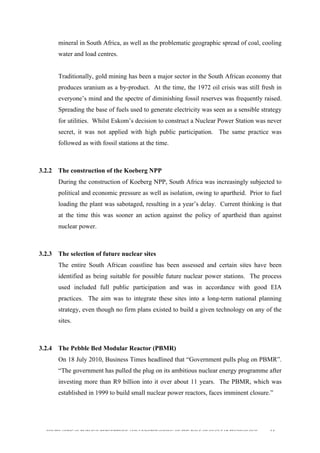
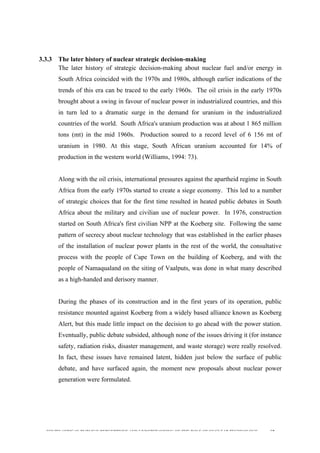
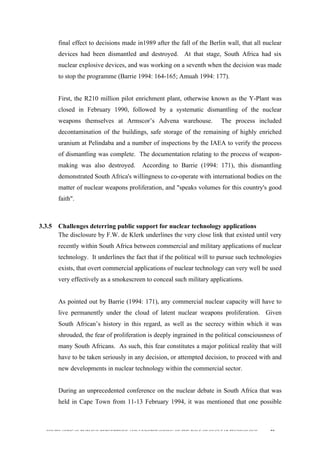
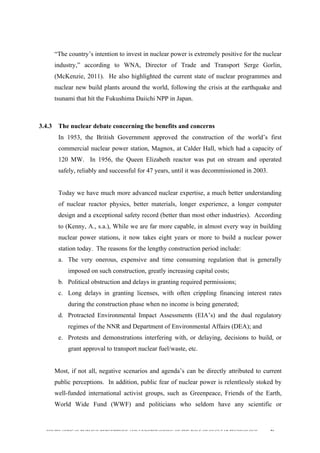
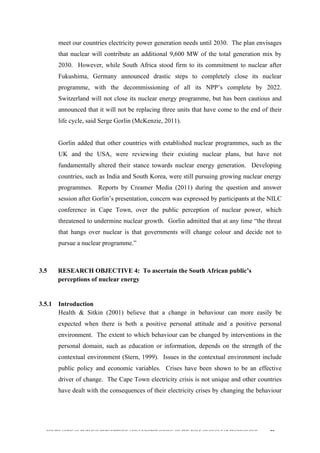
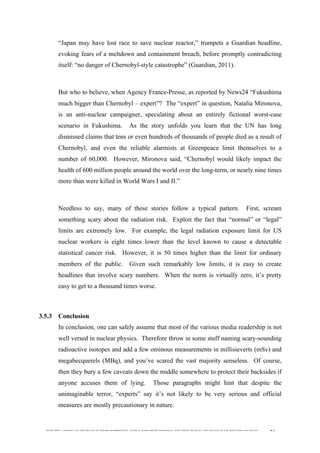
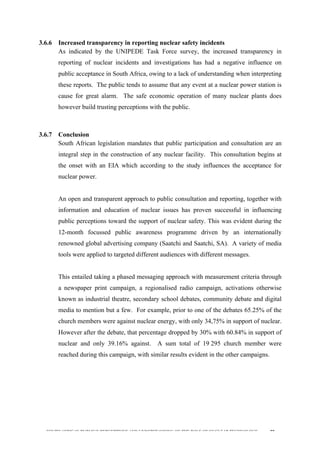
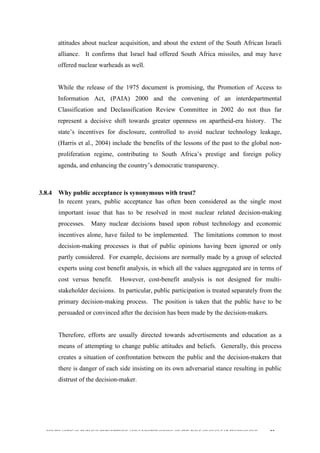
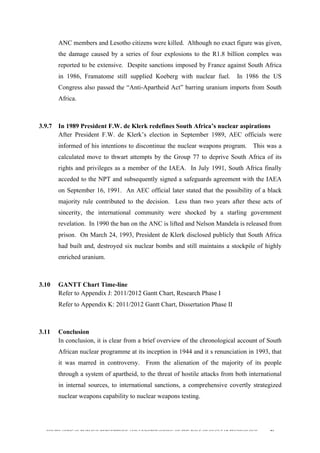
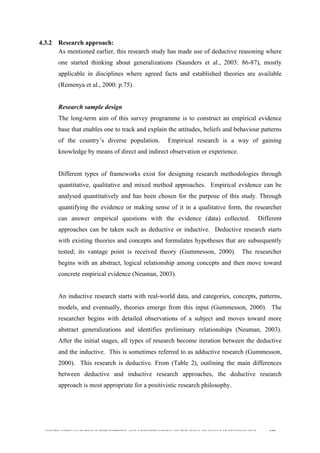
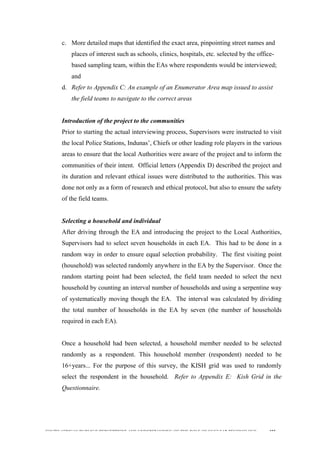
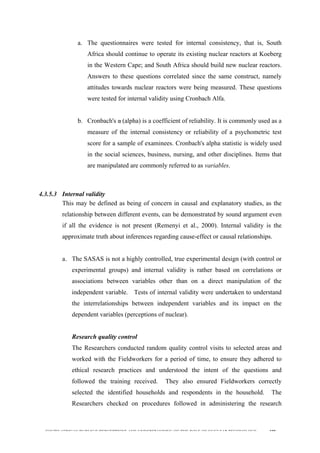
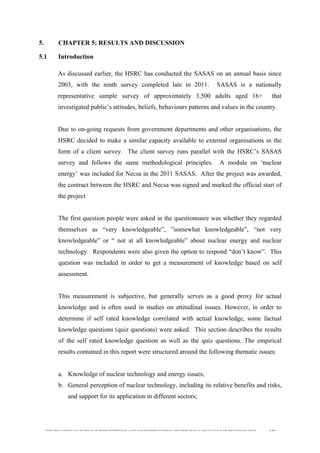
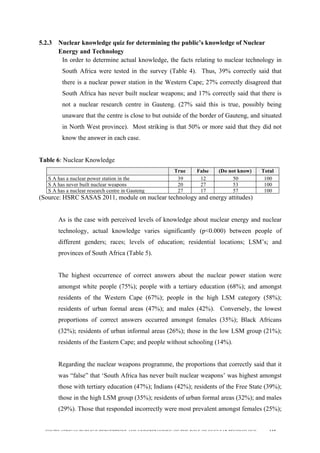
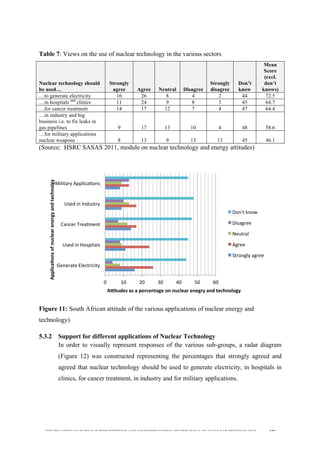
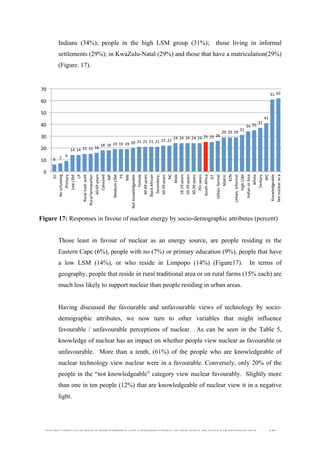
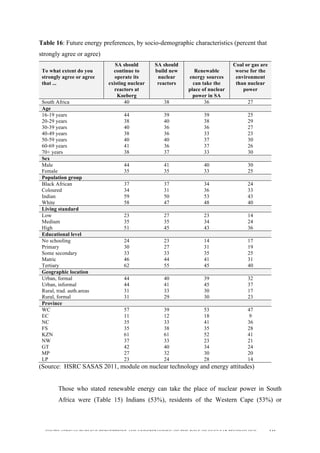
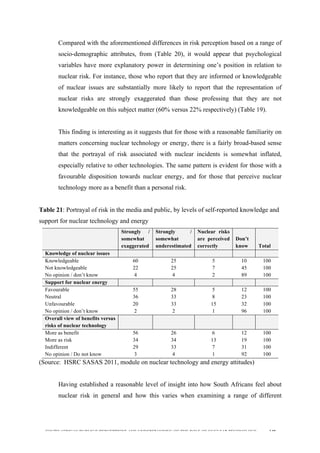
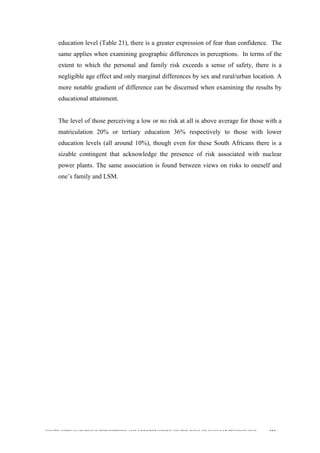
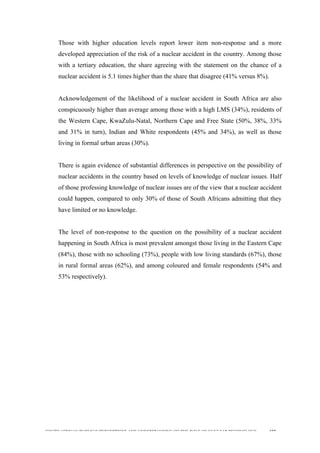
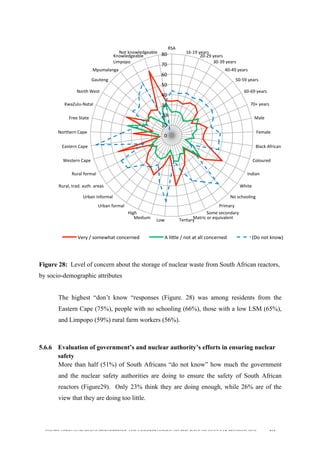
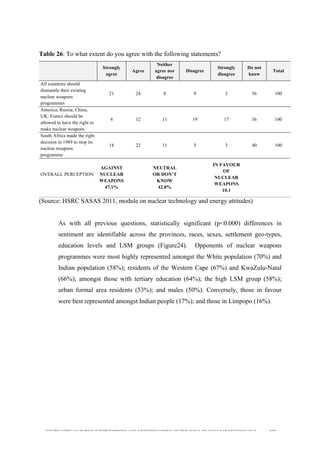
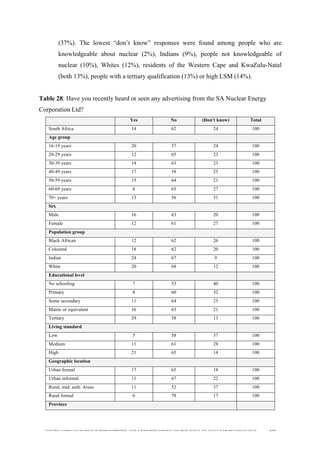
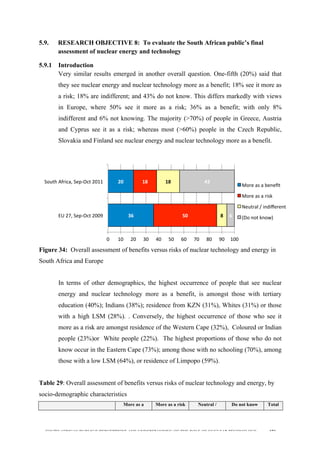
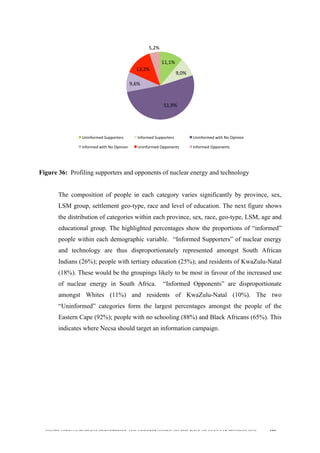
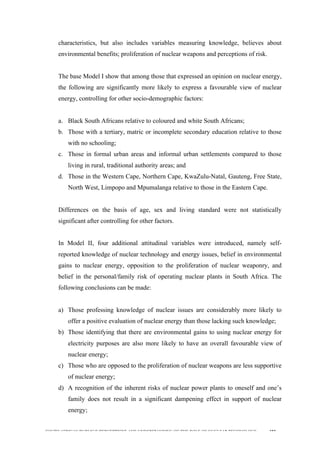
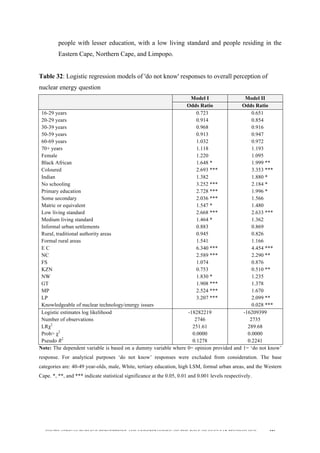
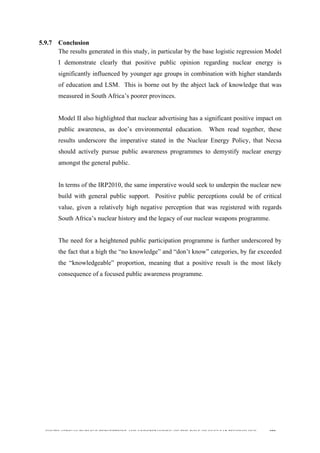
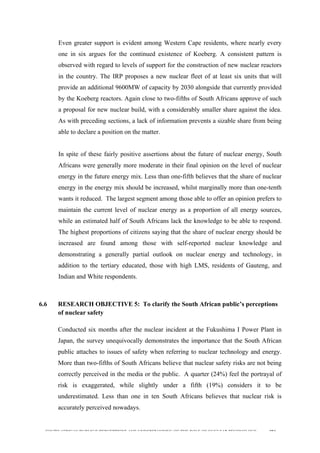
Table 30: Ordered logistical regression on self-reported nuclear knowledge
Coefficient Standard
Error
Z P>z [95% Confidence
Interval]
16-19 years -0.063 0.240 -0.260 0.793 -0.533 0.407
20-29 years 0.040 0.173 0.230 0.818 -0.299 0.379
30-39 years -0.007 0.176 -0.040 0.967 -0.352 0.338
50-59 years 0.054 0.206 0.260 0.793 -0.350 0.458
60-69 years 0.192 0.225 0.850 0.394 -0.250 0.634
70+ years 0.549 0.236 2.330 0.020 0.087 1.011
Female -0.358 0.114 -3.140 0.002 -0.581 -0.135
Black 0.216 0.205 1.050 0.292 -0.186 0.619
Coloured -0.269 0.236 -1.140 0.254 -0.731 0.193
Indian 0.171 0.212 0.810 0.420 -0.245 0.587
No schooling -2.400 0.365 -6.580 0.000 -3.115 -1.686
Primary education -1.445 0.268 -5.400 0.000 -1.970 -0.920
Some secondary -1.035 0.194 -5.340 0.000 -1.415 -0.655
Matric or equivalent -0.510 0.189 -2.700 0.007 -0.879 -0.140
Low living standard -0.628 0.312 -2.010 0.044 -1.240 -0.017
Medium living standard -0.303 0.165 -1.840 0.066 -0.627 0.020
Urban informal -0.147 0.232 -0.630 0.526 -0.602 0.308
Rural trad. auth. Areas -0.192 0.181 -1.060 0.290 -0.547 0.163
Rural formal -0.557 0.298 -1.870 0.062 -1.142 0.028
Eastern Cape -1.846 0.335 -5.510 0.000 -2.502 -1.189
Northern Cape -0.472 0.305 -1.550 0.121 -1.069 0.125
Free State -0.314 0.272 -1.150 0.249 -0.847 0.220
KwaZulu-Natal -0.339 0.210 -1.610 0.107 -0.752 0.073
North West -0.956 0.262 -3.650 0.000 -1.470 -0.443
Gauteng -0.861 0.215 -4.000 0.000 -1.284 -0.439
Mpumalanga -1.333 0.286 -4.670 0.000 -1.893 -0.773
Limpopo -1.364 0.287 -4.760 0.000 -1.925 -0.802
Recent exposure to
nuclear advertising 1.776 0.146 12.120 0.000 1.489 2.063
/cut1 -1.05489 0.27777 -1.5993 -0.51047
/cut2 0.145396 0.276215 -0.39597 0.686767
/cut3 2.425028 0.296204 1.844479 3.005576
Ordered logit estimates log likelihood = --25814387; number of obs = 2728; LRχ2
(28) = 489.4; Prob> χ2
=
0.0000; Pseudo R2
= 0.1508
(Note: The dependent variable is based on a reversed scale where 1=not at all knowledgeable, 2=not very
knowledgeable, 3=somewhat knowledgeable and 4=very knowledgeable. For analytical purposes ‘do not know’
responses were combined with the ‘not at all knowledgeable’ category. The base categories are: 40-49 year-olds,
male, white, tertiary education, high LSM, formal urban areas, and the Western Cape.
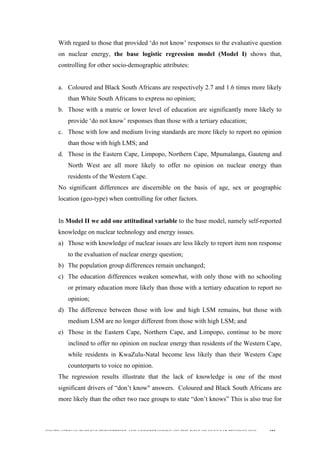
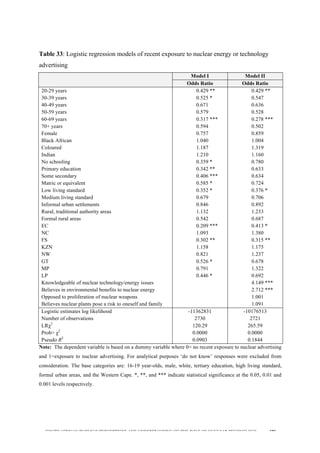
5.9.5 Overall Evaluation of Nuclear Energy
The regression in this section, explains the relationship between support for nuclear
energy and socio-demographic characteristics Model I and also. Model II explains the
relationship between support for nuclear energy and socio demographic](https://image.slidesharecdn.com/d3c1ff48-1e29-4982-bd07-eb4da38db9e1-170206210034/85/Determining-Public-Perceptions-and-understanding-of-the-role-of-Nuclear-Technology-in-South-Africa-by-CC-Janneker-Thesis-14-May-2012-FINAL-181-320.jpg)
![SOUTH AFRICAN PUBLIC’S PERCEPTIONS AND UNDERSTANDING OF THE ROLE OF NUCLEAR TECHNOLOGY 198
7. REFERENCES
Albright, D. 1994. ‘The Legacy of the South African Nuclear Weapons Program’. Paper
presented at the Conference on a Nuclear Policy for a Democratic South Africa, Cape Town,
11-13 Feb. 1994.
Alesina, Alberto., and La Ferrara, Eliana. [2000]: “Who Trusts Others” Journal of Public
Economics, 85, 207-34.
Amuah, I. 1994 Nuclear Policy in South Africa: Past, Present and Future. In The Nuclear
Debate. Proceedings of the Conference on Nuclear Policy for a Democratic South Africa.
Environmental Monitoring Group: Western Cape.
Anon. 2008. Times put Eskom under the griller. Available from http://
http://www.timeslive.co.za/thetimes/2008/01/29/times-puts-eskom-under-the-griller
[Accessed 18 January 2012]
Anon. 2008. 80 000 miners may lose jobs. Available from
http://www.fin24.com/Economy/80-000-miners-may-lose-jobs-20080214.
[Accessed 19 February 2012]
Ashraf, Nava, Bohnet, Iris and Piankov, Nikita. [2004]: “Is Trust a Bad Investment,” KSG
Faculty Research Working Paper Series, RWP03-047, Harvard University.
Auf der Heyde, T. 1994 The South African Nuclear Fuel Industry: History and Prospects. In
The Nuclear Debate. Proceedings of the Conference on Nuclear Policy for a Democratic
South Africa. Environmental Monitoring Group: Western Cape.
Barrie, G. 1994 Nuclear Law and Policy in South Africa after 1994. In The Nuclear Debate.
Proceedings of the Conference on Nuclear Policy for a Democratic South Africa.
Environmental Monitoring Group: Western Cape.
Calldo, F. 2008. Eskom’s power crisis: Reasons, impact & possible solutions. Available
from http://www.solidarityinstitute.co.za/docs/eskom_crisis.pdf [Accessed 16 March 2012]](https://image.slidesharecdn.com/d3c1ff48-1e29-4982-bd07-eb4da38db9e1-170206210034/85/Determining-Public-Perceptions-and-understanding-of-the-role-of-Nuclear-Technology-in-South-Africa-by-CC-Janneker-Thesis-14-May-2012-FINAL-198-320.jpg)
![SOUTH AFRICAN PUBLIC’S PERCEPTIONS AND UNDERSTANDING OF THE ROLE OF NUCLEAR TECHNOLOGY 199
Christie, R. 1994 The Military Dimensions of Nuclear Development in South Africa. In The
Nuclear Debate. Proceedings of the Conference on Nuclear Policy for a Democratic South
Africa. Environmental Monitoring Group: Western Cape.
Coldwell, D. & Herbst, F. Business Research, Cape Town: Juta
Cooper, D.R. and Schindler, P.S. 2003. Business Research Methods 9th
ed. London:
McGraw-Hill
Dalquist, S. 2004. Timeline: A Chronology of Public Opinion on Nuclear Power in the
United States and the United Kingdom. MIT.
Dawson, C., Spegele, B. & Williams, S. 2012. ‘Nuclear Pushes On Despite Fukushima’. The
Wall Street Journal. Available from
http://online.wsj.com/article/SB10001424052970204276304577265240284295880.html
[Accessed 20 April 2012]
DEAT.2009. Greenhouse Gas inventory South Africa 1990 to 2000: National Inventory
Report”, Pretoria: Department of Environment Affairs and Tourism.
Department of Environmental Affairs and Tourism. 2004. A national climate change
response strategy for South Africa. Available from
http://unfccc.int/files/meetings/seminar/application/pdf/sem_sup3_south_africa.pdf
[Accessed 29 November 2011]
De Boer, C. &Catsburg, I. 1988.The Impact of Nuclear Accidents on Attitudes toward
Nuclear Energy.Public Opinion Quarterly 2 (2), 254-261.
DIRC (2004) Treaty on the Non-Proliferation of Nuclear Weapons (NPT). Available from
www.dfa.gov.za/foreign/Multilateral/inter/npt.htm [Accessed 17 January 2012]
DME (1998) White Paper on the Energy Policy of the Republic of South Africa. Pretoria:
Department of Minerals and Energy.](https://image.slidesharecdn.com/d3c1ff48-1e29-4982-bd07-eb4da38db9e1-170206210034/85/Determining-Public-Perceptions-and-understanding-of-the-role-of-Nuclear-Technology-in-South-Africa-by-CC-Janneker-Thesis-14-May-2012-FINAL-199-320.jpg)
![SOUTH AFRICAN PUBLIC’S PERCEPTIONS AND UNDERSTANDING OF THE ROLE OF NUCLEAR TECHNOLOGY 200
DME (2005) Radioactive Waste Management Policy and Strategy. Pretoria: Department of
Minerals and Energy.
DME (2008) Nuclear Energy Policy and Strategy for the Republic of South Africa. Pretoria:
Department of Minerals and Energy.
DoE (2008) National Energy Act No. 34 of 2008. Government Gazette No. 31638, 24
November 2008.
DoE (2011) Integrated Resource Plan for Electricity 2010-2030. Government Gazette
No.34263, 6 May 2011. Available from http://www.doe-
irp.co.za/content/IRP2010_2030_Final_Report_20110325.pdf [Accessed 8 March 2012]
Earthlife Africa 2000. Renewable Energy the Obvious Choice for Energy Development in
South Africa. Earthlife Africa: Johannesburg.
Eberhard, A. 1994 Options for energy Policy and Planning in South Africa: Where does
Nuclear Power fit in? In The Nuclear Debate. Proceedings of the Conference on Nuclear
Policy for a Democratic South Africa. Environmental Monitoring Group: Western Cape.
Eiser, J.R., Spears, R., Webley, P. & van der Pligt, J. 1988a. Local residents’ attitudes to oil
and nuclear developments. Social Behaviour 3, 237-253.
Eiser, J.R., van der Pligt, J. & Spears, R. 1988b. Local opposition to the construction of a
nuclear power station: differential salience of impacts. Journal of Applied Social Psychology
18, 654-663.
Eiser, J.R., Hannover, B., Mann, L., Morin, M., van der Pligt, J., Webly, P. 1990. Nuclear
attitudes after Chernobyl: a cross national study. Journal of Environmental Psychology 10,
101–110.](https://image.slidesharecdn.com/d3c1ff48-1e29-4982-bd07-eb4da38db9e1-170206210034/85/Determining-Public-Perceptions-and-understanding-of-the-role-of-Nuclear-Technology-in-South-Africa-by-CC-Janneker-Thesis-14-May-2012-FINAL-200-320.jpg)
![SOUTH AFRICAN PUBLIC’S PERCEPTIONS AND UNDERSTANDING OF THE ROLE OF NUCLEAR TECHNOLOGY 201
Fig, D. (2008) A price too high: nuclear energy in South Africa. In McDonald, David A. (ed.)
Electric Capitalism: Recolonising Africa on the power grid, chapter 6, pp. 180-201. HSRC
Press.
Gayle, D. 2012. Stricken Fukushima nuclear plant at dire risk of massive new earthquake,
scientists warn. Available from http://www.dailymail.co.uk/sciencetech/article-
2100901/Stricken-Fukushima-Daiichi-nuclear-plant-dire-risk-massive-new-earthquake-
scientists-warn.html [19 February 2012]
Glaeser, E., D. Laibson, J. Scheinkman, and C. Soutter [2000]: “Measuring
Trust,” Quarterly Journal of Economics, 115[3], 811–846
Govender, P. 2010. Government pulls plug on PBMR. Available from
http://www.timeslive.co.za/business/2010/07/18/government-pulls-plug-on-pbmr
[22 November 2011]
Grammaticas, D. 2011. Japanearthquake:ExplosionatFukushimanuclearplant.Availablefrom
http://www.bbc.co.uk/news/world-asia-pacific-12720219. [Accessed14January2012]
Guardian. 2011 Japan may have lost race to save nuclear reactor. Available from
http://www.guardian.co.uk/world/2011/mar/29/japan-lost-race-save-nuclear-reactor/print
[Accessed 18 March 2012]
Guardian. 2011 Japan fears food contamination as battle to cool nuclear plant continues.
Available from http://www.guardian.co.uk/world/2011/mar/22/japan-food-contamination-
nuclear-plant/print [Accessed 18 March 2012]
Harris. 2004. Unveiling South Africa’s nuclear past. Journal of Southern African Studies.
30(3), 457-475
Health 24. 2011. Radiation and you. Available from
http://admin.health.co.za/medical/condition_centres/777-792-1461-2097,61774.asp
[Accessed 14 January 2012]](https://image.slidesharecdn.com/d3c1ff48-1e29-4982-bd07-eb4da38db9e1-170206210034/85/Determining-Public-Perceptions-and-understanding-of-the-role-of-Nuclear-Technology-in-South-Africa-by-CC-Janneker-Thesis-14-May-2012-FINAL-201-320.jpg)
![SOUTH AFRICAN PUBLIC’S PERCEPTIONS AND UNDERSTANDING OF THE ROLE OF NUCLEAR TECHNOLOGY 202
Health & Sitkin (2001, 81) believe that a change in behaviour can more easily be expected
when there is both a positive personal attitude and a positive personal
Hill, M. 2008. Experts warn power crisis threatens growth but govt says ‘no need to panic’.
Available from http://www.engineeringnews.co.za/article.php?a_id=124684
[Accessed 15 December 2011]
Hofstee, E. 2006.Constructing a Good Dissertation, Sandton, South Africa: EPE
Hrobsky, M. & J. Wright. 2008. Canadian Attitudes towards Nuclear Energy: Tracking
Survey Results, September 2008. Slide Presentation Submitted to: Canadian Nuclear
Association.
IAEA, 2001. Fukushima Nuclear Accident Update Log. Available from
http://www.iaea.org/newscenter/news/tsunamiupdate01.html [Accessed 7 February 2012]
IAEA. 2012. Powers urge Iran to open site to nuclear inspectors. Available from
http://www.themalaysianinsider.com/world/article/powers-urge-iran-to-site-to-nuclear-
inspectors [Accessed 19 March 2012]
IAEA. 2002. Seminar for African States on the Non-proliferation of Nuclear Weapons:
The Role of Safeguards Agreements and Additional Protocols. Available from
http://www.iaea.org/worldatom/Meetings/2002/infsemsa.pdf [Accessed 3 March 2012]
IHS CERA. Delivering critical knowledge and independent analysis on energy markets,
geopolitics, industry trends and strategy. Available from
http://www.ihs.com/products/cera/index.aspx [Accessed 6 February 2012]
Insight. 2008. Nuclear power: solution or problem? Available from
http://stats.areppim.com/archives/insight_nuclear.htm [Accessed 19 January 2012]](https://image.slidesharecdn.com/d3c1ff48-1e29-4982-bd07-eb4da38db9e1-170206210034/85/Determining-Public-Perceptions-and-understanding-of-the-role-of-Nuclear-Technology-in-South-Africa-by-CC-Janneker-Thesis-14-May-2012-FINAL-202-320.jpg)
![SOUTH AFRICAN PUBLIC’S PERCEPTIONS AND UNDERSTANDING OF THE ROLE OF NUCLEAR TECHNOLOGY 203
Integrated Resource Plan for Electricity 2010-2030. Available from
http://www.doe-irp.co.za/content/IRP2010_2030_Final_Report_20110325.pdf
[Accessed 16 October 2011]
IPSOS MORI-UK, 2010. Attitudes to nuclear energy, 2010
IPSOS MORI. Nuclear Update - December 2011.
Ipsos-Reid. 2003. Canadian Attitudes towards Nuclear Energy: Tracking Survey Results,
Nov 2003. Final Report Submitted to: Canadian Nuclear Association.
Ipsos-Reid. 2004. Canadian Views of Nuclear Energy: Focus on Ontario. Final Report
Submitted to: Canadian Nuclear Association.
Kenny, A. 2011.Eskom.Public perceptions and Nuclear [lecture]
Koeberg Alert Research Group 1987. The Power of the State and the State of Power in SA's
Nuclear Industry. University of Cape Town: Rondebosch.
Komaggas Community Namaqualand 1994 Presentation. In The Nuclear
Debate. Proceedings of the Conference on Nuclear Policy for a Democratic South Africa.
Environmental Monitoring Group: Western Cape.
Koopmans, R. and Duyvendak, W 1994, The Political Construction of the Nuclear Energy
Issue and Its Impact on the Mobilization of Anti-Nuclear Movements in Western Europe.
Berlin: Wissenschaftszentrum fur Sozialforschung.
Kovacs, P., Eng, T. &Gordelier, S. 2010.Public attitudes to nuclear power. Nuclear Energy
Agency. Organisation for Economic Cooperation and Development (OECD), Paris.
Lawton, A and McKenitt, D. 1995.Strategic change in Local government Management:
comparative case studies. Local Government Studies. (1) 46-64
Leedy, P.D. and Ormrod, J.E. 2005.Practical Research. New Jersey: Pearson Education Inc.
Levitt, S.D. and Dubner, S.J. Freakonomics, London: Penguin books.](https://image.slidesharecdn.com/d3c1ff48-1e29-4982-bd07-eb4da38db9e1-170206210034/85/Determining-Public-Perceptions-and-understanding-of-the-role-of-Nuclear-Technology-in-South-Africa-by-CC-Janneker-Thesis-14-May-2012-FINAL-203-320.jpg)
![SOUTH AFRICAN PUBLIC’S PERCEPTIONS AND UNDERSTANDING OF THE ROLE OF NUCLEAR TECHNOLOGY 204
Masiza, Z. 1993. A Chronology of South Africa's Nuclear Program. The Non-proliferation
Review/Fall 1993
Mayle, D.T., Francis, G.A.J., Hinton, C.M. & Holloway, J.A. What really goes on in the
name of Benchmarking? Open University Business School, U.K.
McKenzie, J. 2011. Nuclear could ease energy shortage, create jobs – Adam. Available from
http://www.engineeringnews.co.za/article/nuclear-programme-could-ease-energy-shortage-
create-jobs-adams-2011-06-01 [Accessed 2 February 2012]
Moore, J.D.L. 1987 South Africa and Nuclear Proliferation. South Africa's Nuclear
Capabilities and Intentions in the Context of International Non-proliferation Policies.
London: Macmillan Press.
MyFundi.Youronlineencyclopedia. 2010. Sv. ‘Global warming IV: South Africa and the
Kyoto Protocol
http://myfundi.co.za/e/Global_warming_IV:_South_Africa_and_the_Kyoto_Protocol
[Accessed 17 November 2011]
National Nuclear Regulatory Act, 1999 (Act 47 of 1999), Pretoria: Government Gazette.
Available from http://discover.sabinet.co.za/document/GGD88126
[Accessed 15 October 2011]
National Radioactive Waste Disposal Institute Act, 2008 (Act 53 of 2008), Pretoria:
Government Gazette. Available from
http://www.energy.gov.za/files/policies/act_nuclear_53_2008_NatRadioActWaste.pdf
[Accessed 18 November 2011]
National Treasury (2012) Budget Review 2012. Pretoria: National Treasury.
Necsa. 2012. Annual report 2011.](https://image.slidesharecdn.com/d3c1ff48-1e29-4982-bd07-eb4da38db9e1-170206210034/85/Determining-Public-Perceptions-and-understanding-of-the-role-of-Nuclear-Technology-in-South-Africa-by-CC-Janneker-Thesis-14-May-2012-FINAL-204-320.jpg)
![SOUTH AFRICAN PUBLIC’S PERCEPTIONS AND UNDERSTANDING OF THE ROLE OF NUCLEAR TECHNOLOGY 205
Nelkin, D. & Pollack, M., 1981. A pregnant pause: the European response to the Three Mile
Island accident. The Three Mile Island nuclear accident: lessons and implications. Annals of
the New York Academy of Sciences 365 (1), 186–195.
Nuclear Debate. Proceedings of the Conference on Nuclear Policy for a Democratic South
Africa. Environmental Monitoring Group: Western Cape.
Nuclear Energy, undated. Department of Energy, Republic of South Africa.
Nuclear Energy Act, 1999 (Act 46 of 1999), Pretoria: Government Gazette. Available from
http://discover.sabinet.co.za/document/NTL13299 [Accessed 12 November 2011]
Pallant, J. 2007. SPSS Survival manual. A Step-by-Step Guide to DATA Analysis using SPSS
version 15.U.K> Open University Press.
Peters, D. (2011) ‘Nuclear power is a key part of SA’s future’, Mail & Guardian, 9-14
December 2011, p.23. Available from http://mg.co.za/article/2011-12-09-nuclear-power-is-a-
key-part-of-sas-future [Accessed 1 February 2012]
Production Issues Working Group. 1999. Survey of Different Approaches Utilised to Aid
Public Acceptance of Nuclear Energy. Available from
http://www.eurelectric.org/Download/Download.aspx?DocumentID=4049
[Accessed 16 March 2012]
Ravi, C. 2009. The Nuclear Safety Culture in India: Past, Present and Future. Available from
http://www.ipcs.org/pdf_file/issue/SR90-Chaitanya.pdf [Accessed 26 October 2011]
Reuters. 2011. ‘Alarm over plutonium’ Available from
http://www.timeslive.co.za/world/article994217.ece/Alarm-over-plutonium?service=print
[Accessed 15 January 2012]
Reuters. 2012. “New findings on wind farms,” reported on in NEWS 24 on 29 April 2012 in
London(Reuter – News 24, April 2012. Available from
http://www.info.gov.za/view/DownloadFileAction?id=117330 [Accessed 25 April 2012]](https://image.slidesharecdn.com/d3c1ff48-1e29-4982-bd07-eb4da38db9e1-170206210034/85/Determining-Public-Perceptions-and-understanding-of-the-role-of-Nuclear-Technology-in-South-Africa-by-CC-Janneker-Thesis-14-May-2012-FINAL-205-320.jpg)
![SOUTH AFRICAN PUBLIC’S PERCEPTIONS AND UNDERSTANDING OF THE ROLE OF NUCLEAR TECHNOLOGY 206
Rindfleisch, A., Malter, A.J. &Moorman, C. 2008. Cross-Sectional Versus Longitudinal
Survey Research. Journal of Marketing Research, XLV (3).
Roebuckclasses. 2012. P.30
Sample, I. 2011. Japan may have lost race to save nuclear reactor. Available from
http://www.guardian.co.uk/world/2011/mar/29/japan-lost-race-save-nuclear-reactor/print
[Accessed 26 November 2011]
Saunders 2003 p 101, (Saunders et al., 2003: 86-87)
Sjöberg, L. & Drottz-Sjöberg, B-M. 2009. ‘Public risk perception of nuclear waste’,
International Journal of Risk Assessment and Management, 11(3/4), pp.264-296.
Sky Channel. 2011 Japan Nuke Plant Water ‘Leaking into Seas’ Available from
http://news.sky.com/home/world-news/article/15964569 [Accessed 18 February 2012]
Sohn, KY. 2000. Assimilation of public opinions in nuclear decision-making using risk
perception. Annals of nuclear energy, 28, pp. 553-563
Special Euro-barometer EB324, Europeans and Nuclear Safety, March 2010.
Stott, T. 1994 The Role of Nuclear Power in Meeting South Africa's Future Electricity
Demand. In The Nuclear Debate. Proceedings of the Conference on Nuclear Policy for a
Democratic South Africa. Environmental Monitoring Group: Western Cape.
Susan Segal-Horn 2004, the Strategy Reader. 2nd
ed. Oxford: Blackwell Publishing
Stumpf, W. 1994 the Creation of National Wealth through Technology: The AEC's 2000 Plus
Plan. In The Nuclear Debate. Proceedings of the Conference on Nuclear Policy for a
Democratic South Africa. Environmental Monitoring Group: Western Cape.](https://image.slidesharecdn.com/d3c1ff48-1e29-4982-bd07-eb4da38db9e1-170206210034/85/Determining-Public-Perceptions-and-understanding-of-the-role-of-Nuclear-Technology-in-South-Africa-by-CC-Janneker-Thesis-14-May-2012-FINAL-206-320.jpg)
![SOUTH AFRICAN PUBLIC’S PERCEPTIONS AND UNDERSTANDING OF THE ROLE OF NUCLEAR TECHNOLOGY 207
Stumpf, W. E. 1995. Birth and death of the South African nuclear weapons programme.
Available from http://www.fas.org/nuke/guide/rsa/nuke/stumpf.htm
[Accessed 12 January 2012]
Thomas, K., et.al. 1980. A comparative study of public beliefs about five energy systems.
Luxemburg, Austria: International Institute for Applied Systems Analysis. Available from
http://www.iiasa.ac.at/Admin/PUB/Documents/RR-80-015.pdf
[Accessed 15 November 2011]
van der Pligt, J., 1992. Nuclear Energy and the Public. Blackwell, Oxford.
United Nations. Framework convention on climate change. Available from
http://unfccc.int/2860.php [18 March 2012]
Venter, P. and Fouché, K. 1994 the Uranium Conversion, Enrichment and Fuel Fabrication
Industry in South Africa. In The Nuclear Debate. Proceedings of the Conference on
Nuclear Policy for a Democratic South Africa. Environmental Monitoring Group: Western
Cape.
Von Ketelhodt, A. 2008. ‘The impact of electricity crises on the consumption
Behaviour of small and medium enterprises’, Journal of Energy in Southern Africa, 19(1), pp.
4-12. Available from http://www.eri.uct.ac.za/jesa/volume19/19-1jesa-vonketelhodt.pdf
[Accessed 14 March 2012]
Wald, F. & Peresso, E.M. 1999. Survey of different approaches utilized to Aid Public
Acceptance of Nuclear Energy. Unipede.
Wald, ML. 2011. Dangerous Levels of Radioactive Isotope Found 25 Miles From Nuclear
Plant. Available from
http://www.nytimes.com/2011/03/31/world/asia/31japan.html?_r=1&pagewanted=print
[Accessed 30 January 2012]
Wikipedia. The free encyclopaedia. 2010. Sv. ‘Anti-nuclear movement’ Available from
http://en.wikipedia.org/wiki/Anti_nuclear_movement#Public_opinion_survey_on_nuclear_is
sues](https://image.slidesharecdn.com/d3c1ff48-1e29-4982-bd07-eb4da38db9e1-170206210034/85/Determining-Public-Perceptions-and-understanding-of-the-role-of-Nuclear-Technology-in-South-Africa-by-CC-Janneker-Thesis-14-May-2012-FINAL-207-320.jpg)
![SOUTH AFRICAN PUBLIC’S PERCEPTIONS AND UNDERSTANDING OF THE ROLE OF NUCLEAR TECHNOLOGY 208
[Accessed 23 January 2012]
Wikipedia. The free encyclopaedia. 2010. Sv. ‘Three Mile Island accident’ Available from
http://en.wikipedia.org/wiki/Anti_nuclear_movement#Public_opinion_survey_on_nuclear_is
sues [Accessed 4 February 2012]
Wikipedia. The free encyclopaedia. 2010. Sv. ‘Eskom’ Available from
http://en.wikipedia.org/wiki/Eskom [Accessed 16 November 2011]
Wikipedia. The free encyclopaedia. 2010. Sv. ‘Empiricism’ Available from
http://en.wikipedia.org/wiki/Empiricism [Accessed 3 January 2012]
Wikipedia. The free encyclopaedia. 2010. Sv. ‘Little Boy’ Available from
http://en.wikipedia.org/wiki/Little_Boy [Accessed 15 January 2012]
Wikipedia. The free encyclopaedia. 2010. Sv. ‘Treaty on the Non-Proliferation of Nuclear
Weapons’ Available from http://en.wikipedia.org/wiki/Treaty_on_the_Non-
Proliferation_of_Nuclear_Weapons [Accessed 14 February 2012]
Wikipedia. The free encyclopaedia. 2010. Sv. ‘Fat Man’ Available from
http://en.wikipedia.org/wiki/Fat_Man [Accessed 24 December 2011]
Wikipedia. The free encyclopedia. 2010. Sv. ‘Anti-nuclear movement’ Available from
http://en.wikipedia.org/wiki/Anti_nuclear_movement#Public_opinion_survey_on_nuclear_is
sues [Accessed 1 February 2012]
Williams, K. 1994 The Uranium Mining and Processing Industry in South Africa. In The
Nuclear Debate. Proceedings of the Conference on Nuclear Policy for a Democratic South
Africa. Environmental Monitoring Group: Western Cape.
Woo, T.O. &Castore, C.H. 1980. Expectancy value and selective exposure as determinants
of attitudes towards a nuclear power plant.Journal of Applied Social Psychology 10, 224-234.](https://image.slidesharecdn.com/d3c1ff48-1e29-4982-bd07-eb4da38db9e1-170206210034/85/Determining-Public-Perceptions-and-understanding-of-the-role-of-Nuclear-Technology-in-South-Africa-by-CC-Janneker-Thesis-14-May-2012-FINAL-208-320.jpg)