Download as PDF, PPTX
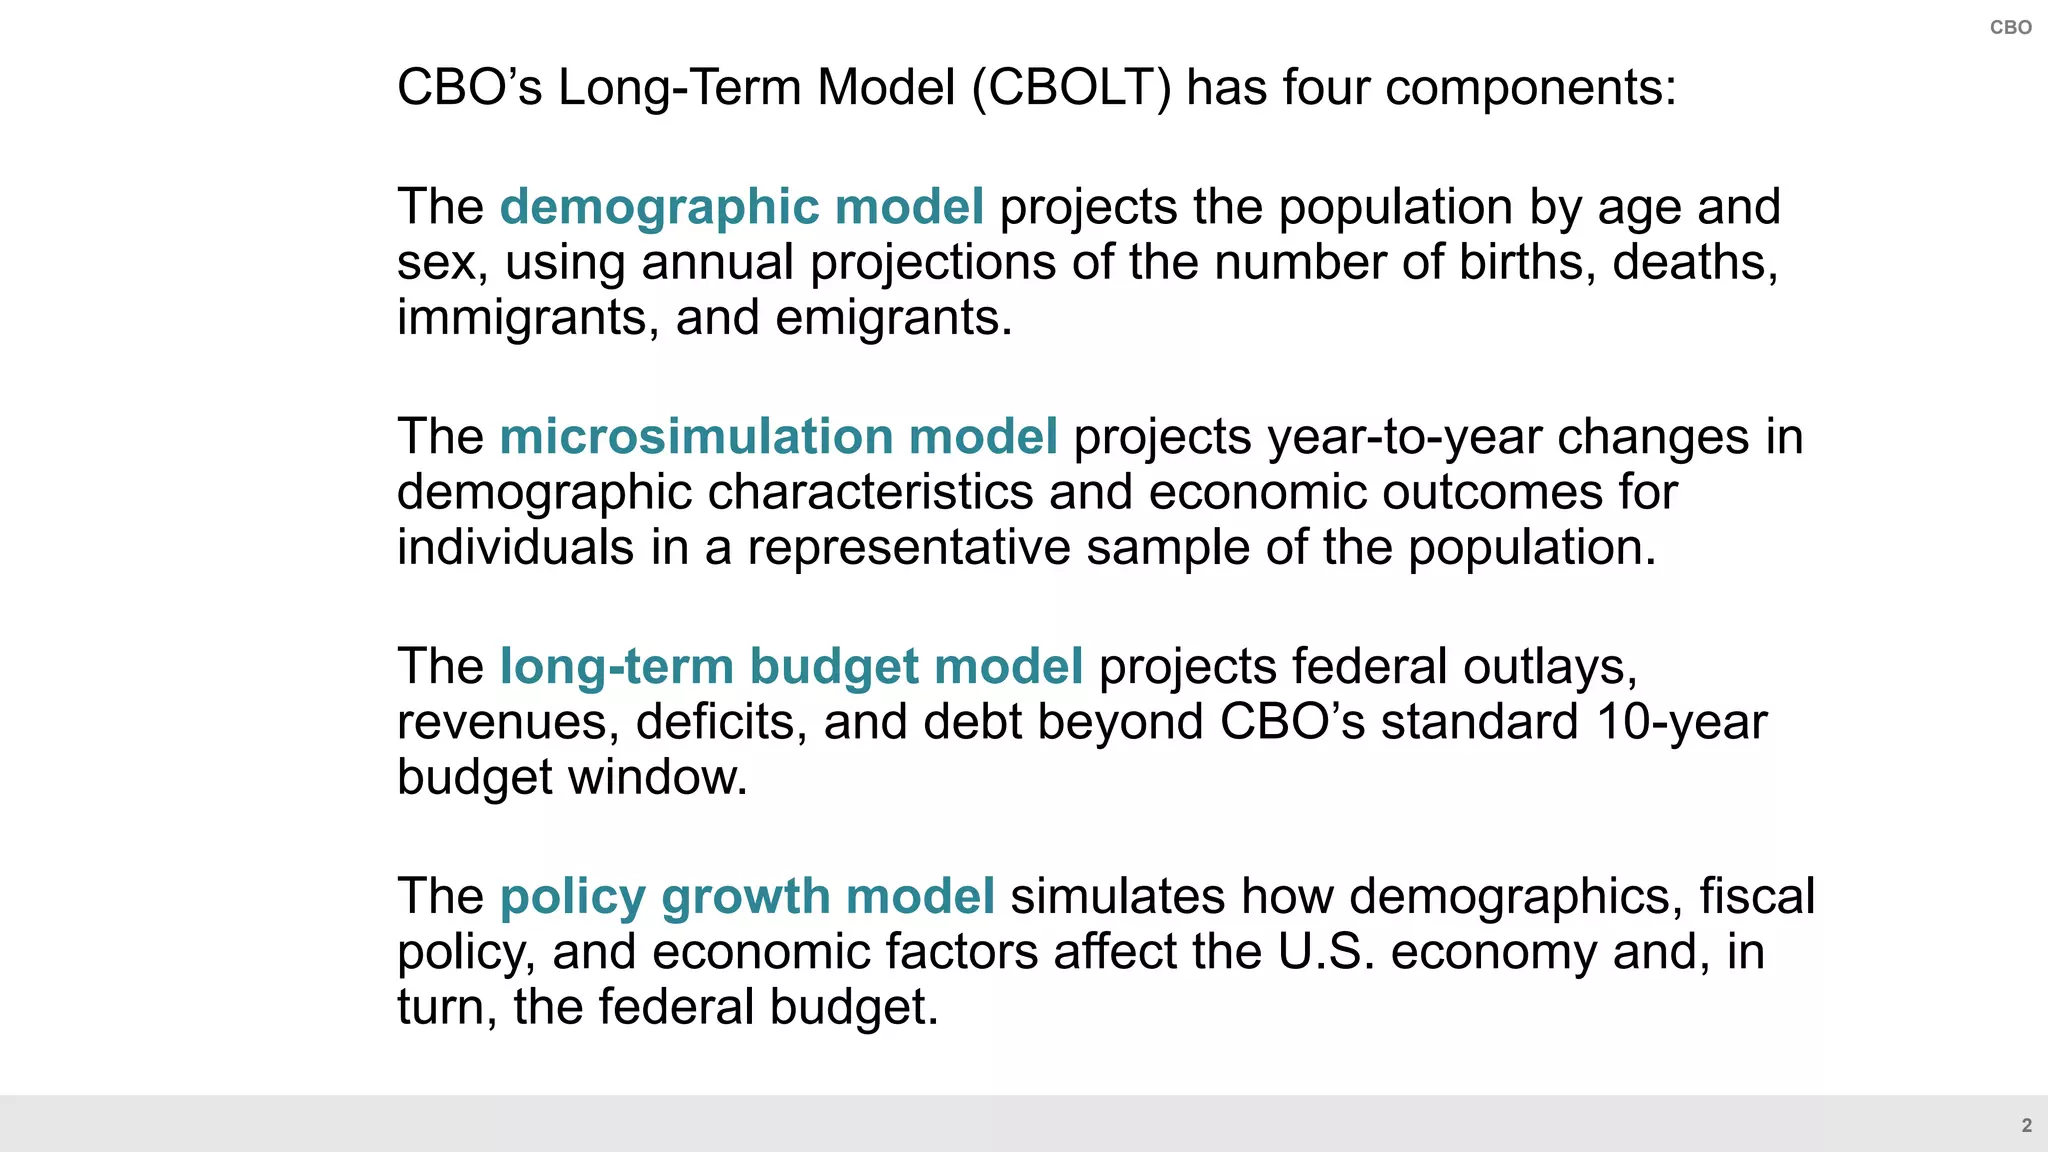
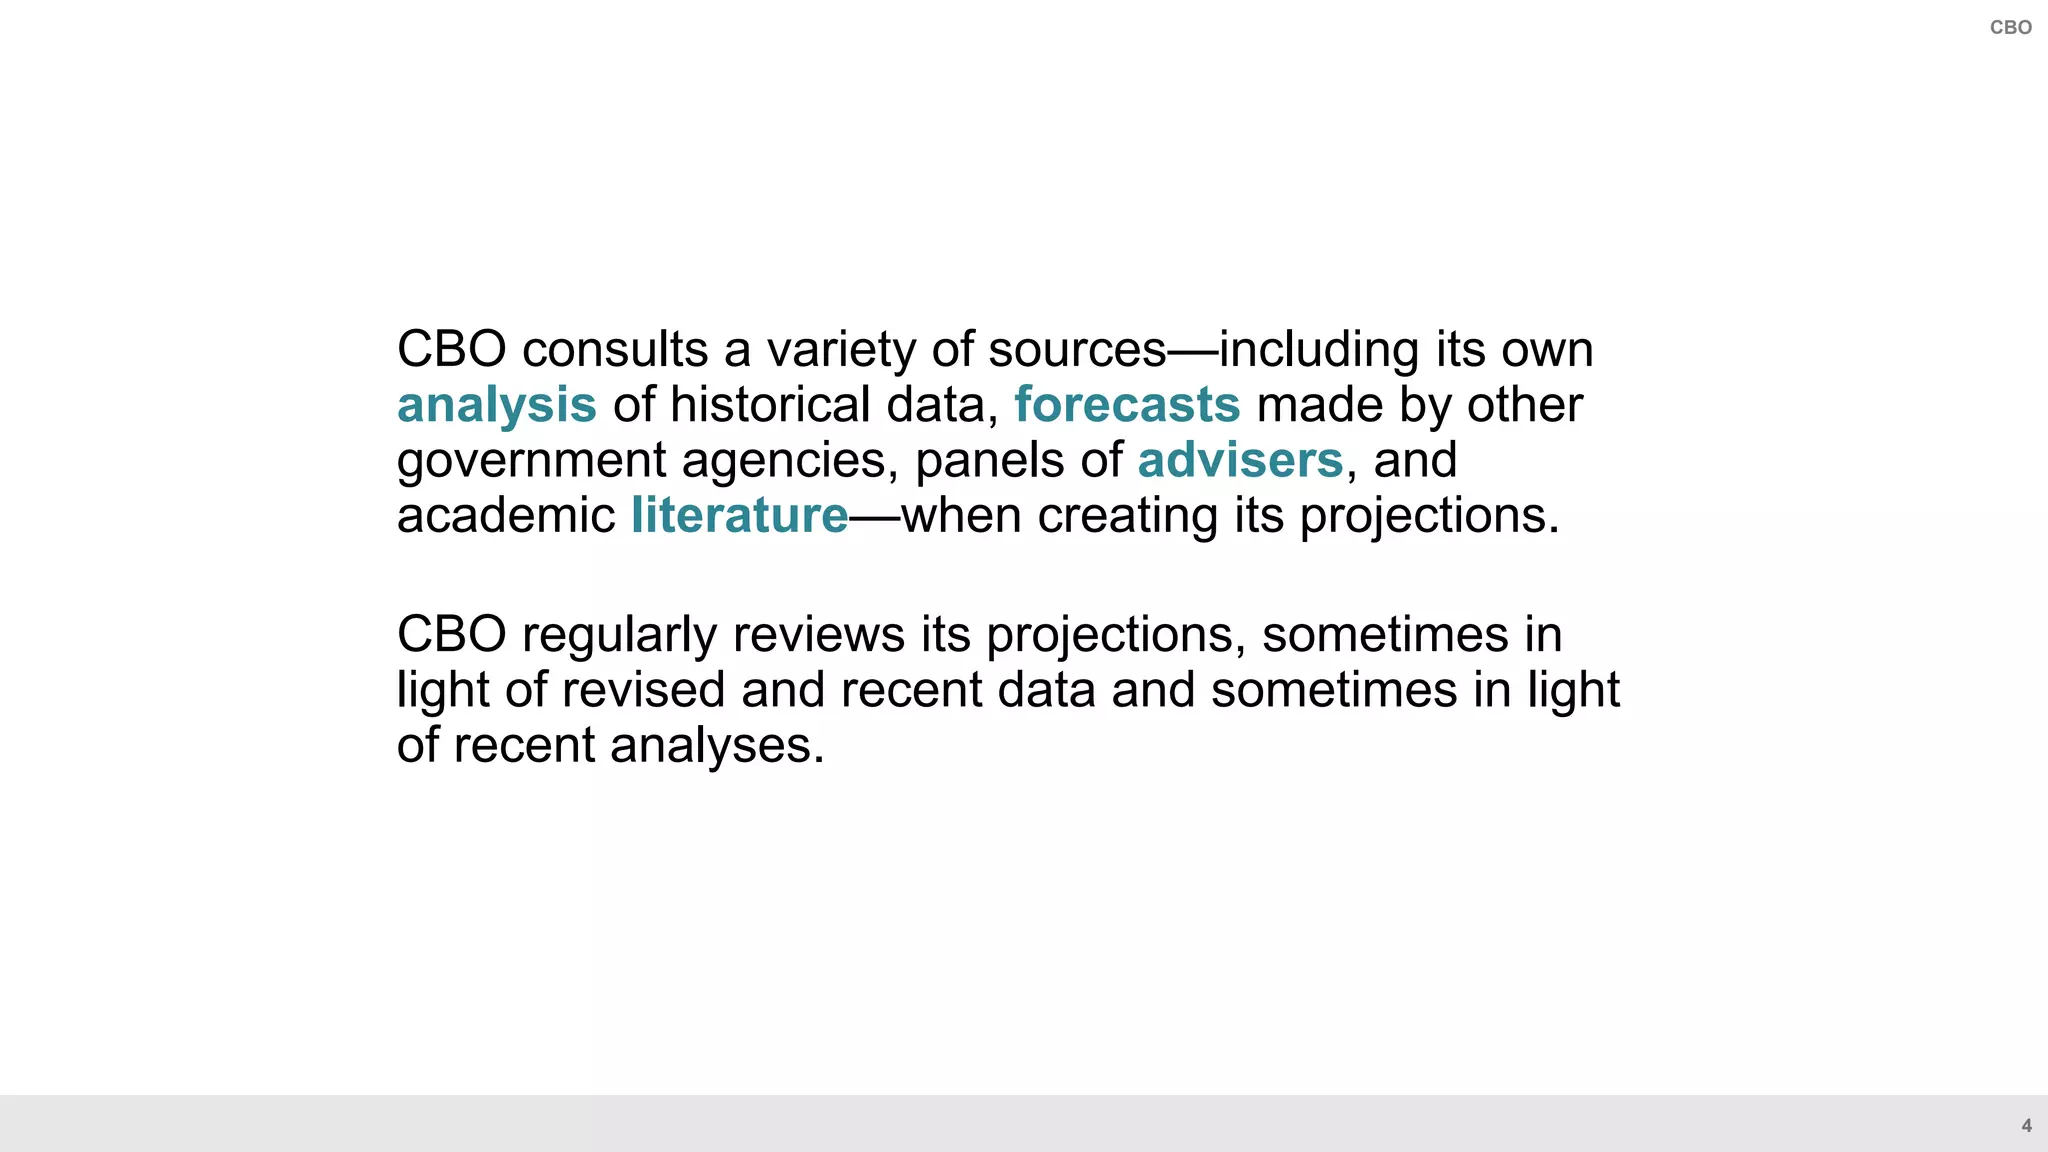

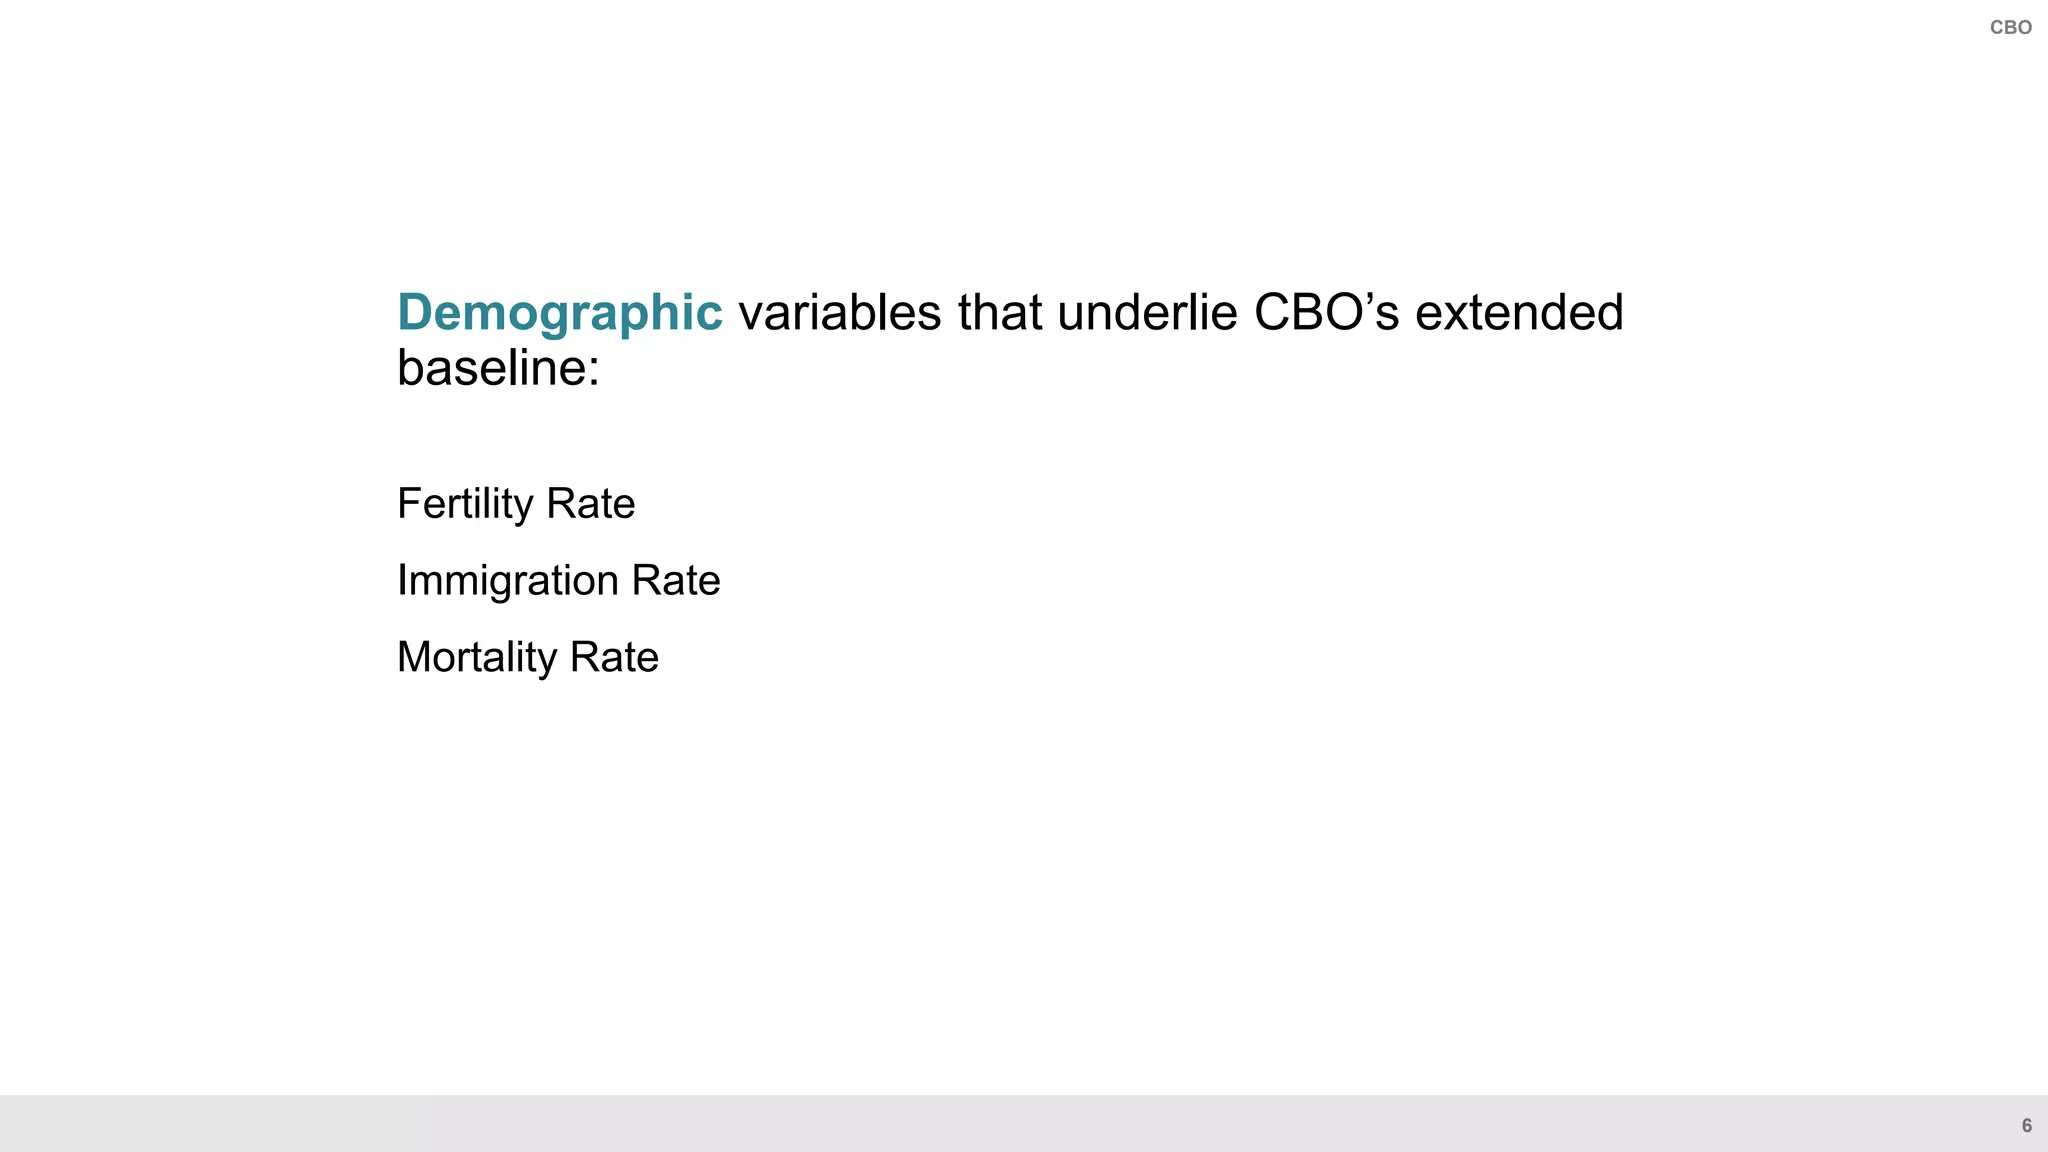
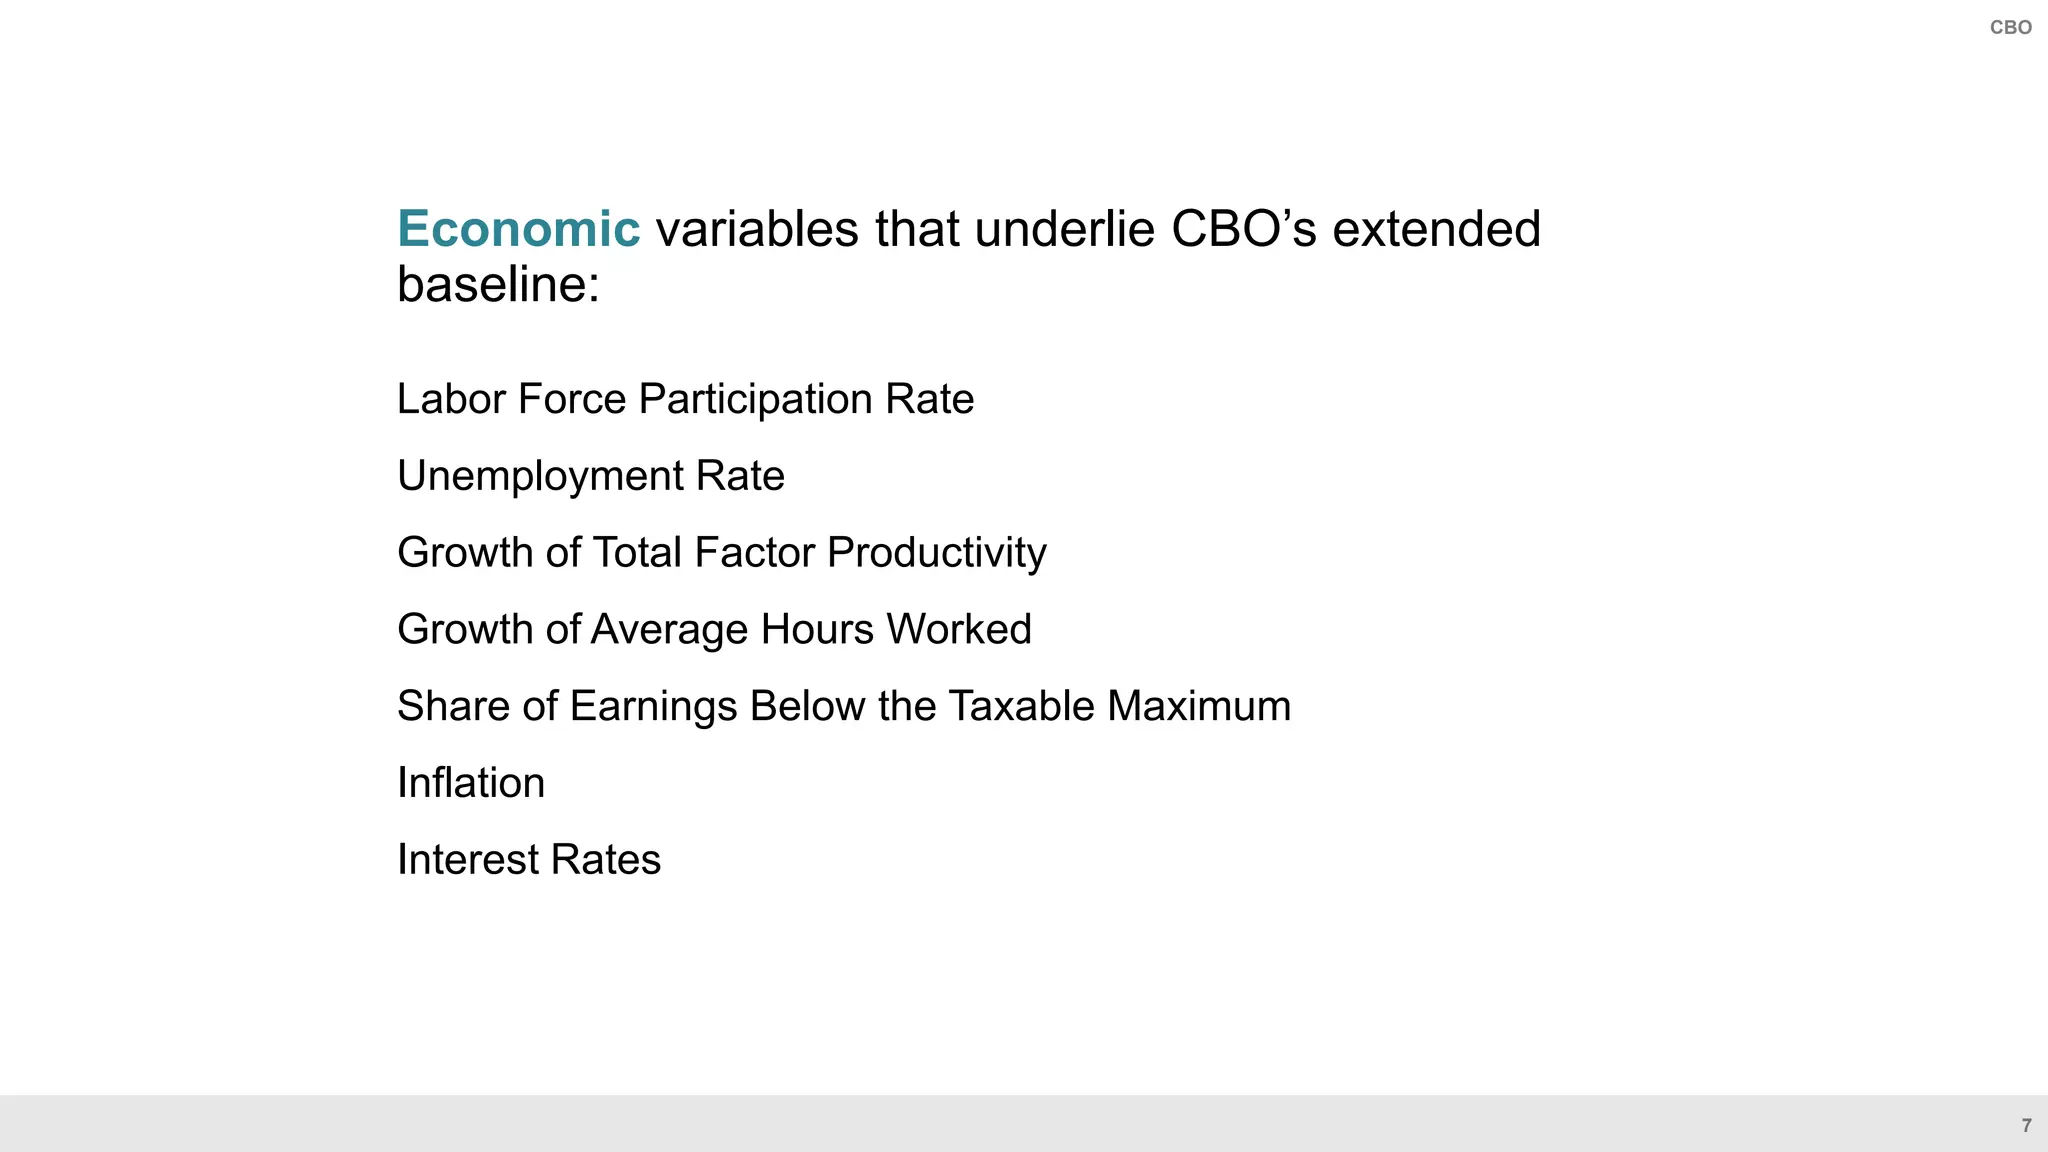


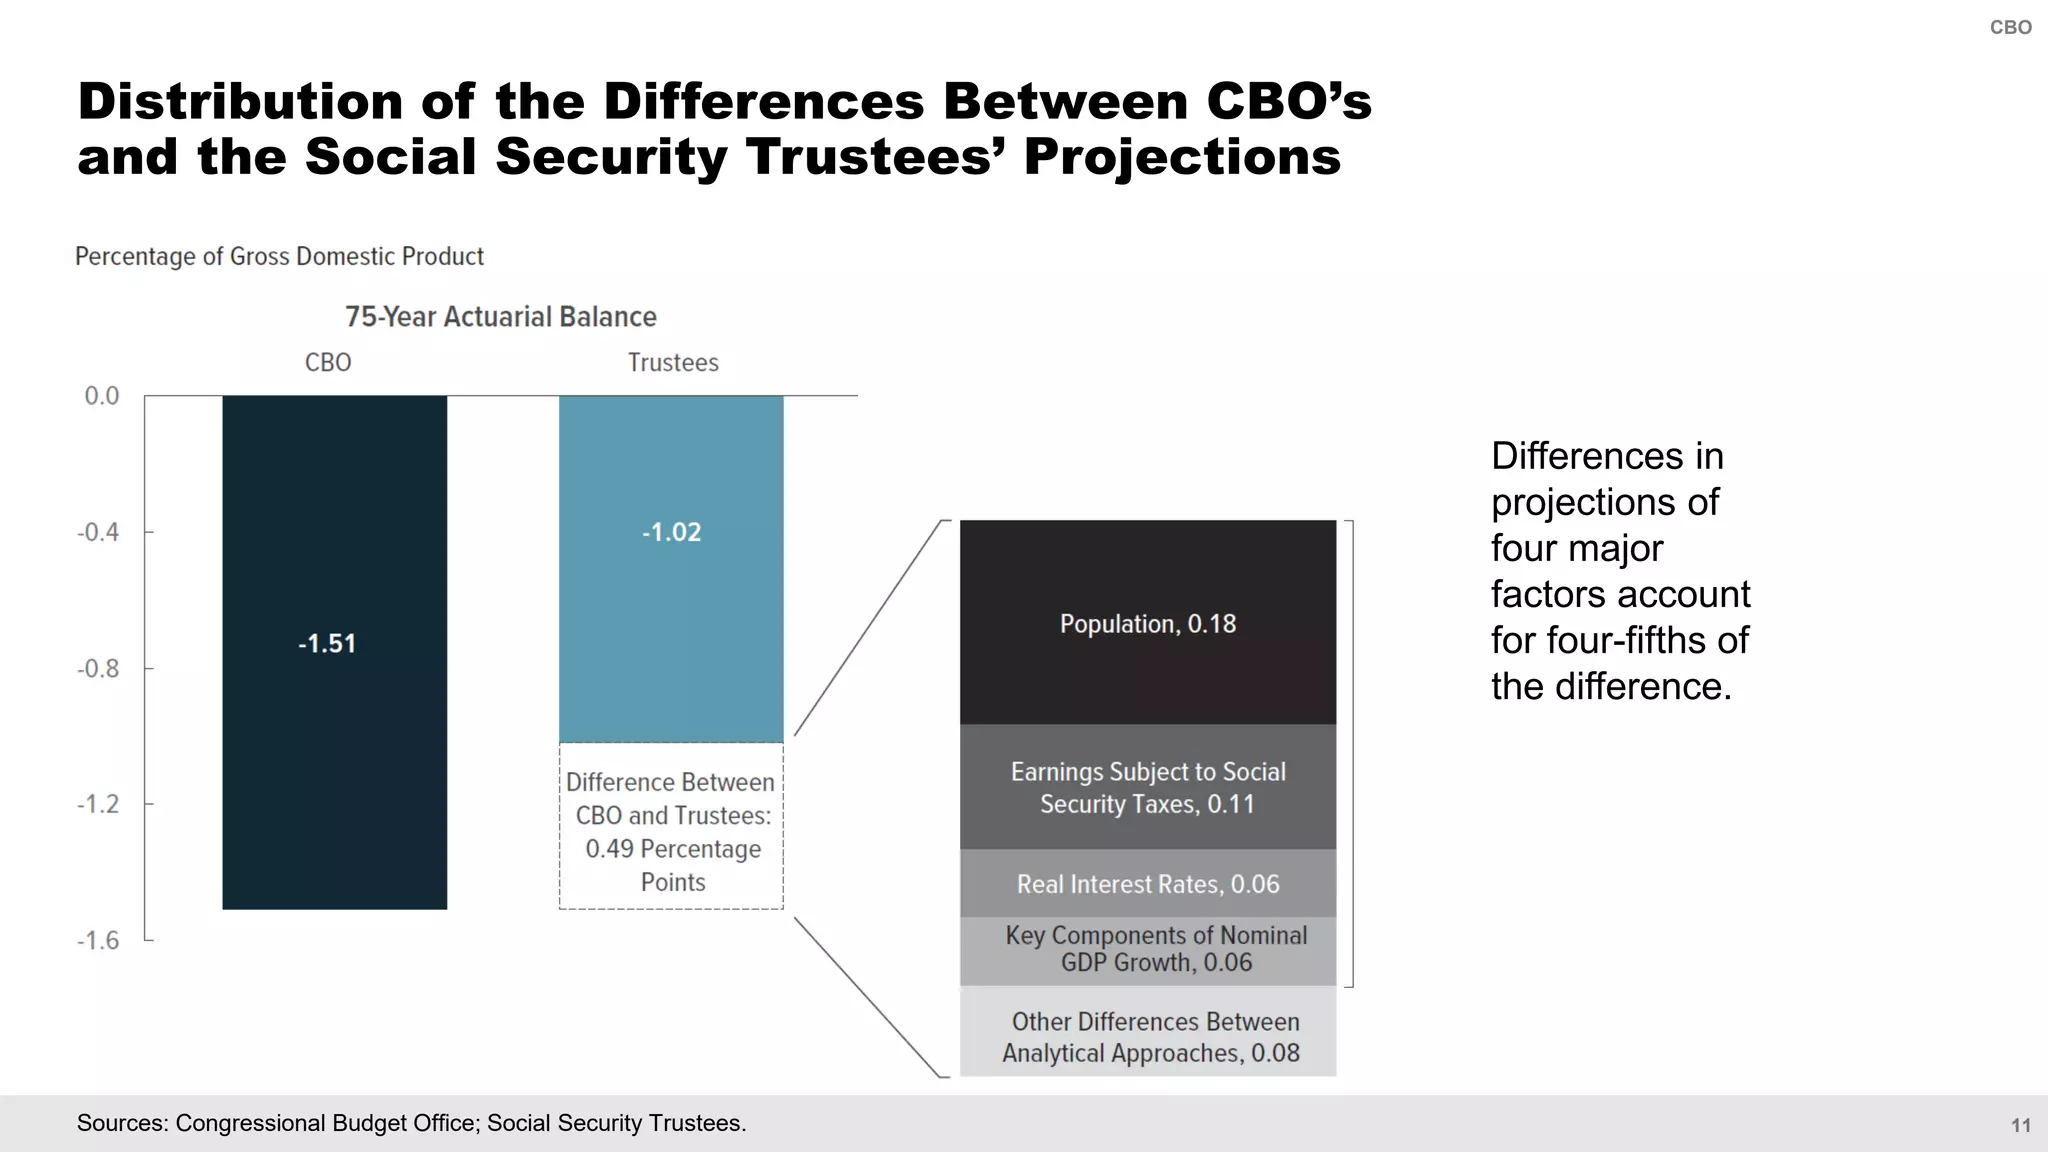


The Congressional Budget Office (CBO) utilizes a detailed microsimulation model to project long-term social security outcomes based on demographic and economic data. Key components of this model include a demographic model, microsimulation model, long-term budget model, and policy growth model, all informed by various historical and forecast sources. Projections are sensitive to inputs like population changes and earnings subject to social security taxes, with significant differences arising from these factors compared to Social Security trustees' projections.


