Download to read offline
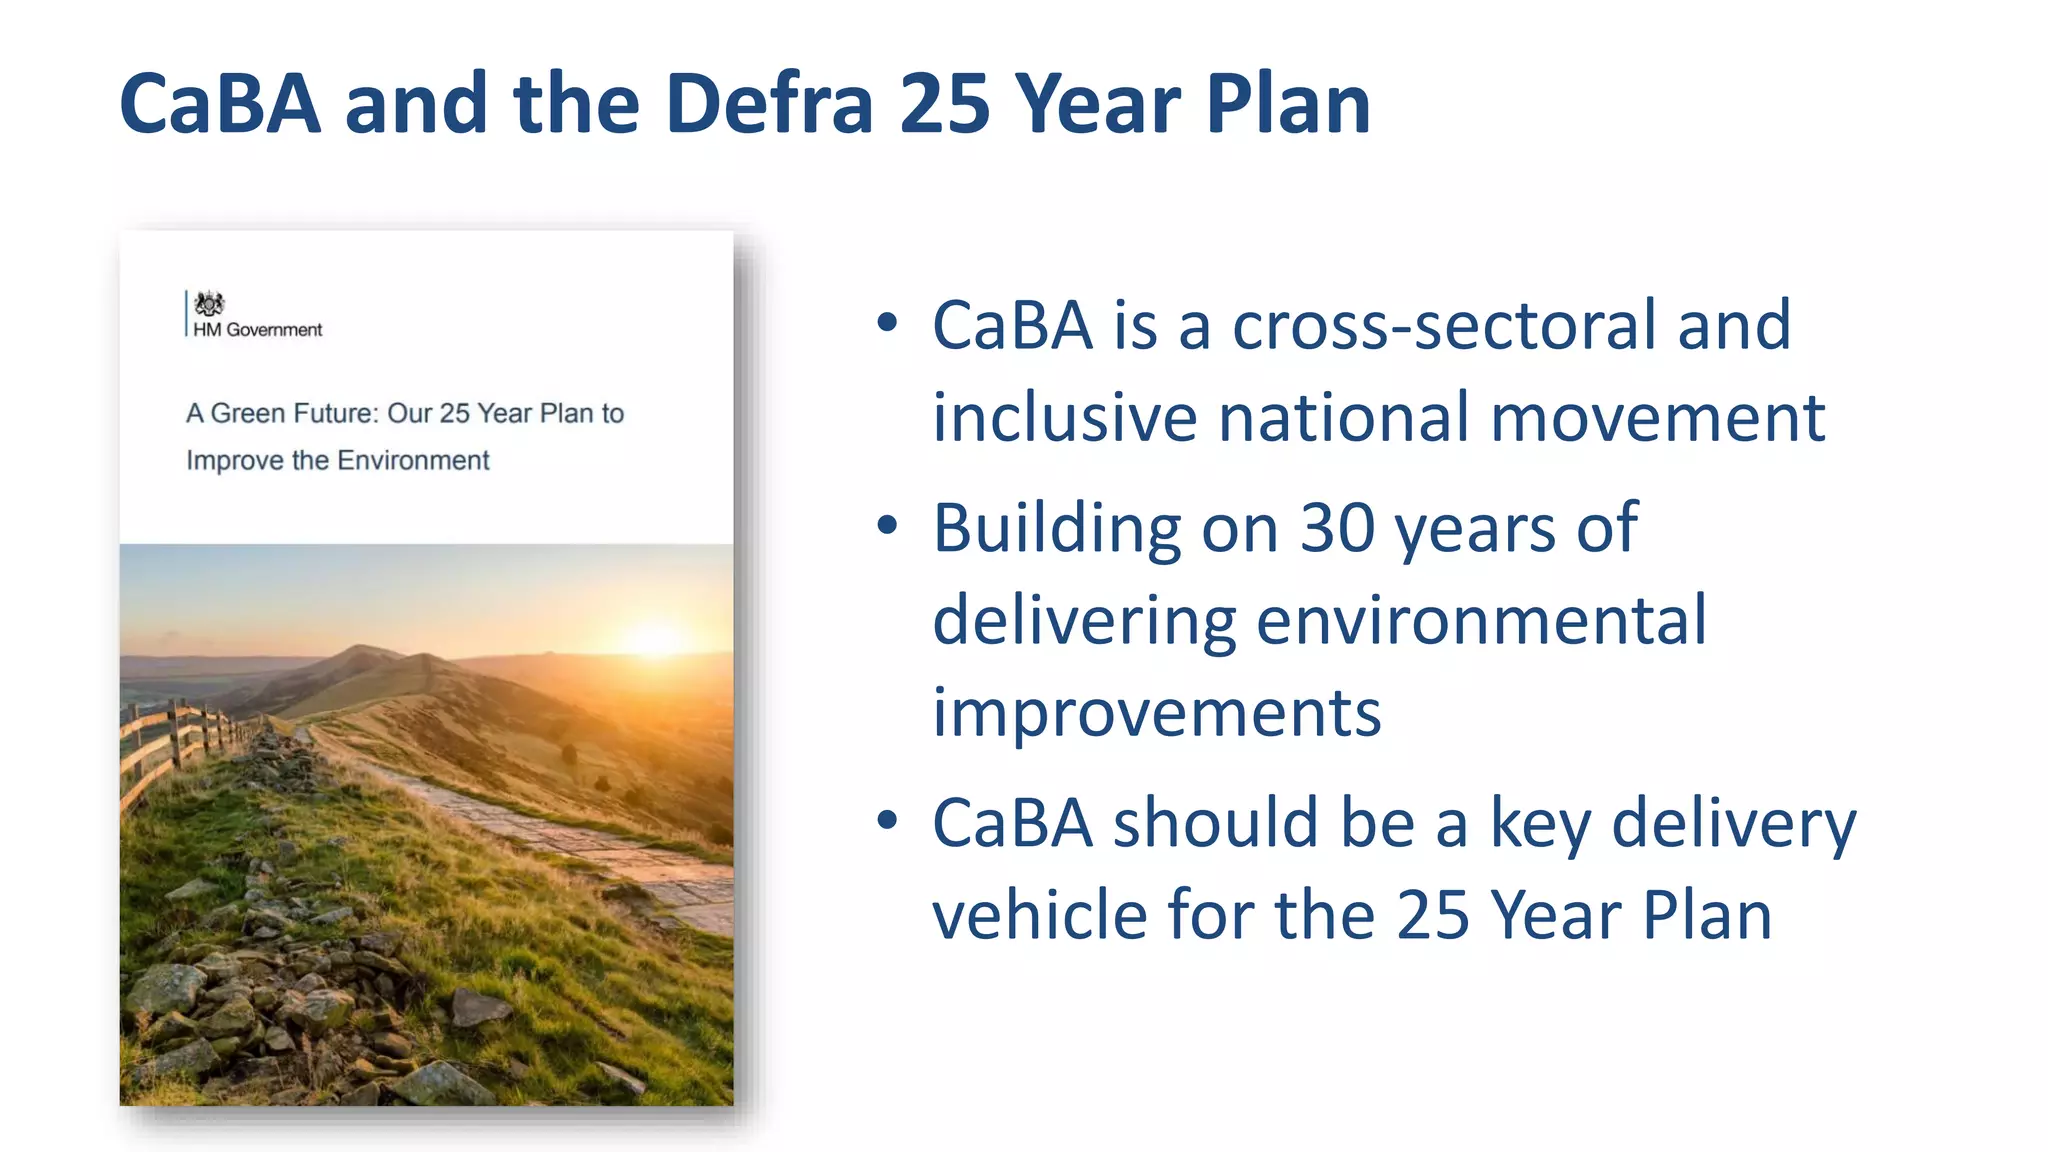
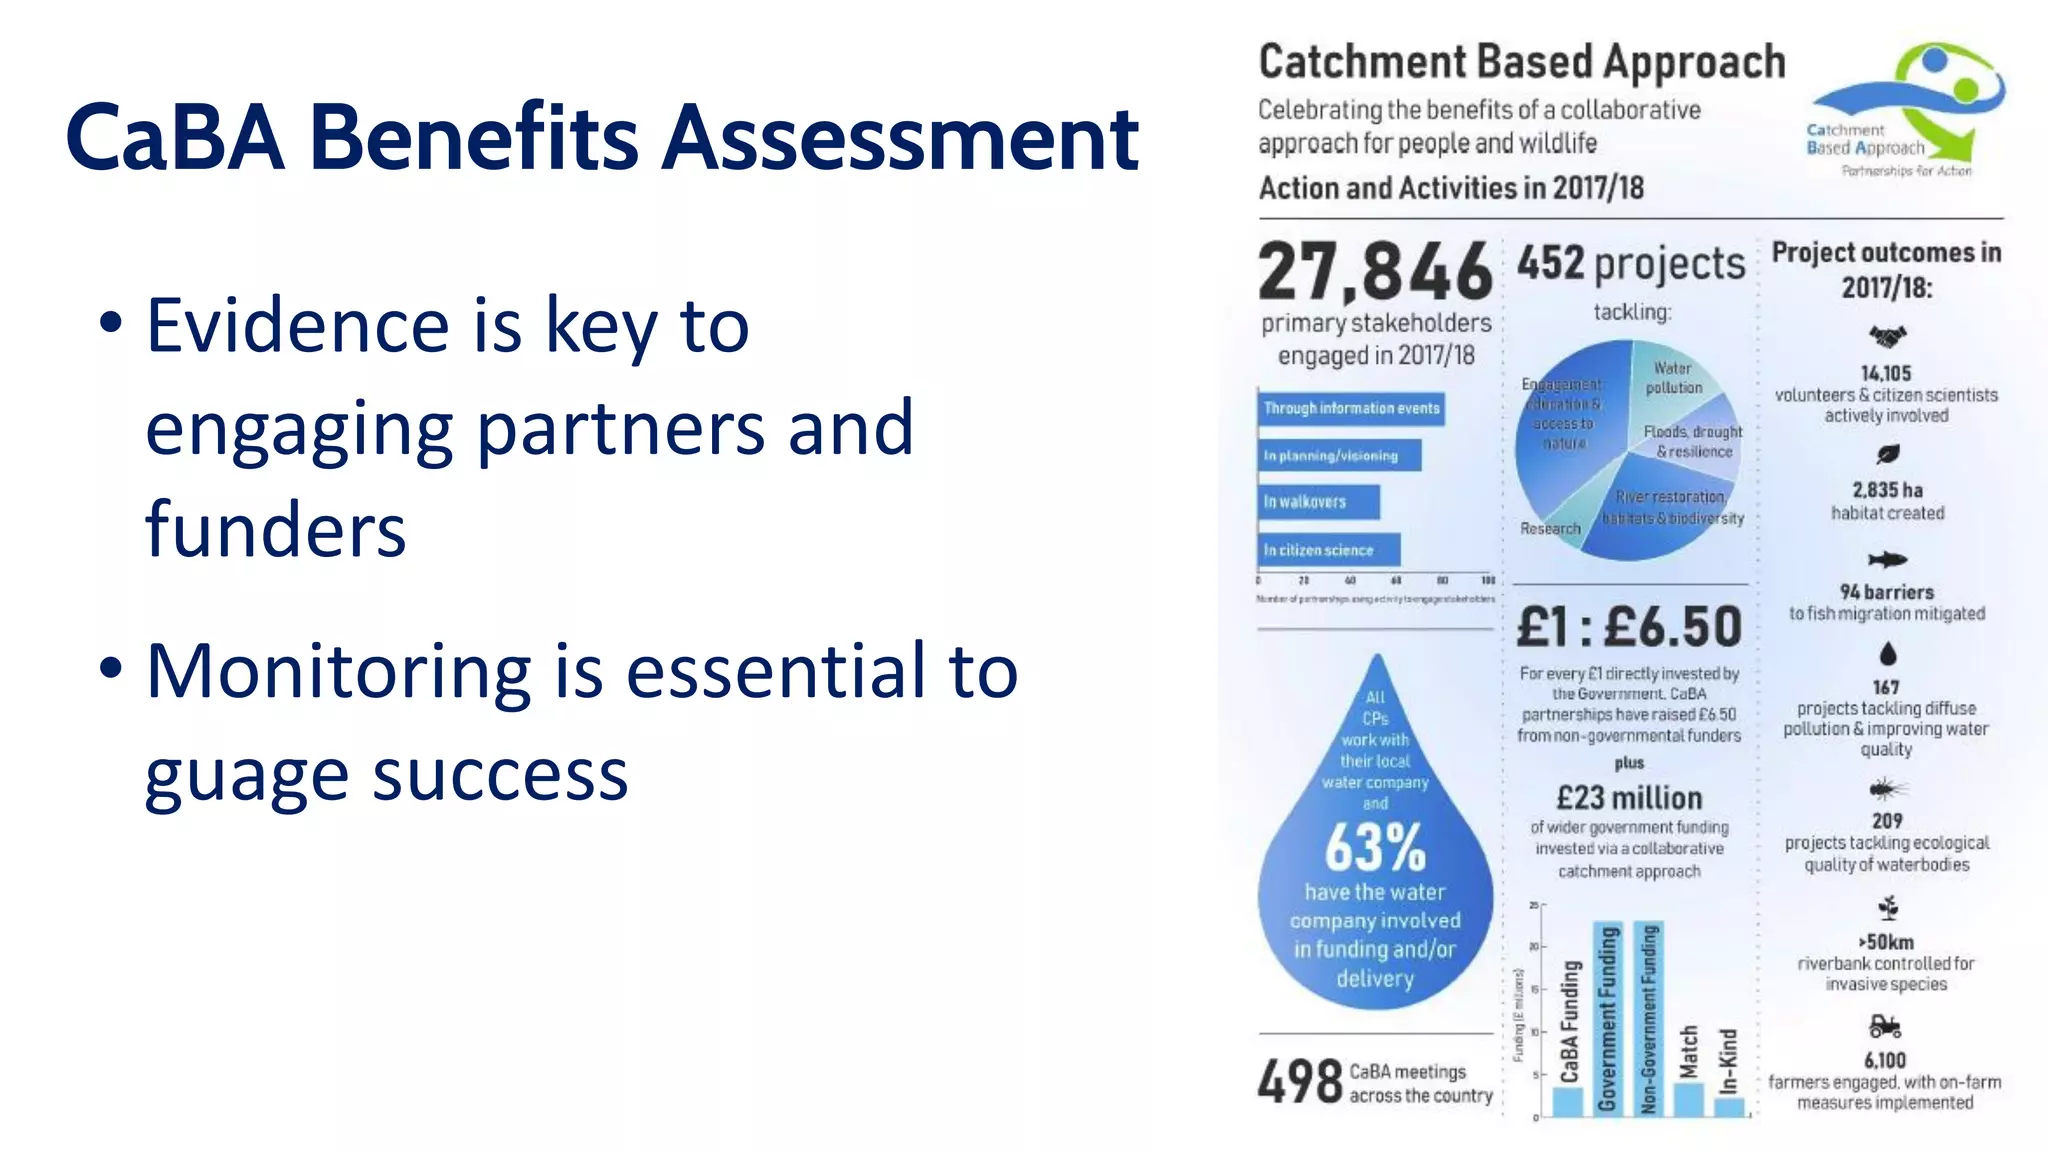
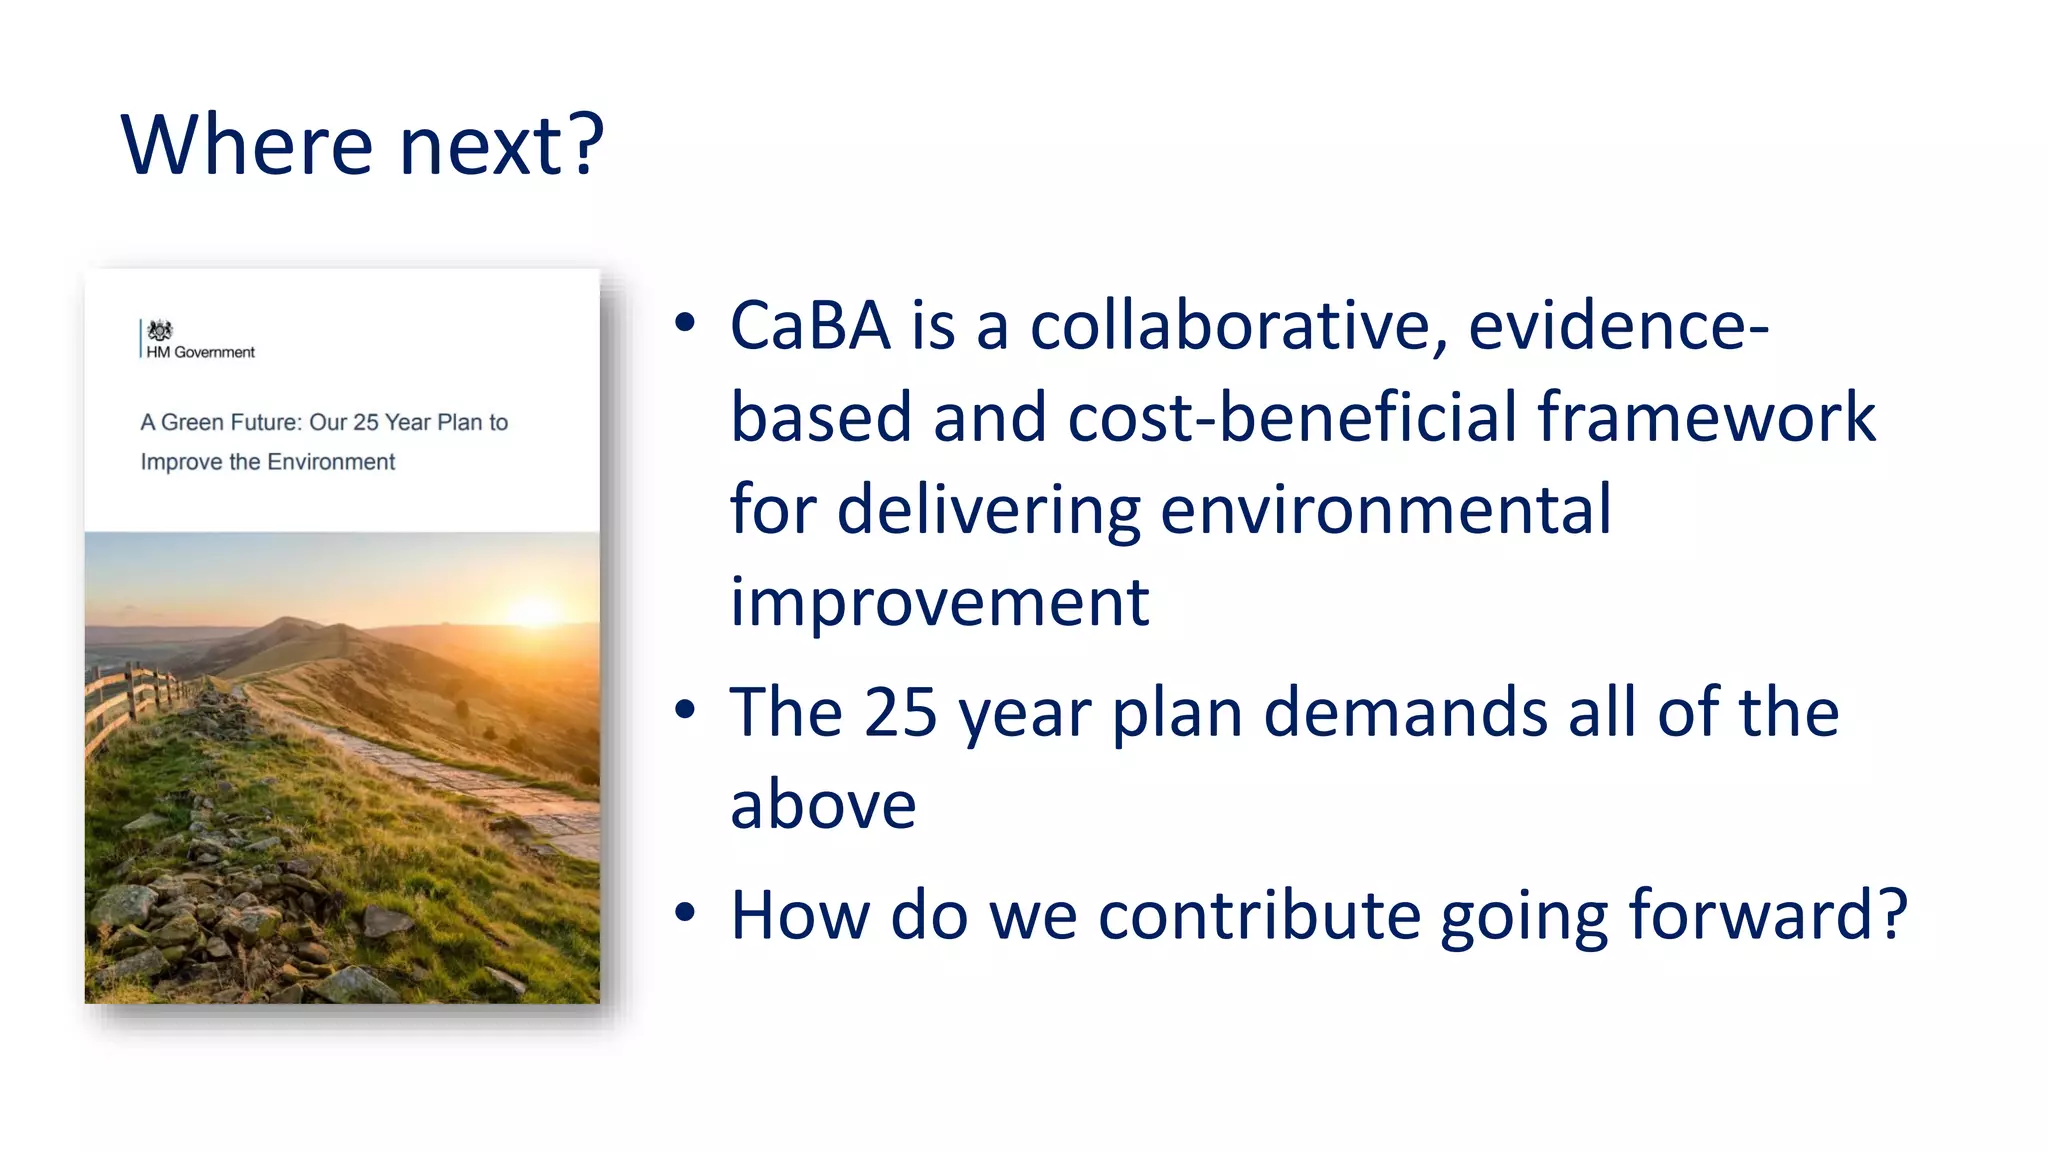
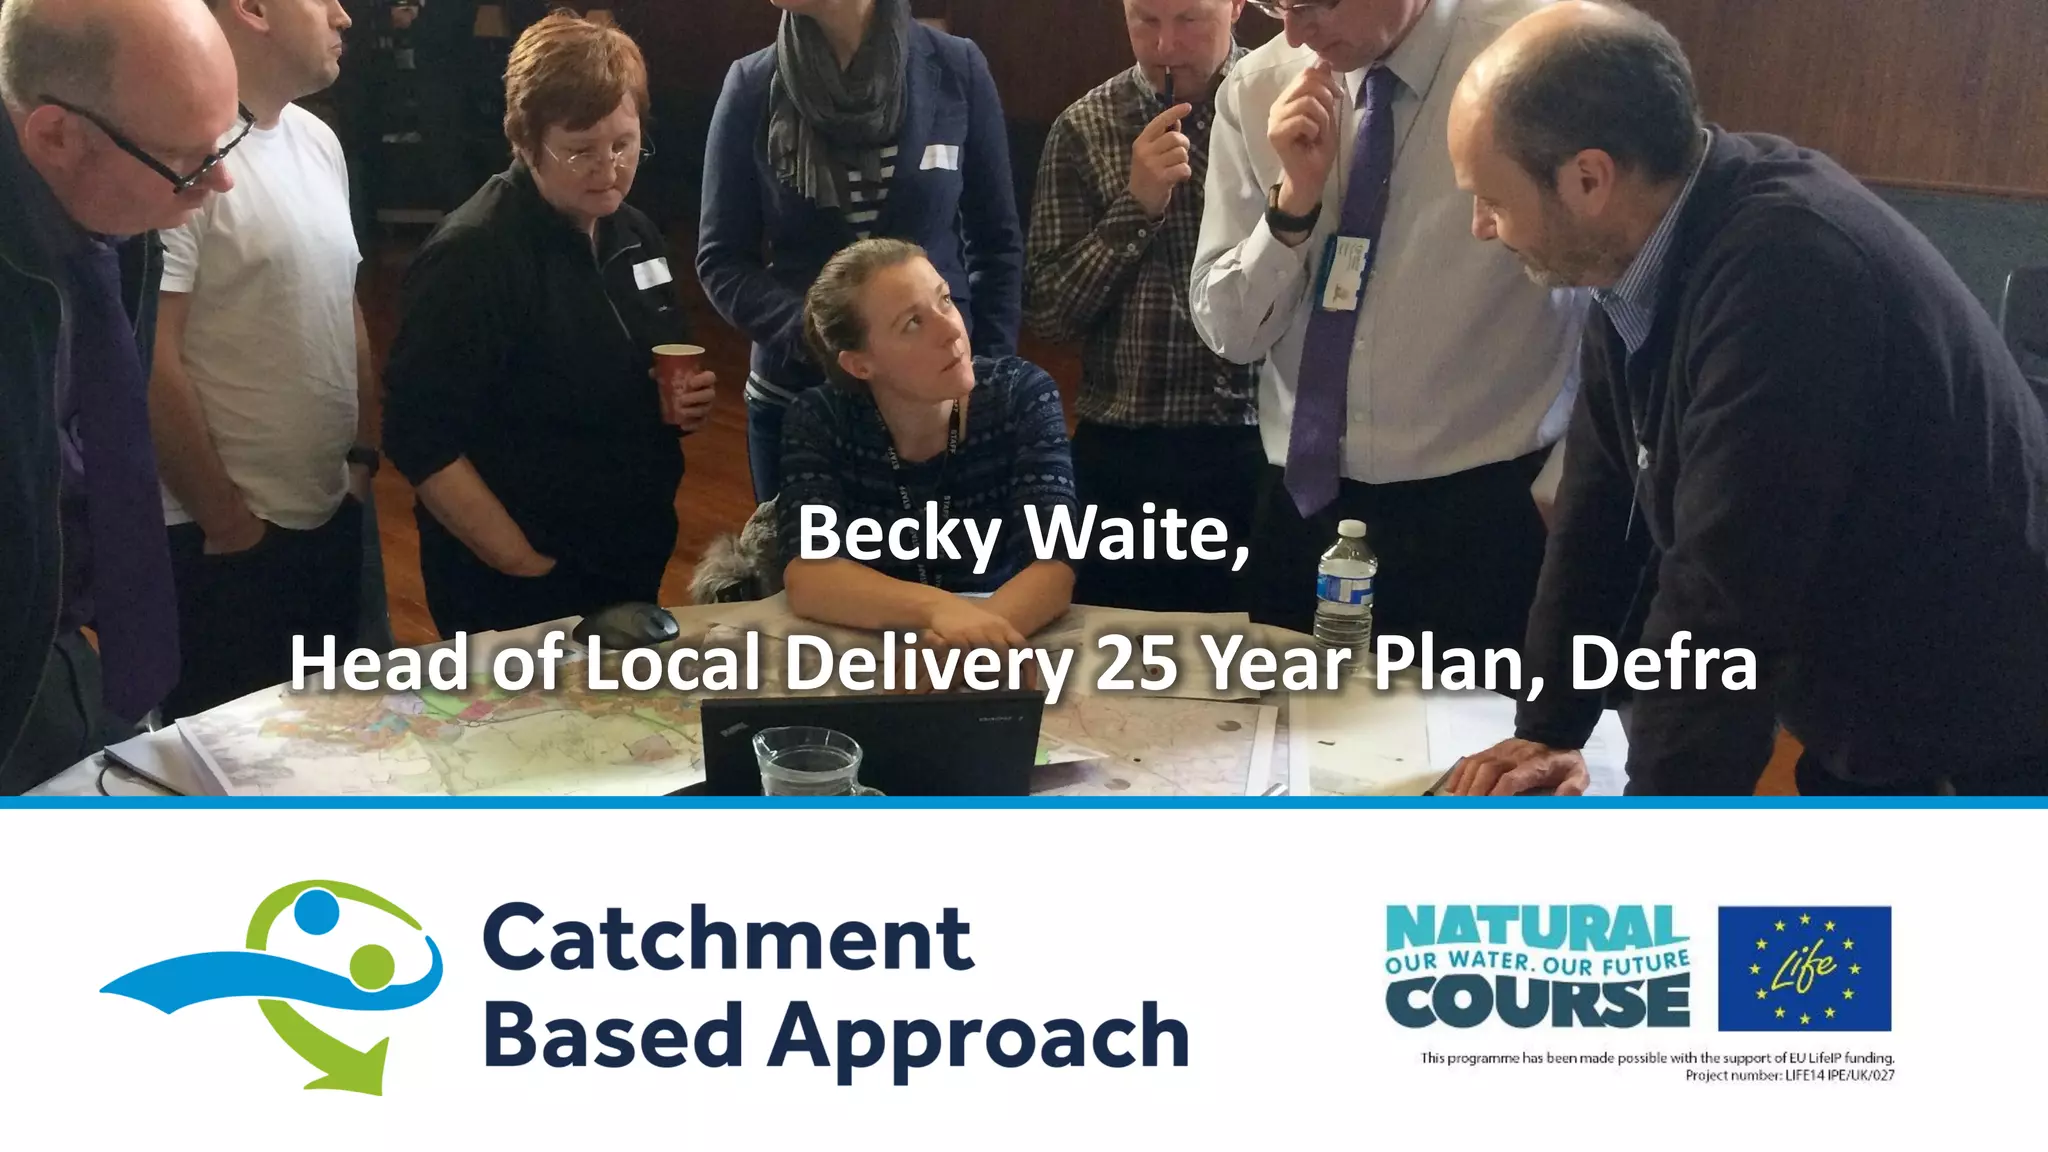


The document outlines the Catchment Data & Evidence Forum held on September 27, 2018, discussing collaboration in delivery of the UK's 25 Year Environment Plan. Key topics included catchment management, sharing knowledge, and the framework of CABA's initiatives to improve environmental outcomes through evidence-based approaches. The goal is to enhance local natural capital planning and facilitate stakeholder engagement for better environmental stewardship.


