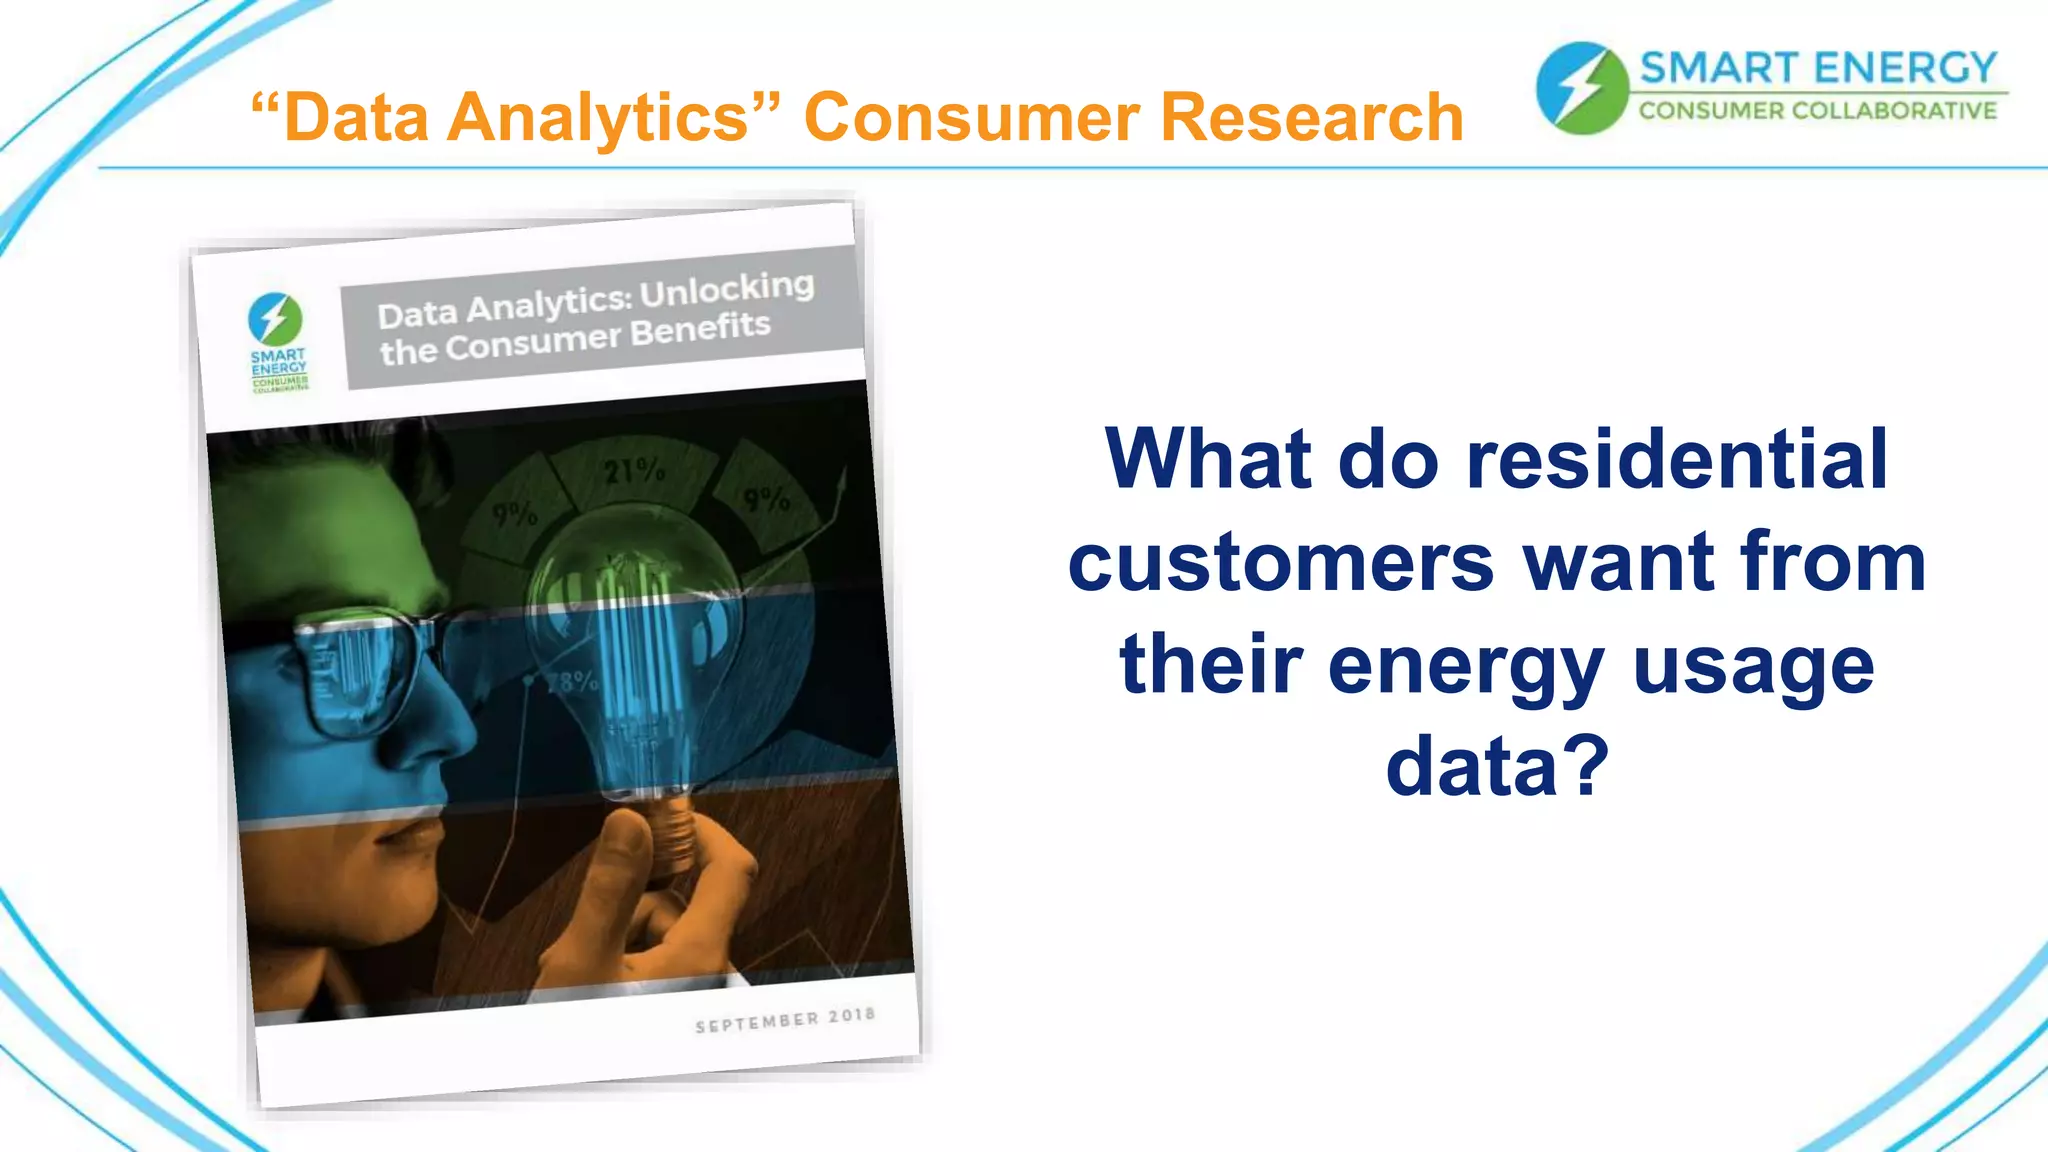
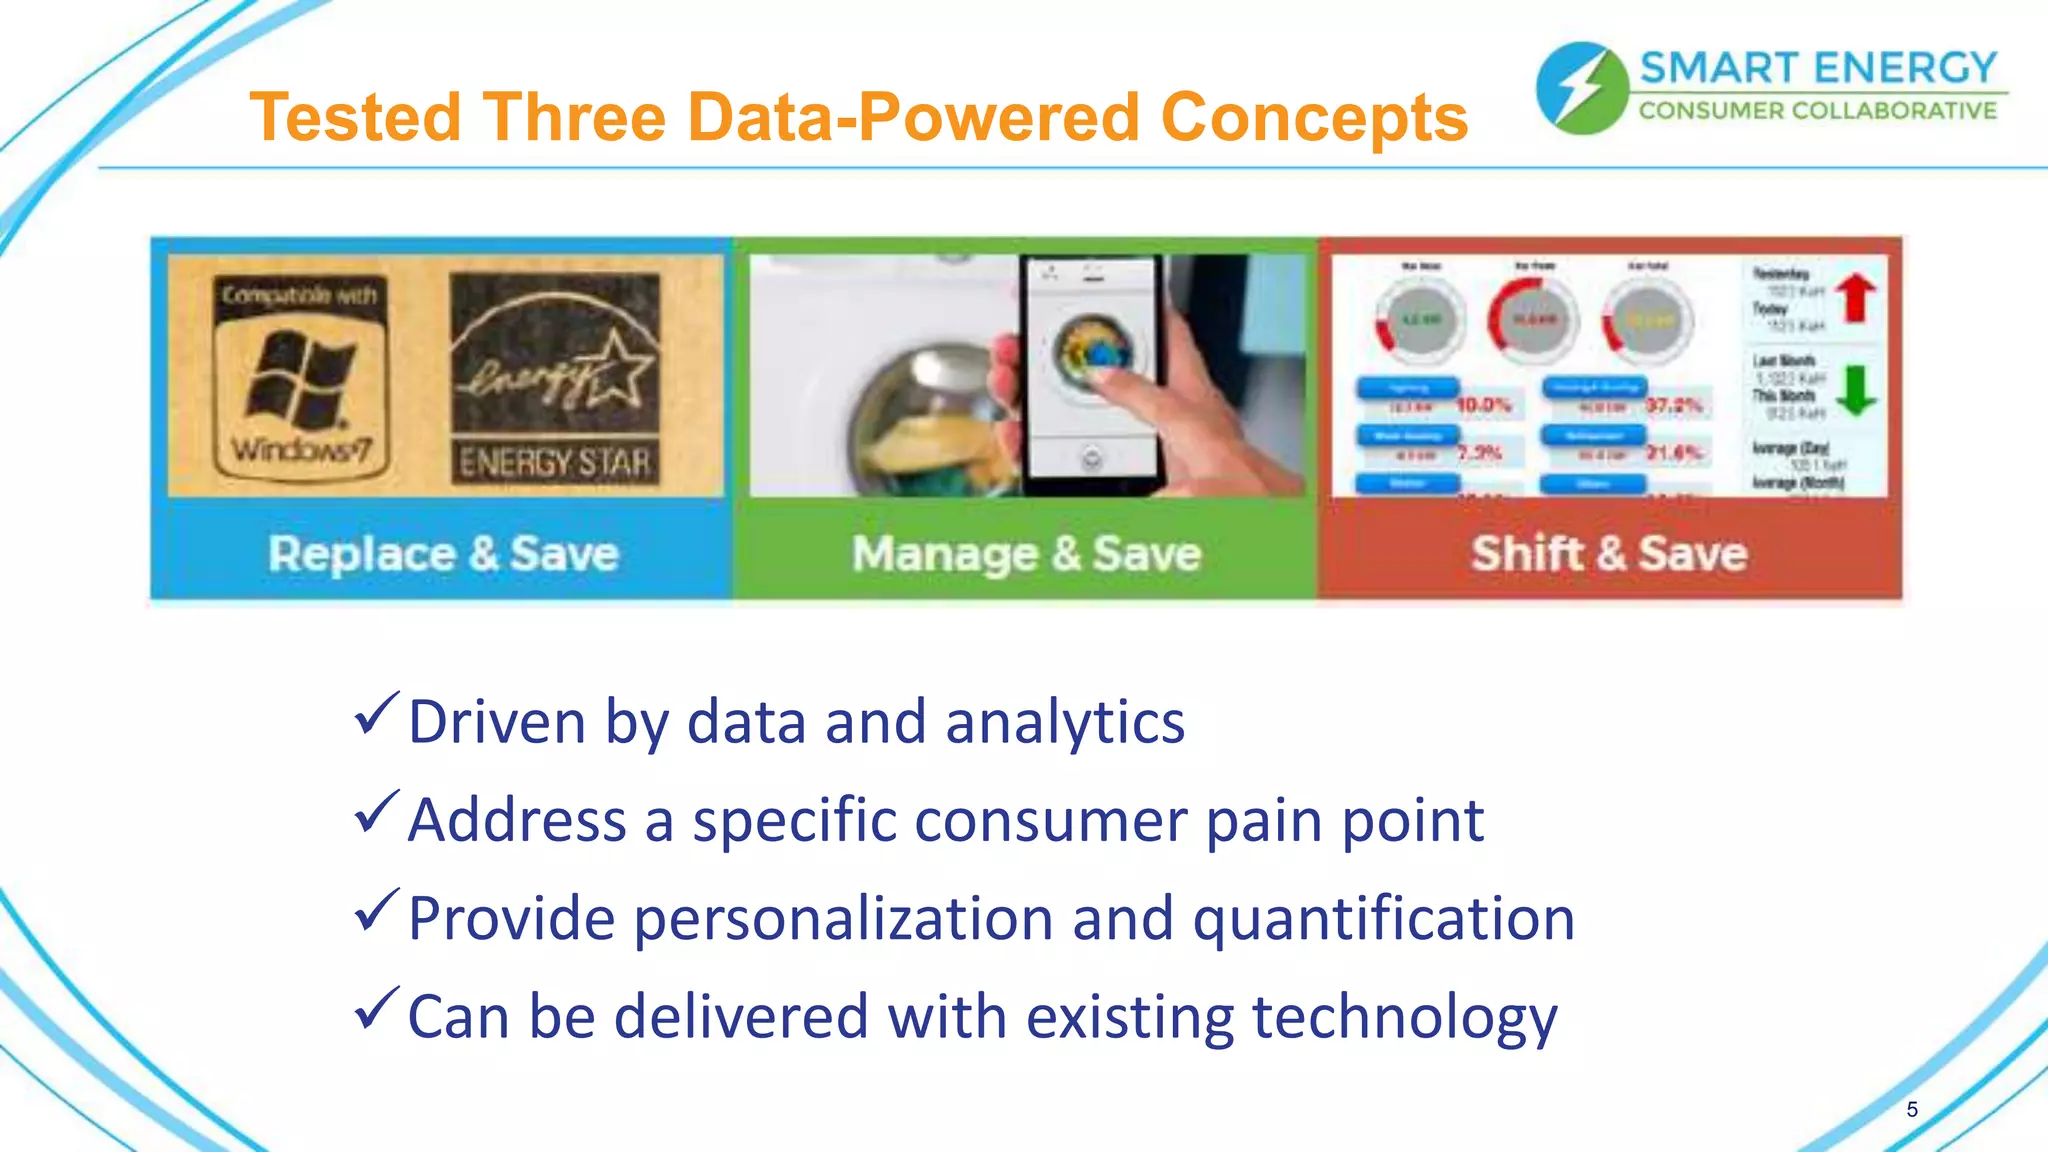
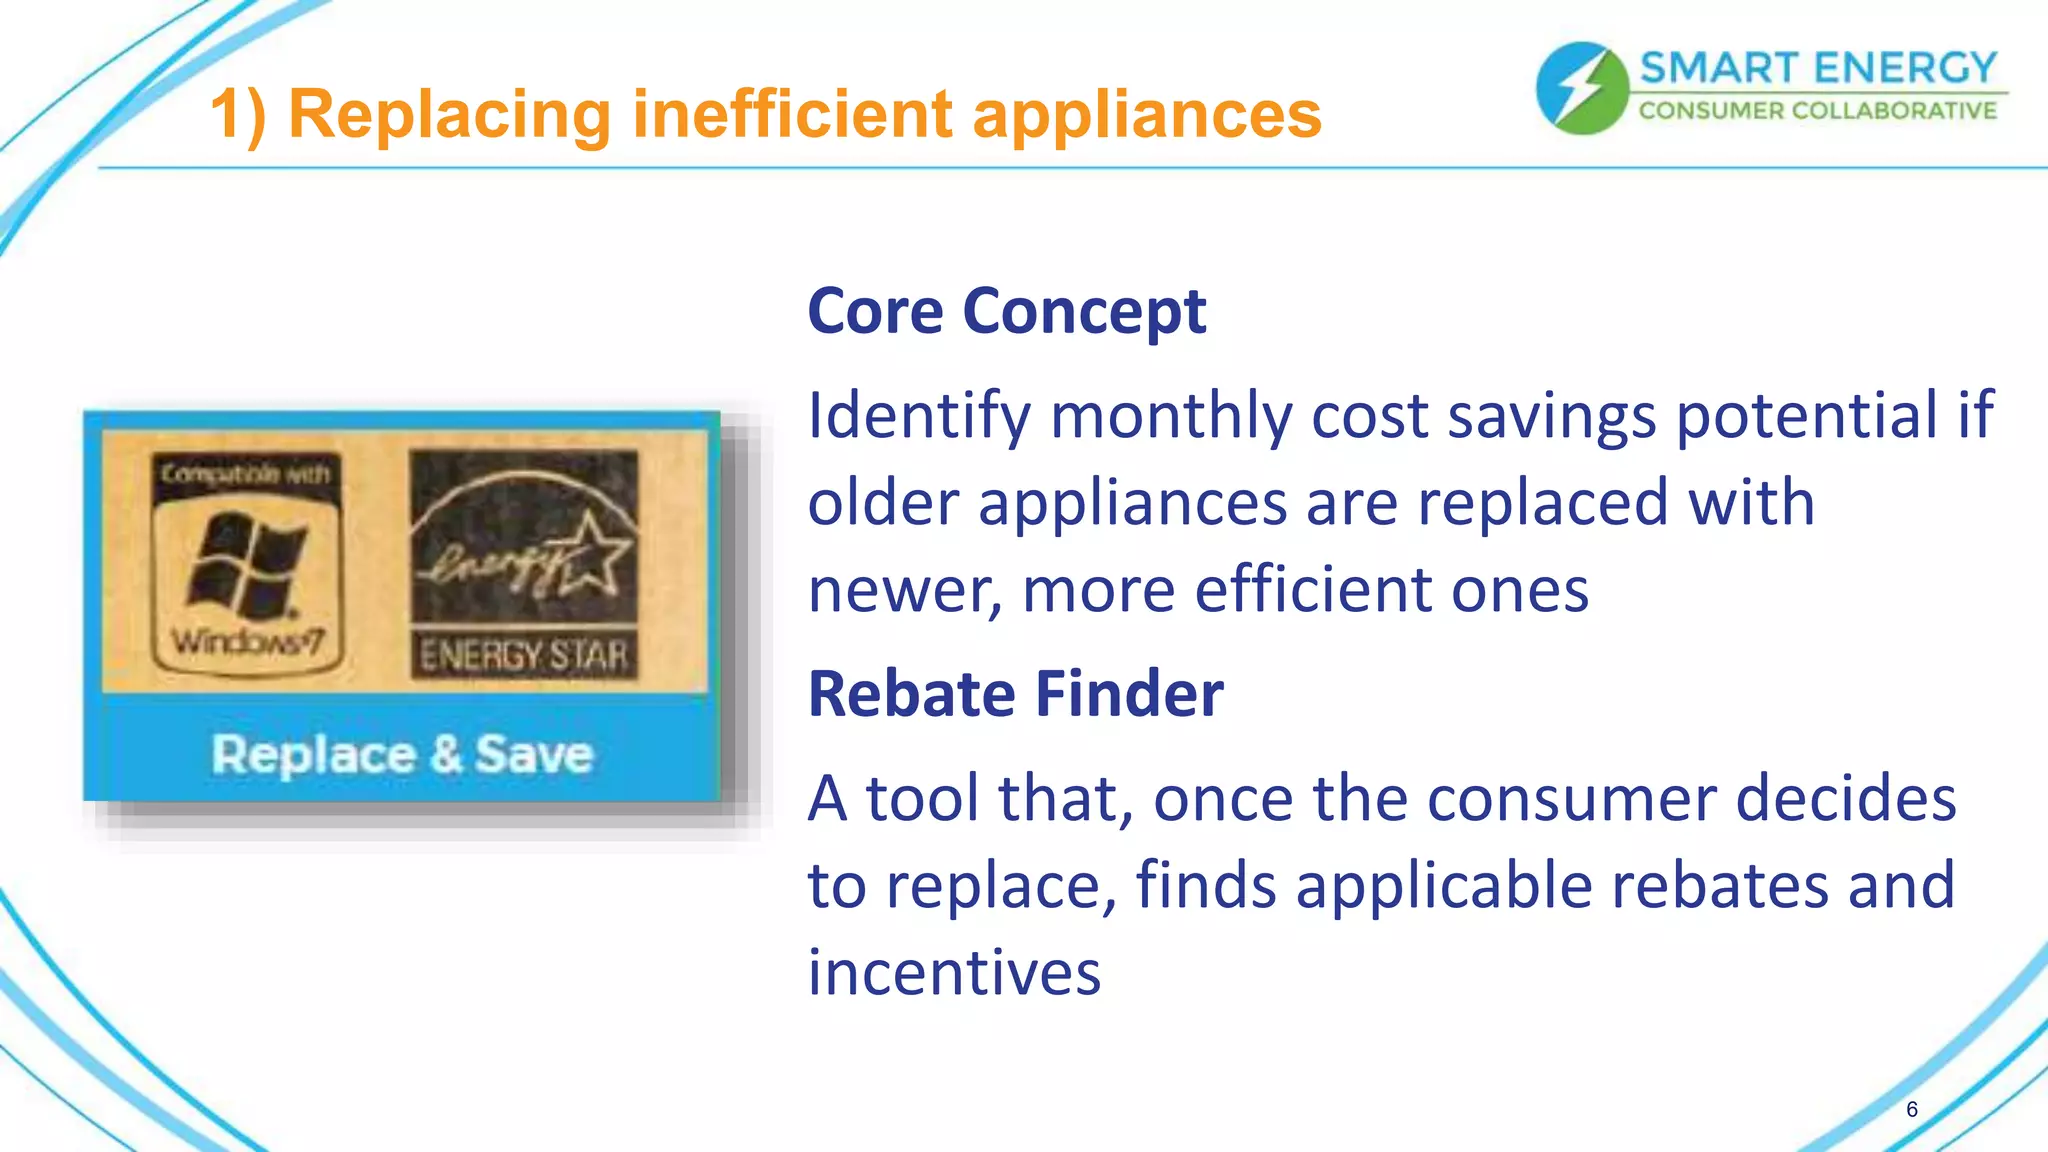
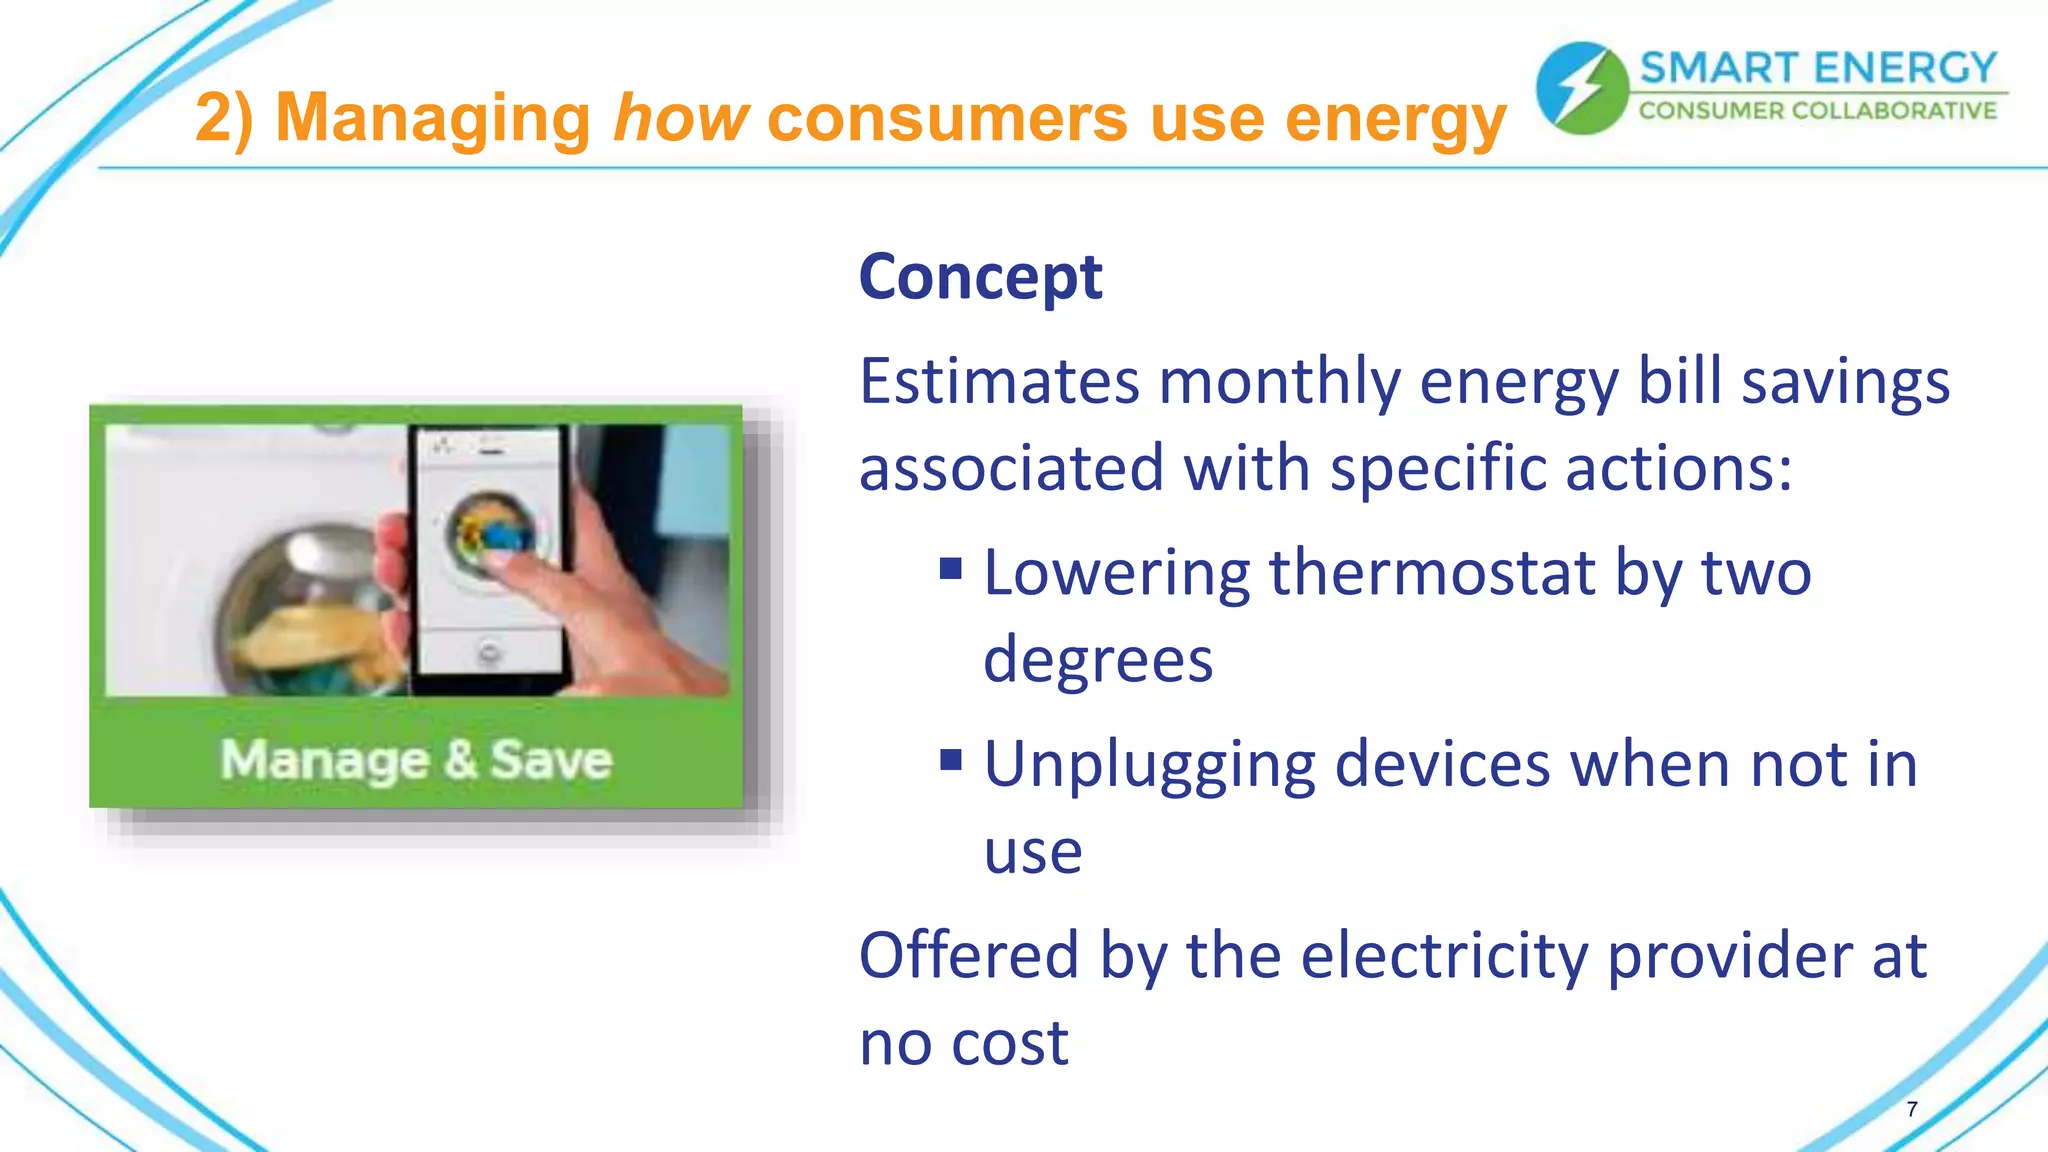
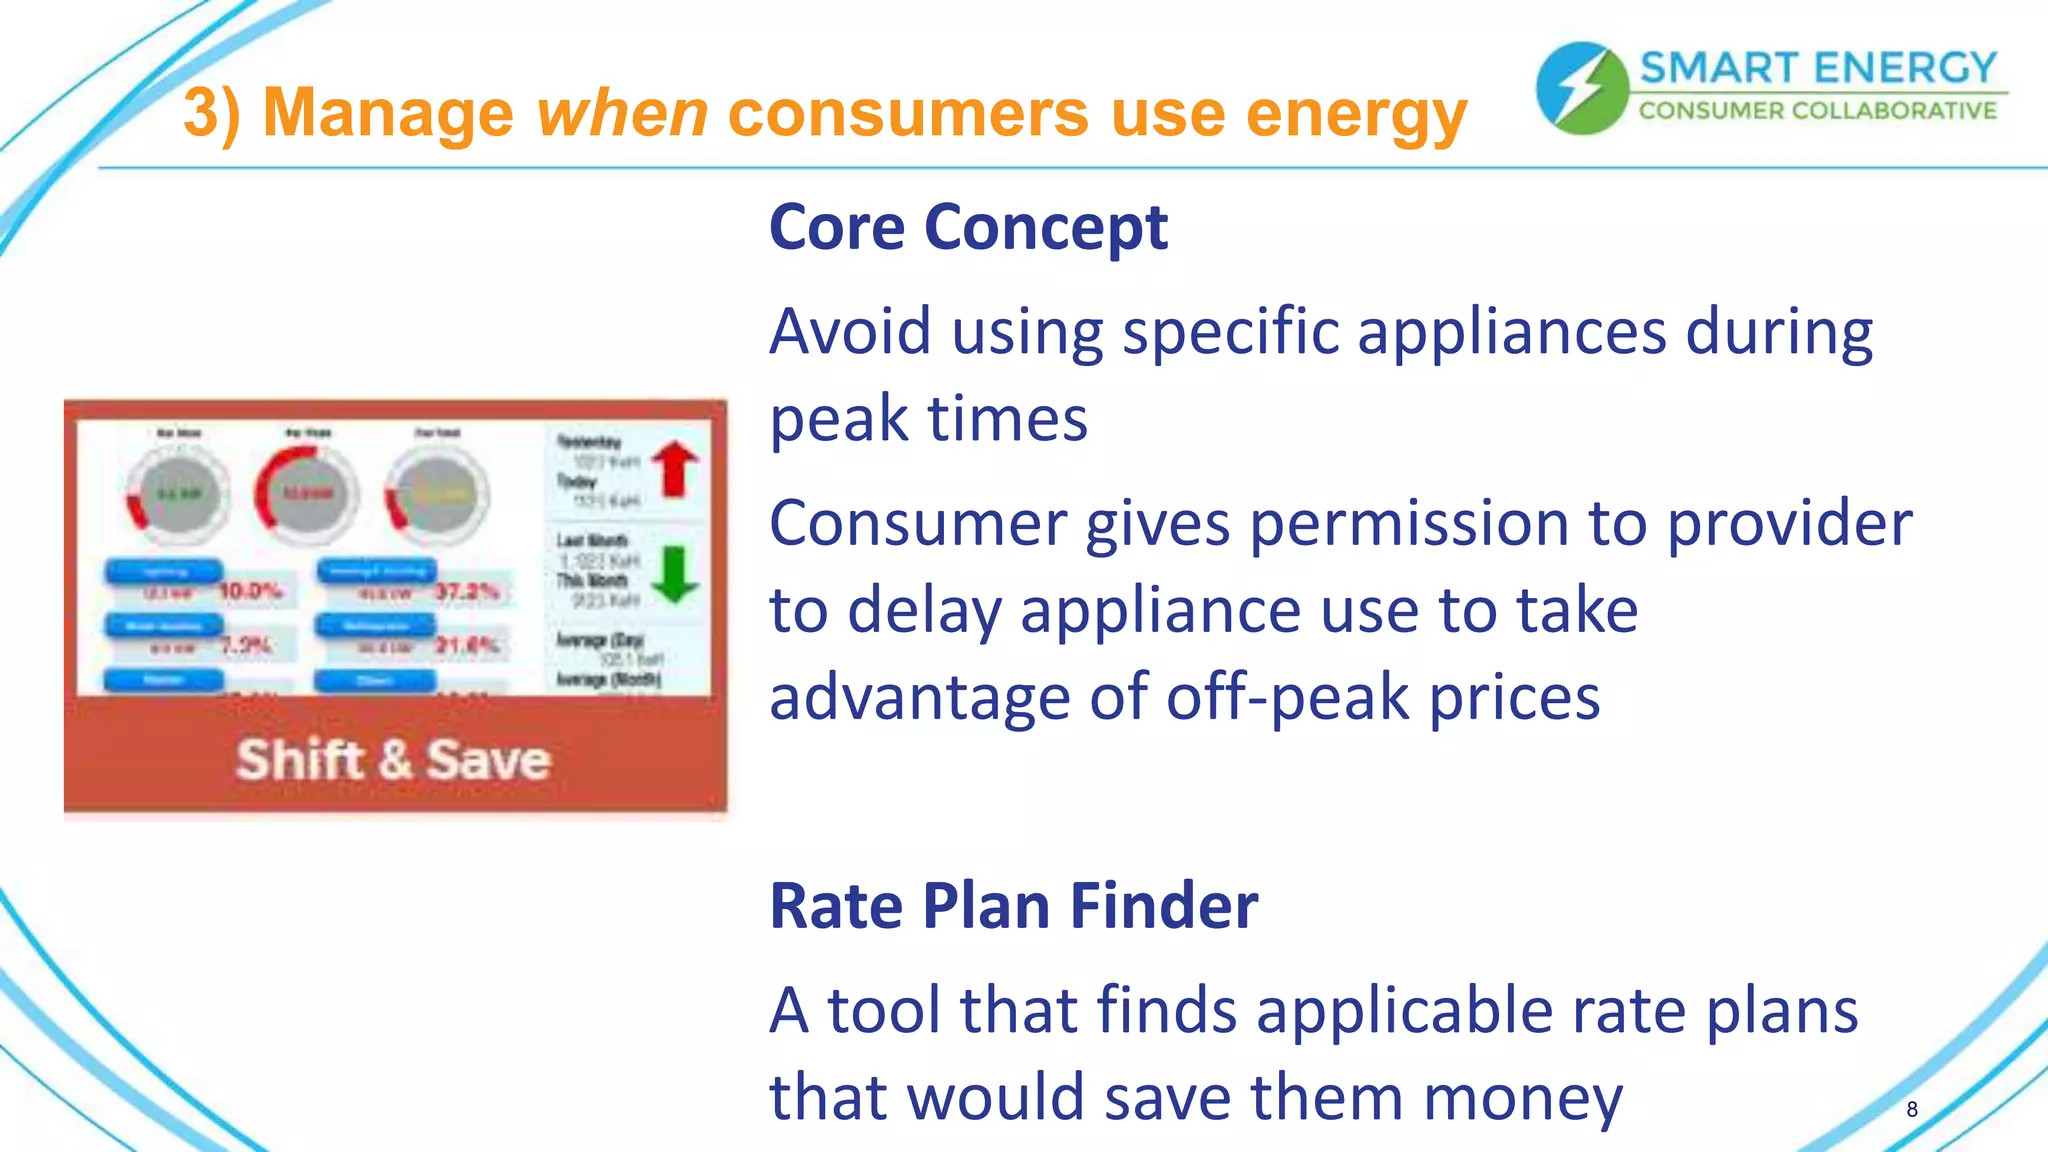
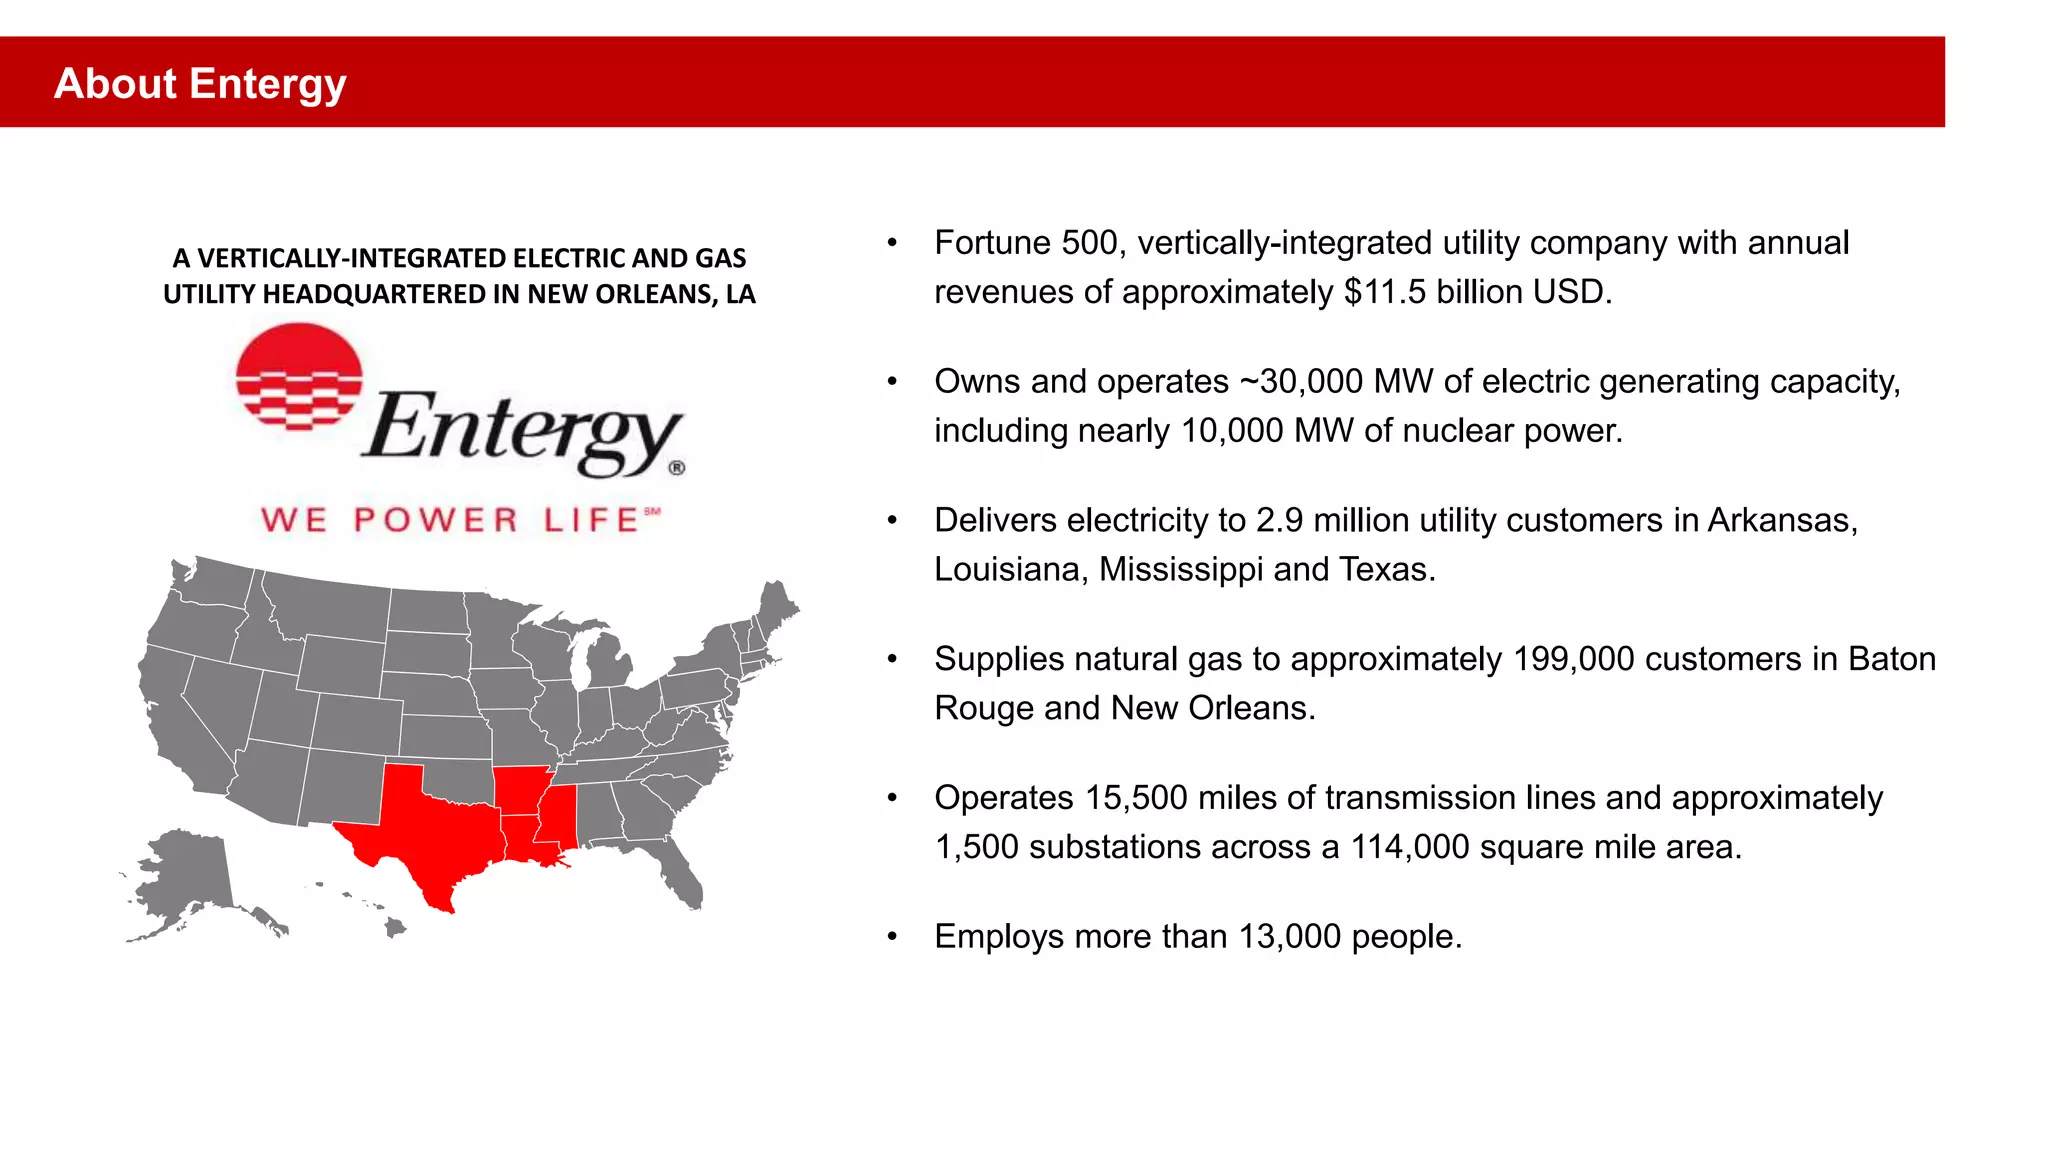
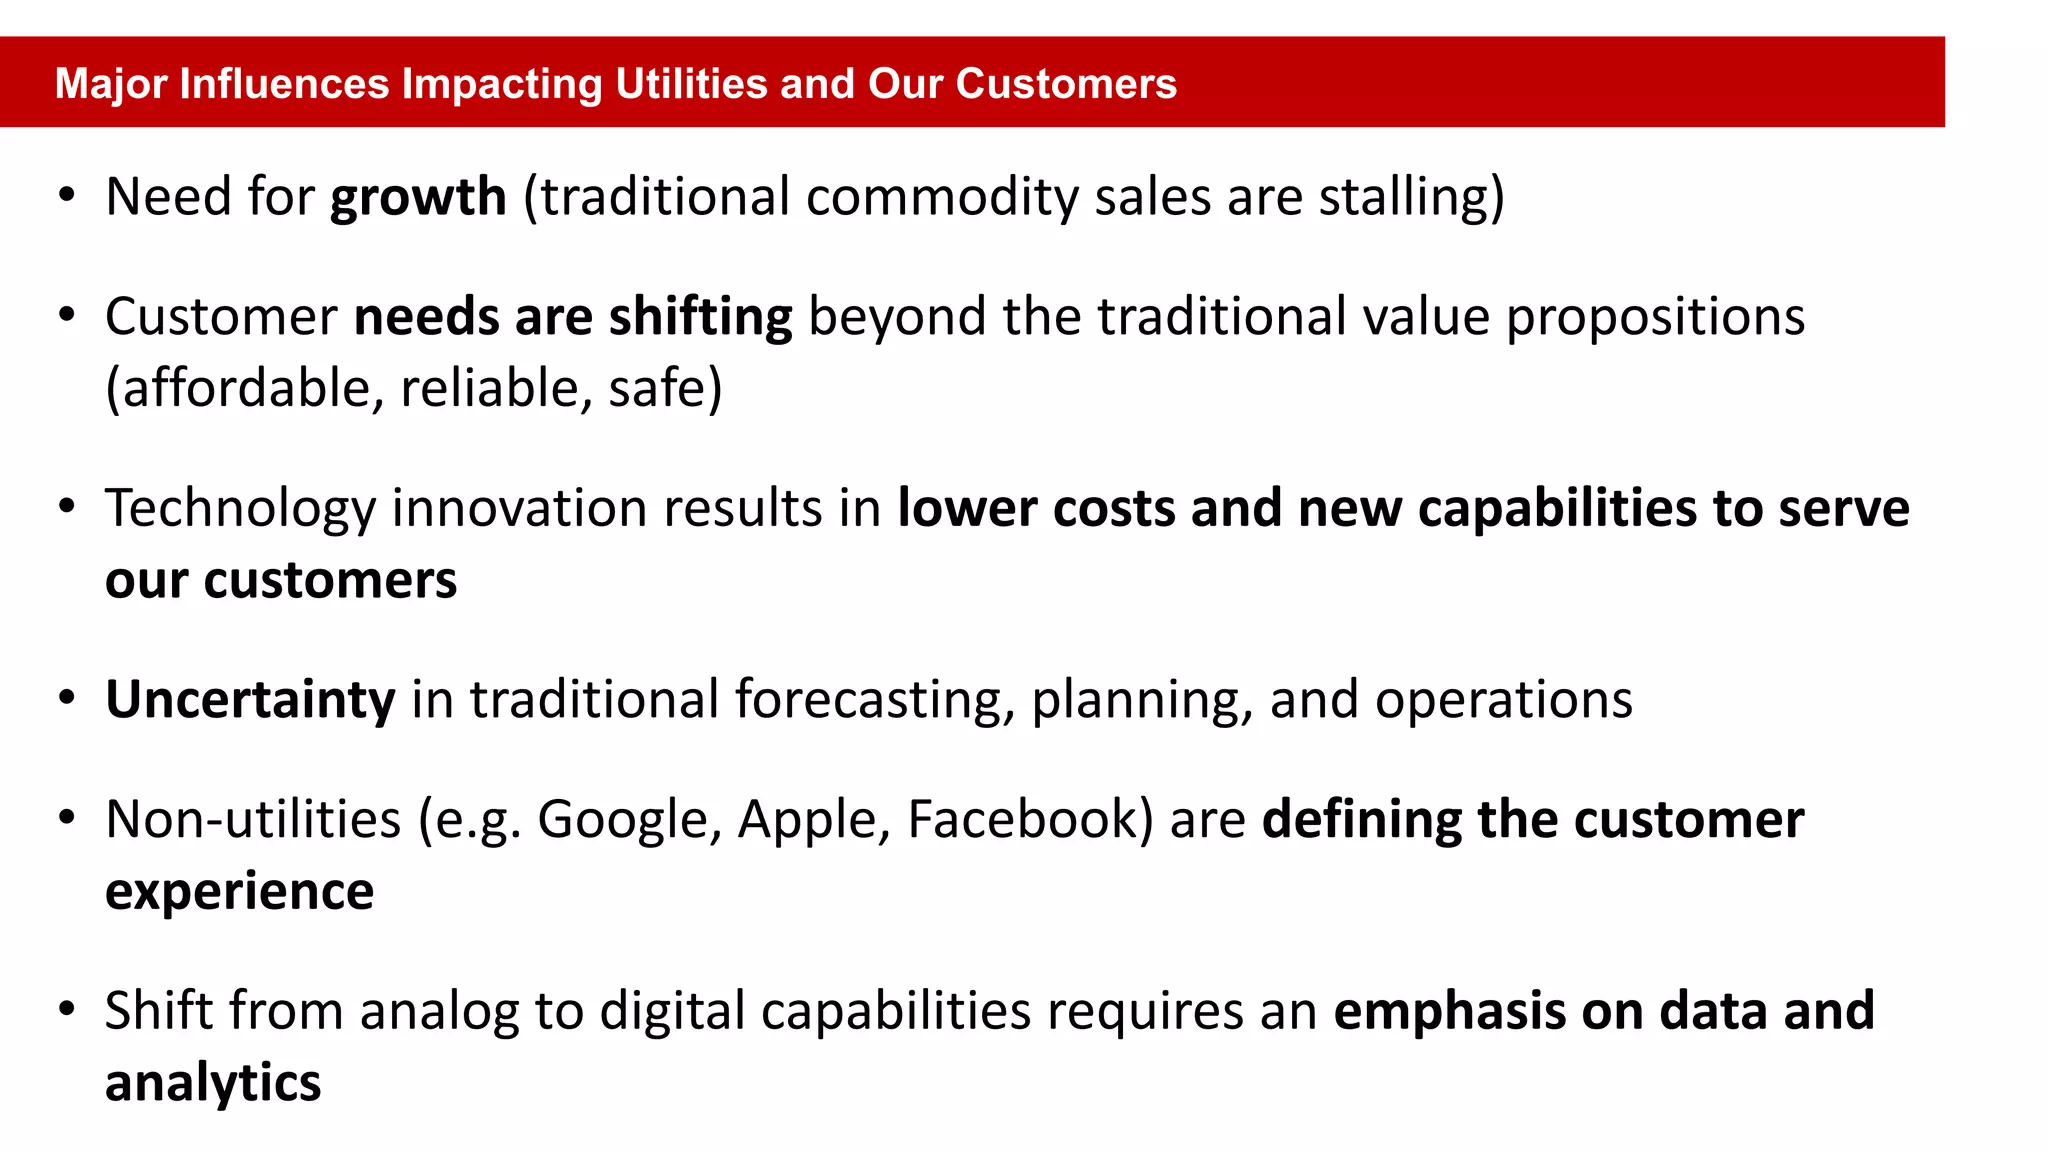
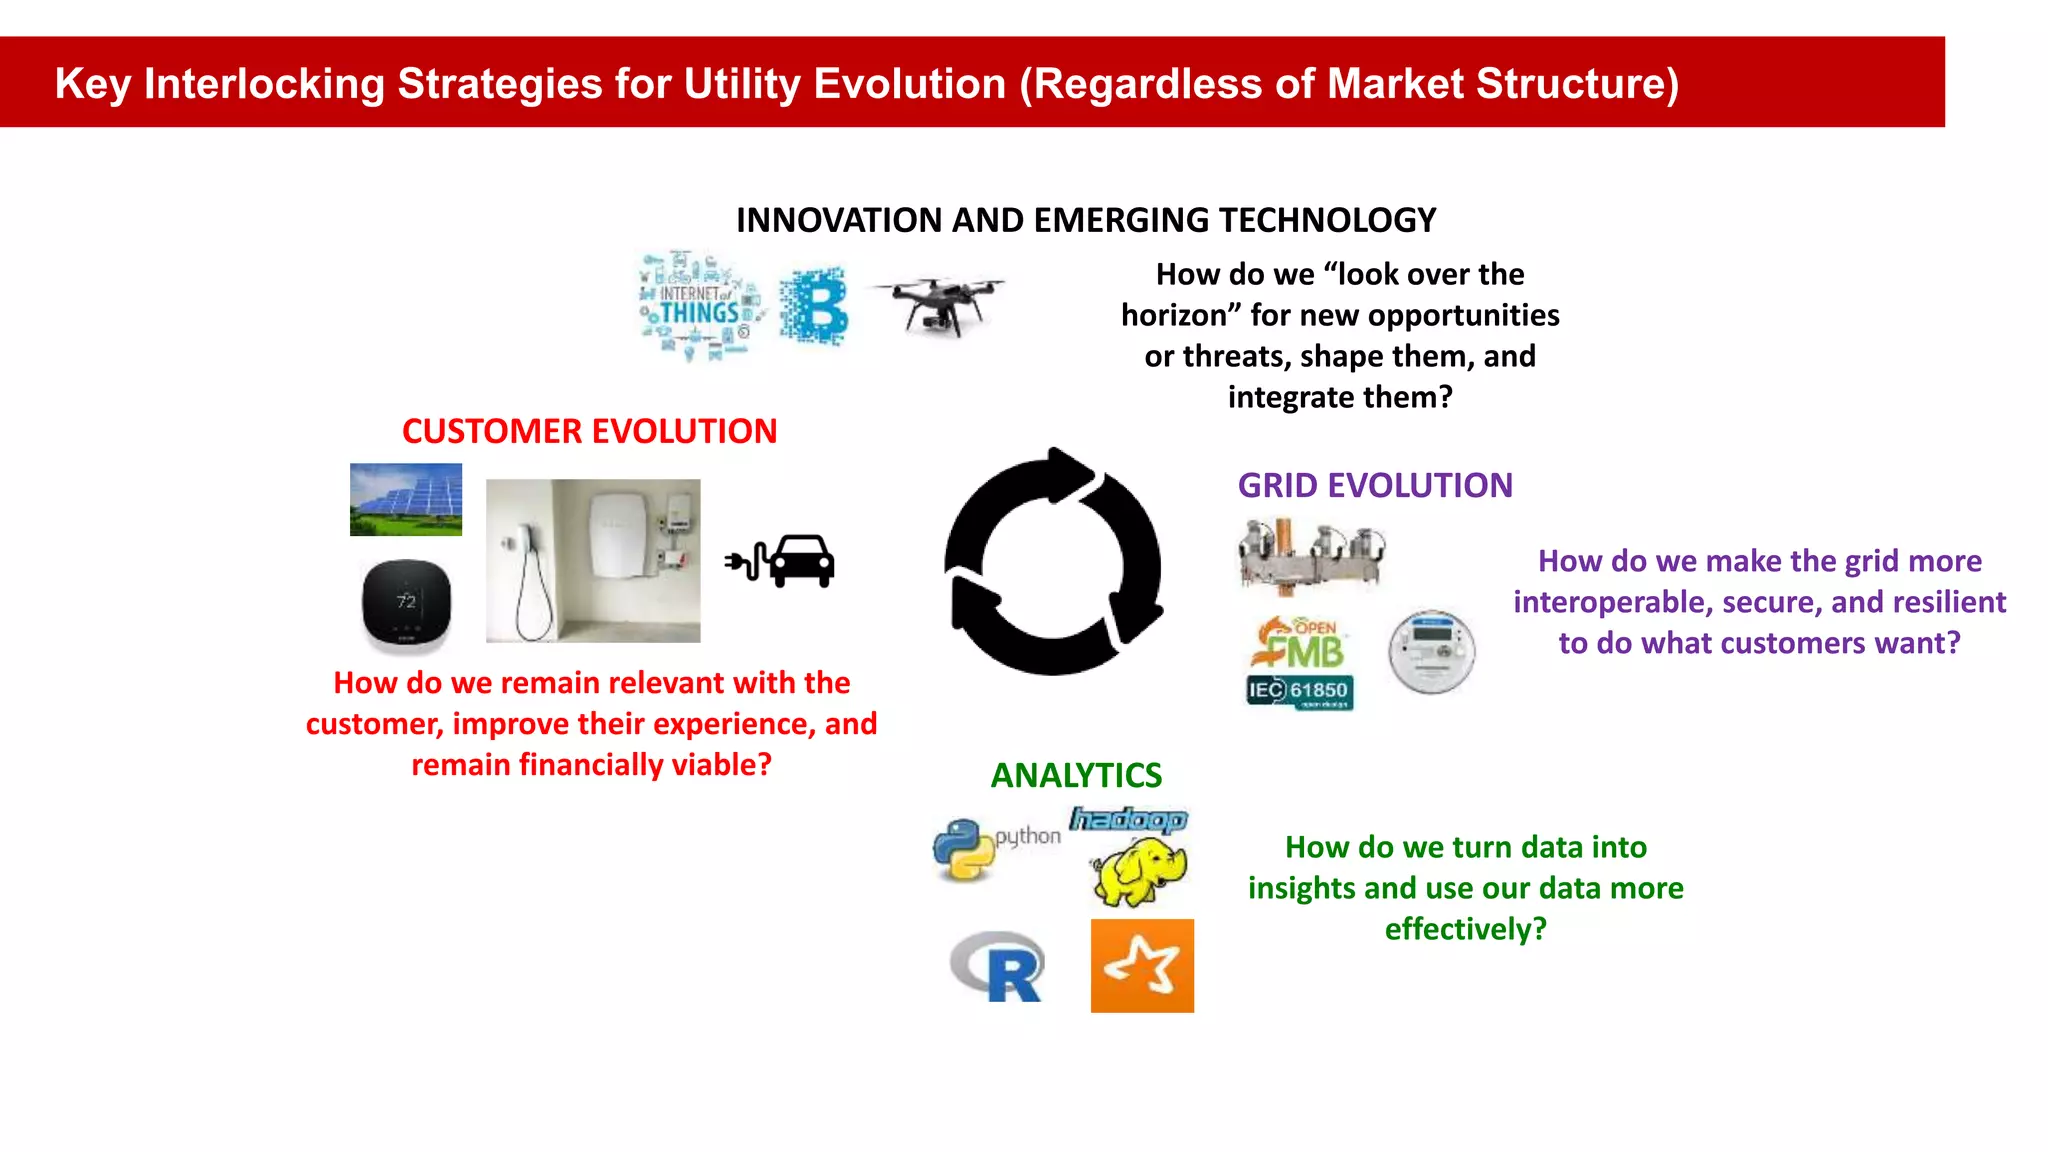
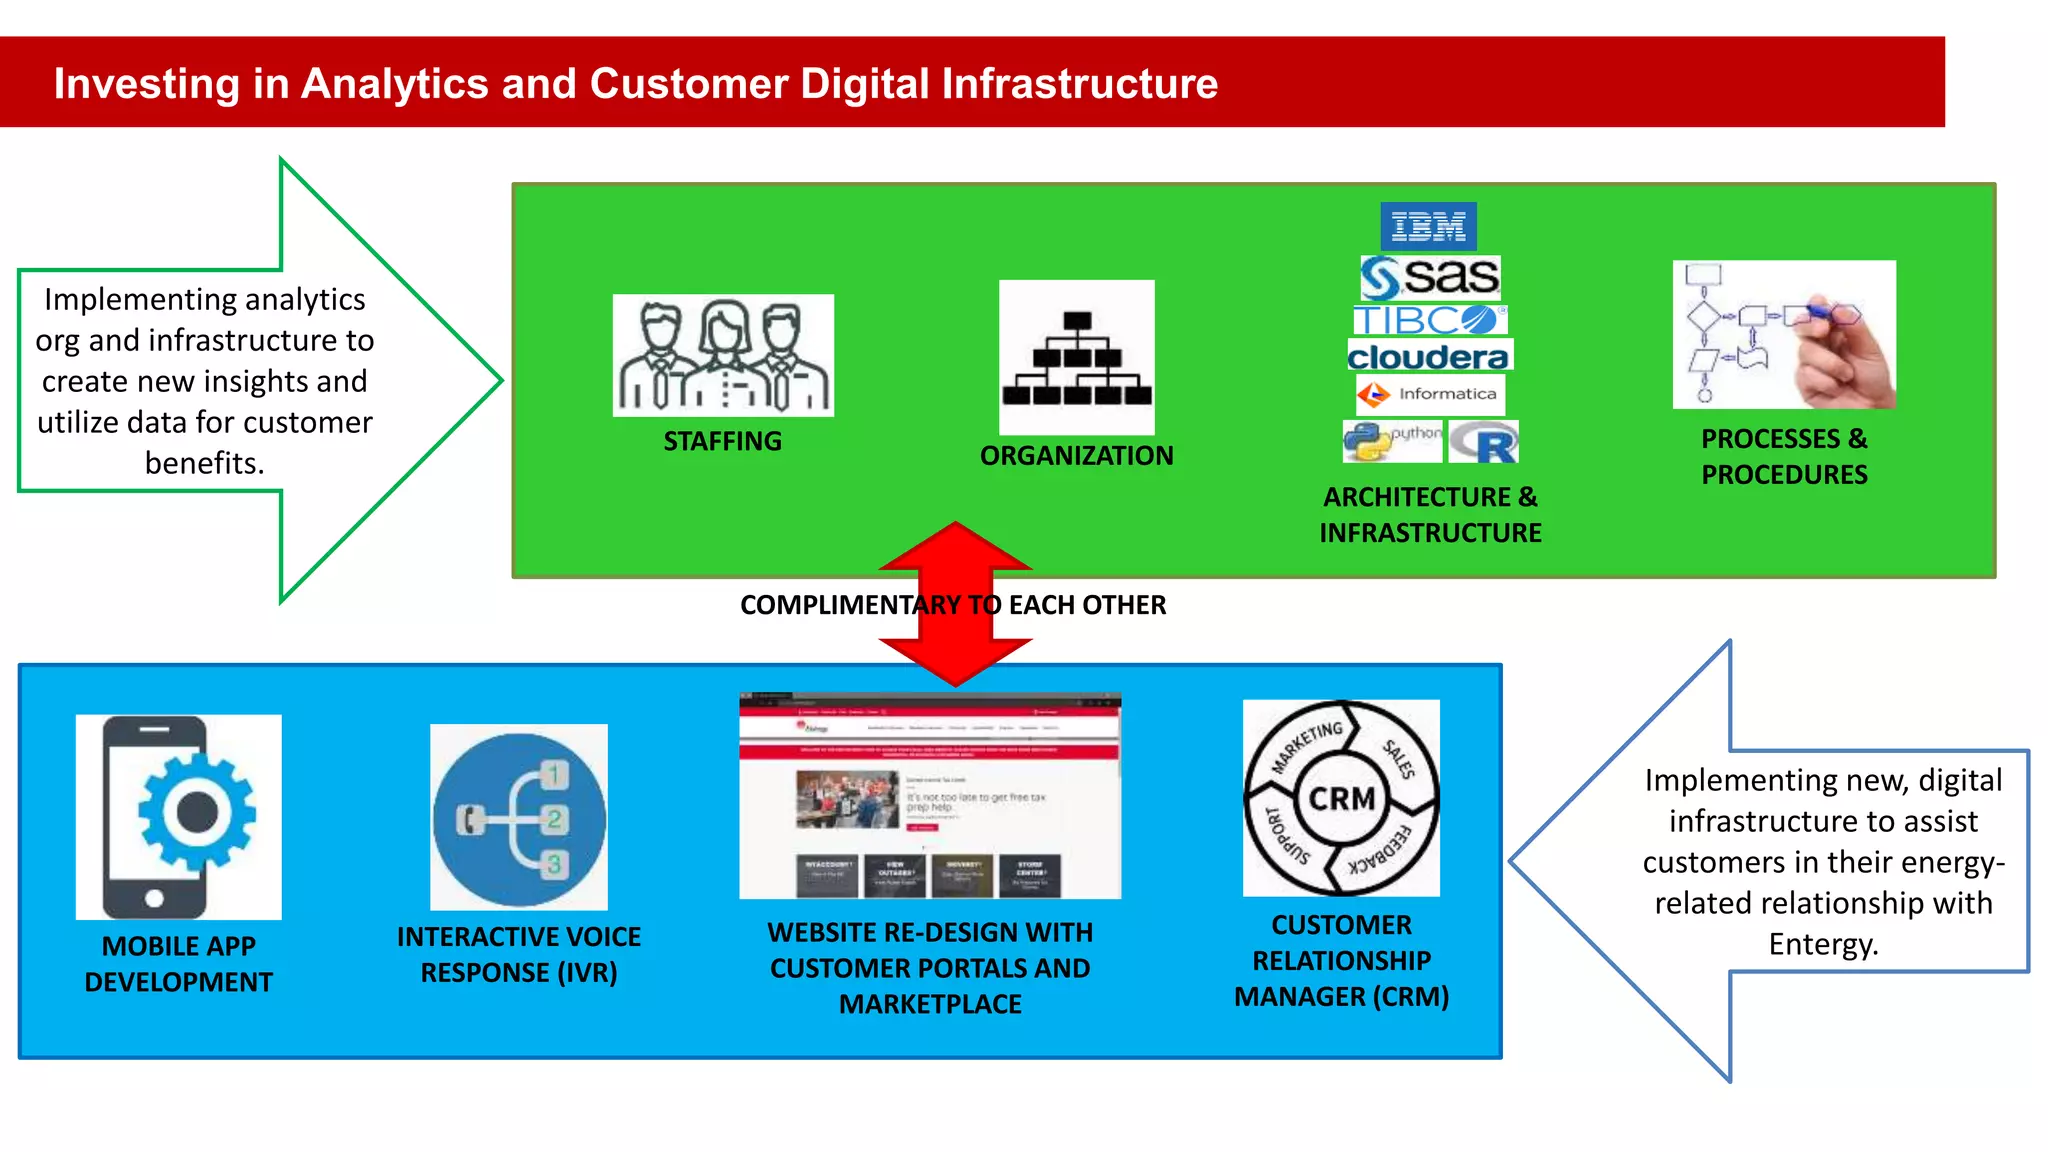
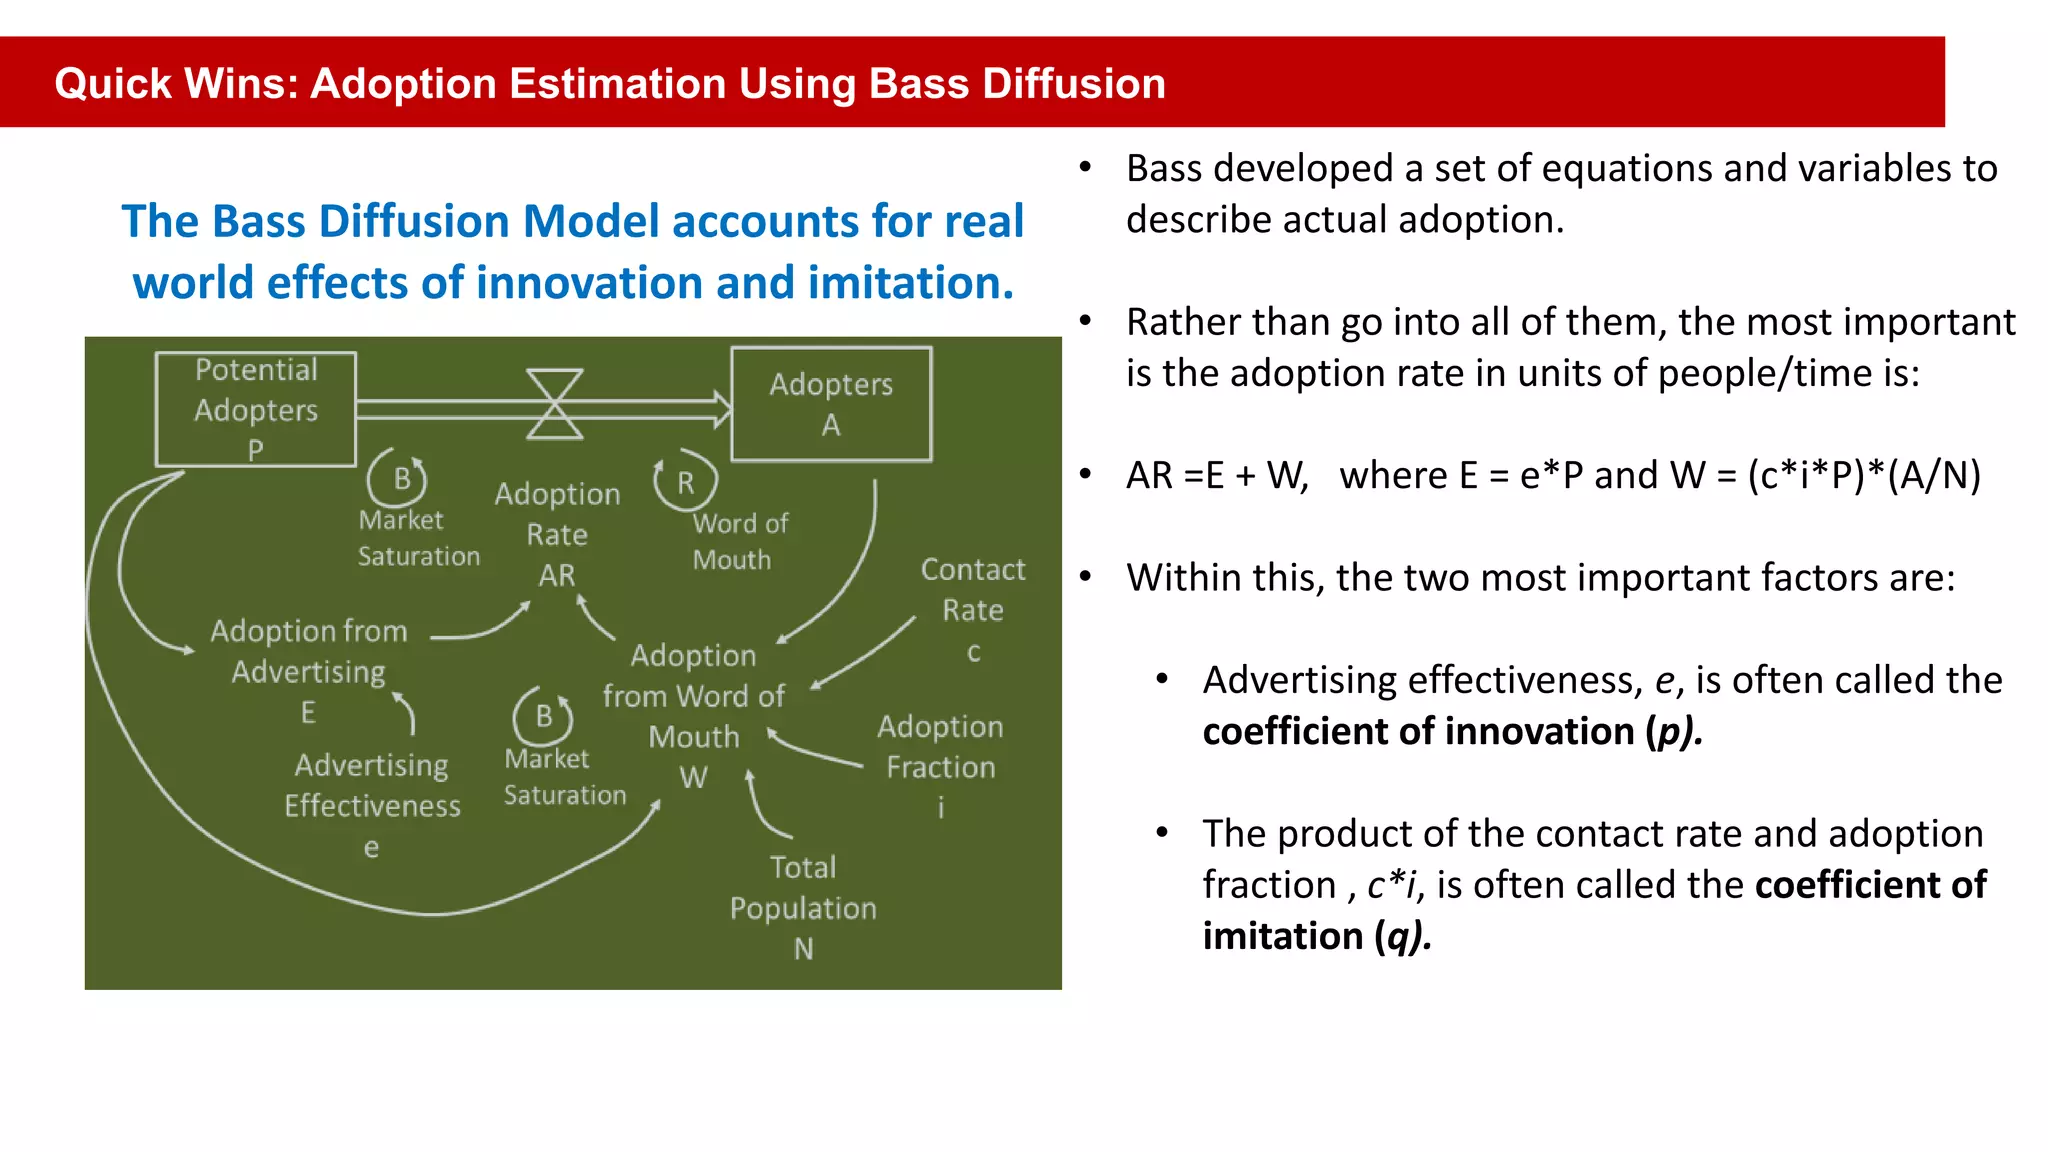
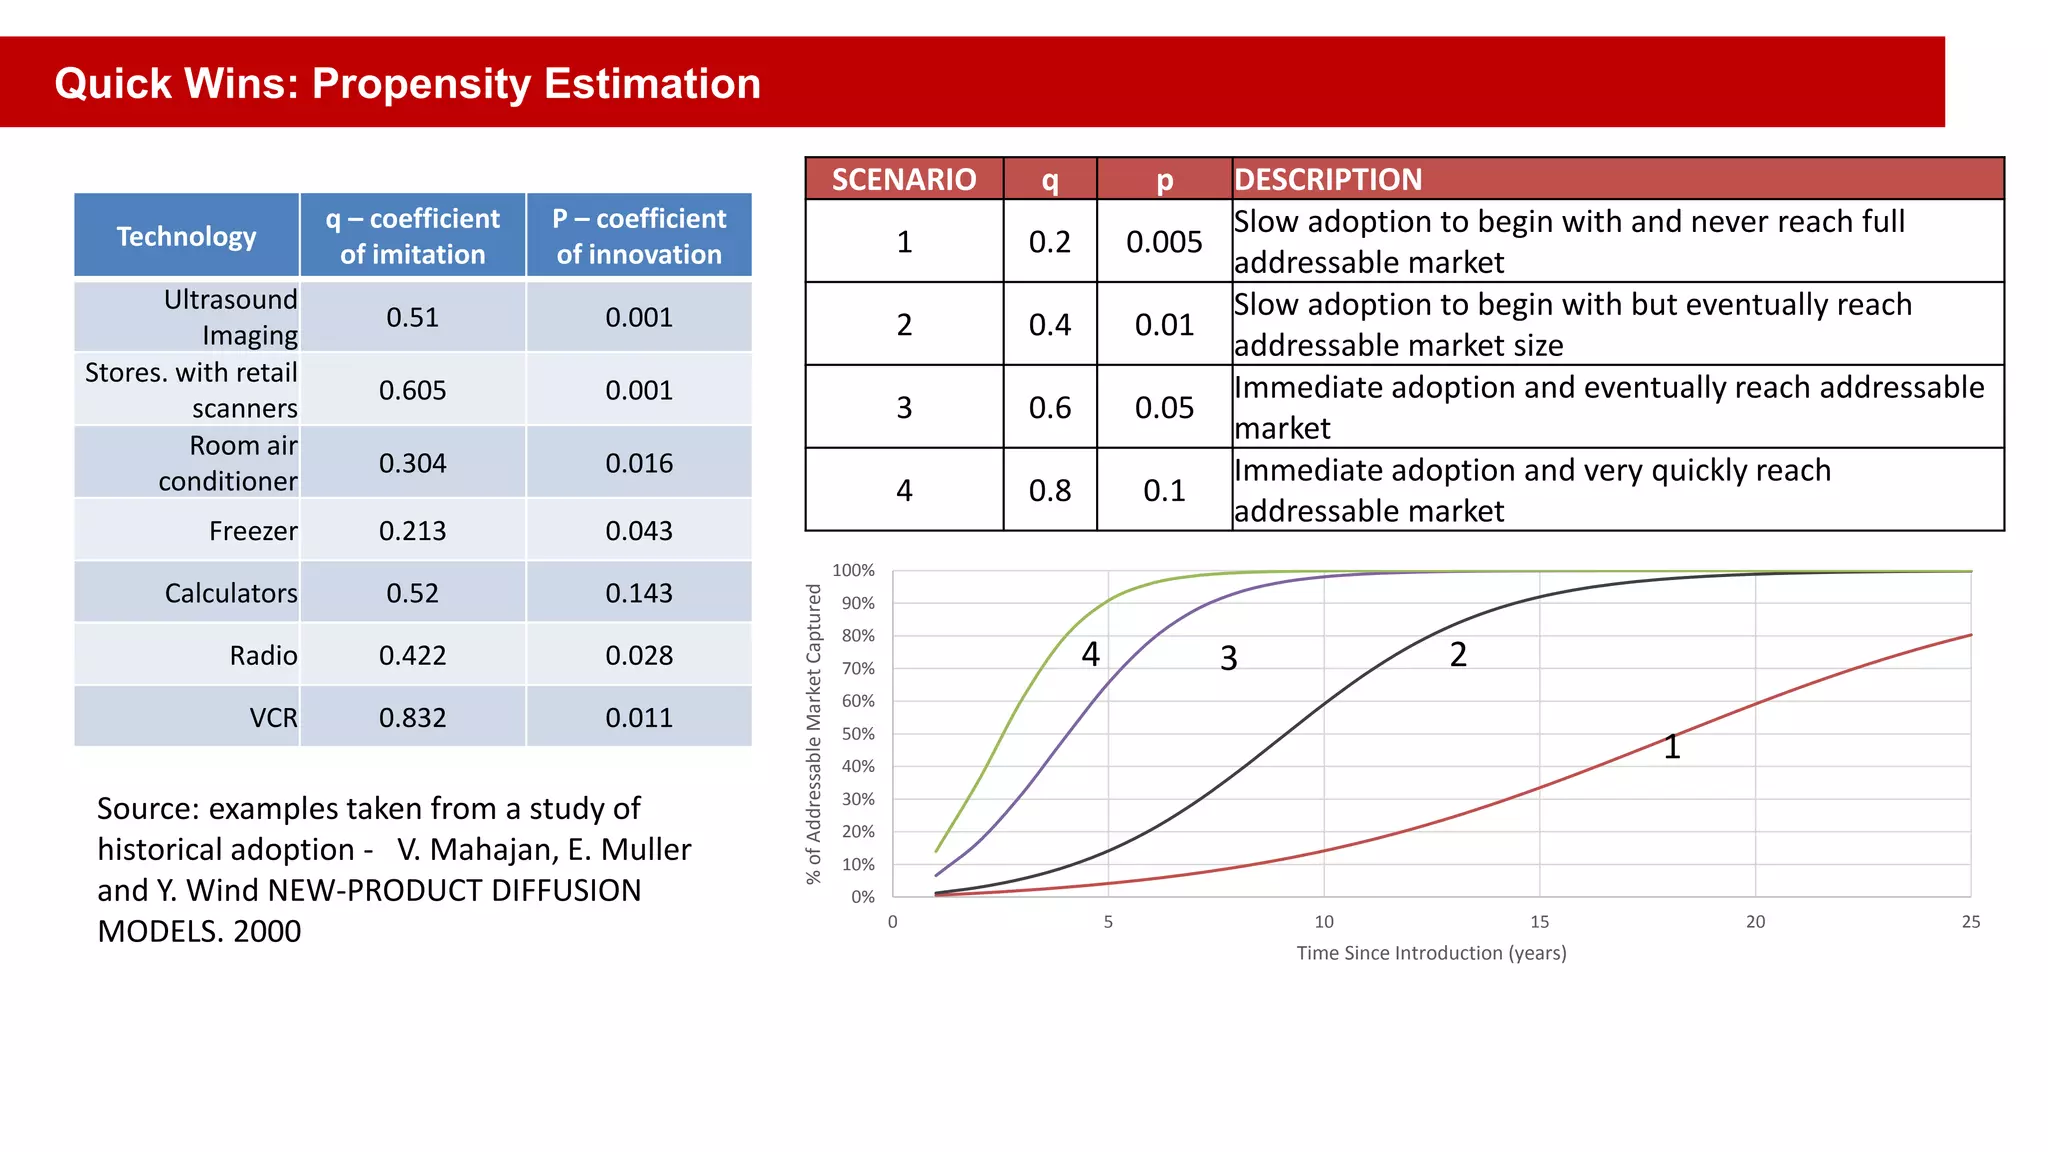
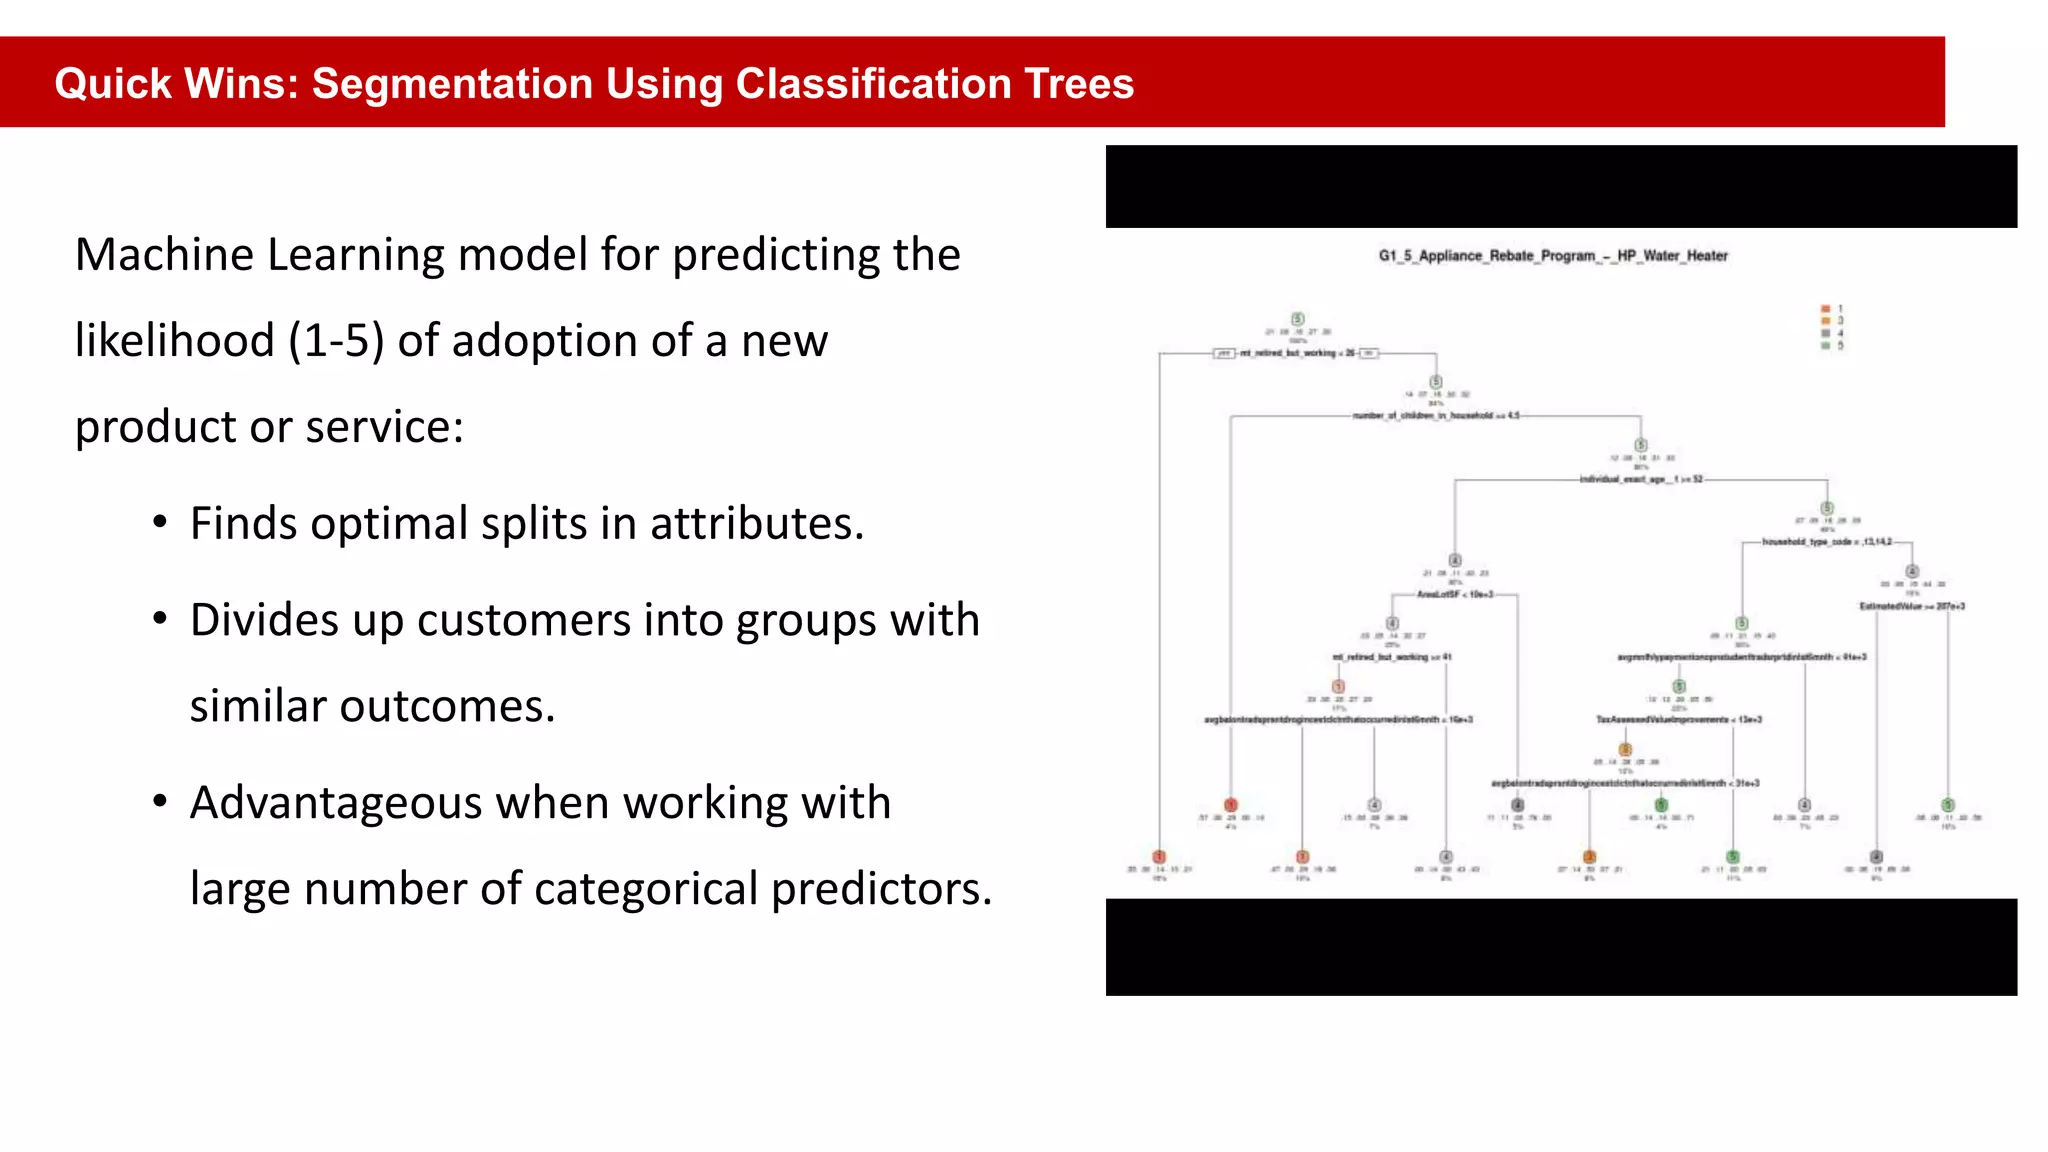
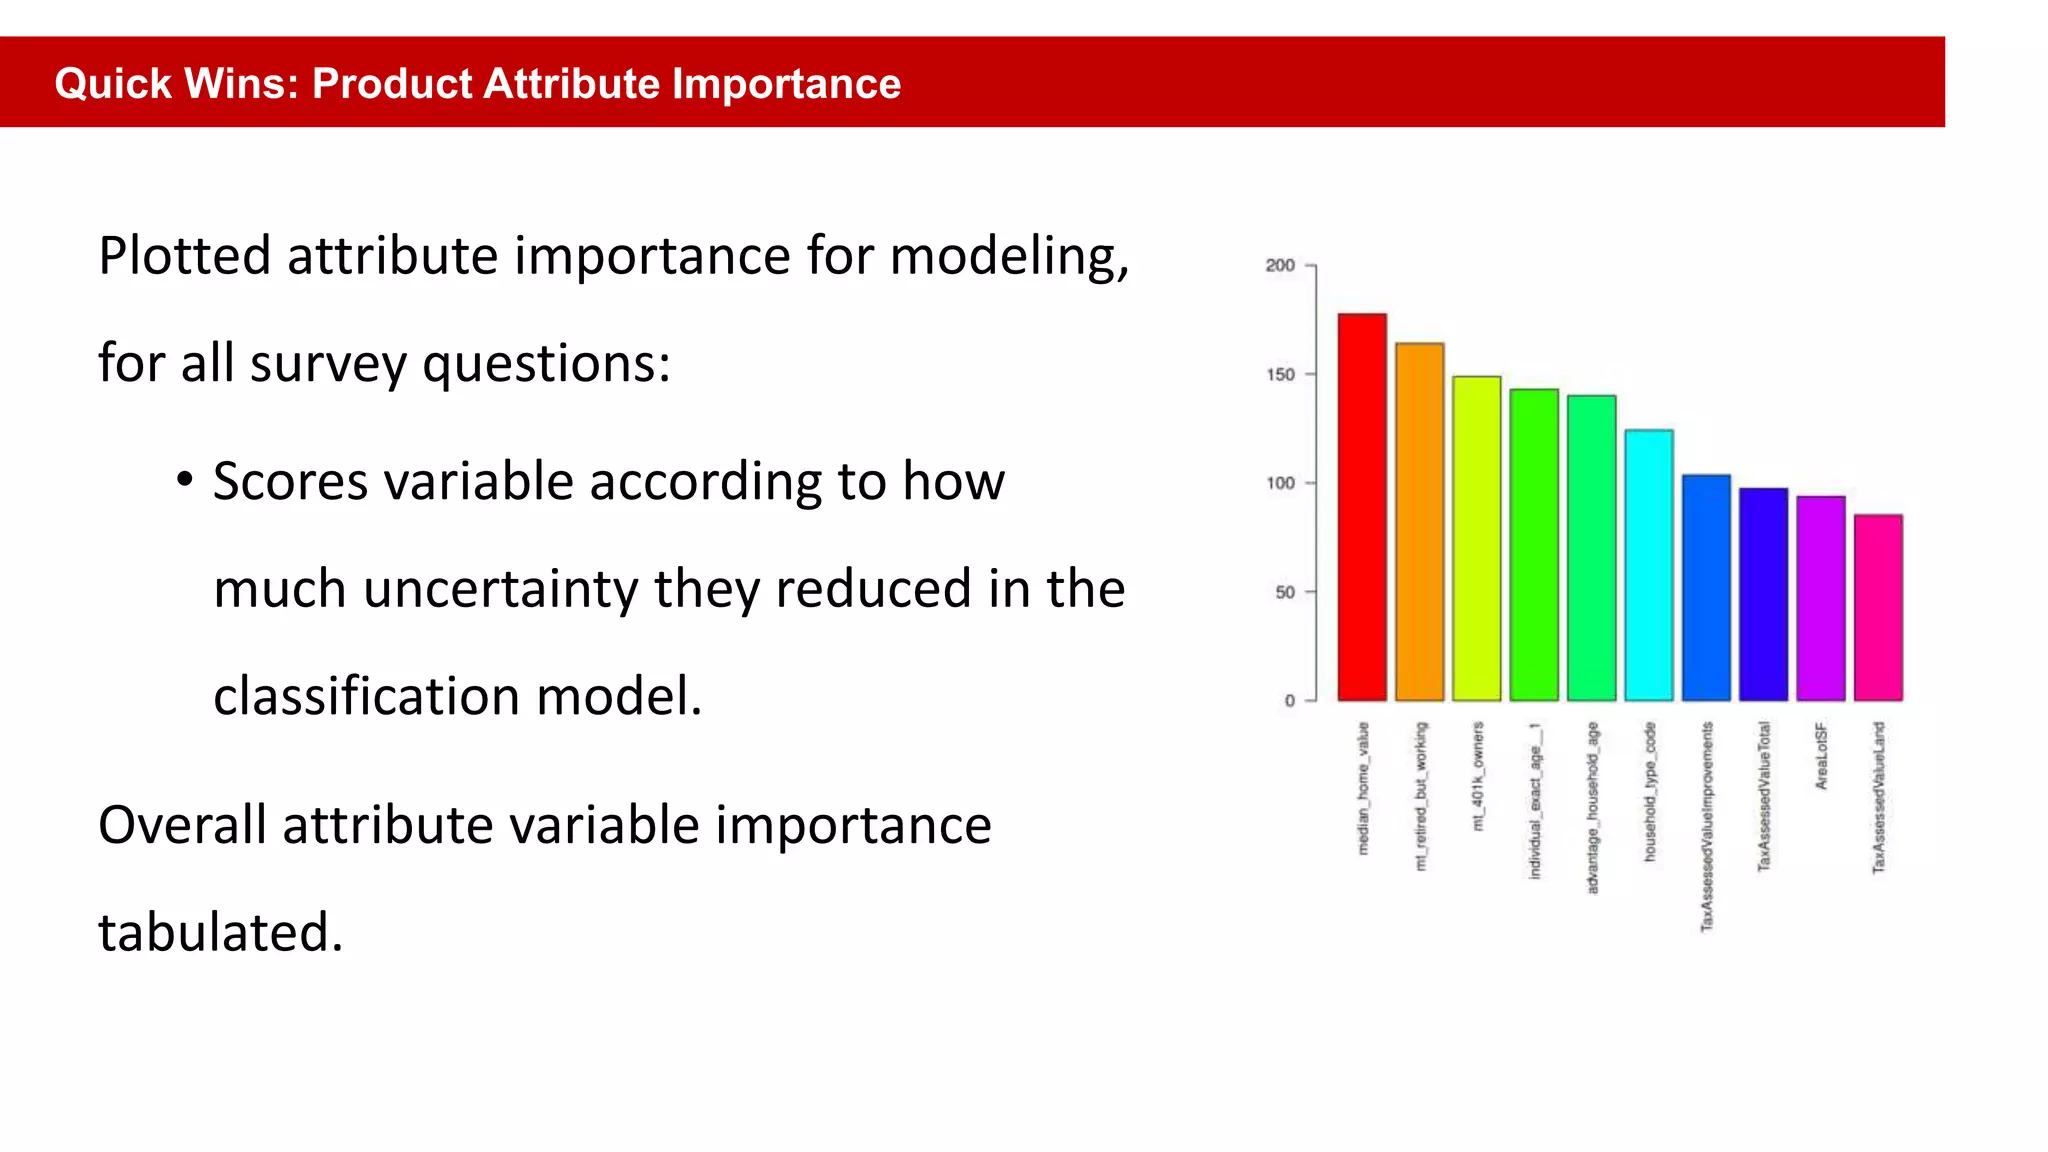
It’s All About Data – And the Customer
GTM Grid Edge East
Patty Durand, President & CEO
Smart Energy Consumer Collaborative
Who Is SECC?
“Data Analytics” Consumer Research
What do residential
customers want from
their energy usage
data?
Home Energy Voice Assistant
Tested Three Data-Powered Concepts
Driven by data and analytics
Address a specific consumer pain point
Provide personalization and quantification
Can be delivered with existing technology
5
Core Concept
Identify monthly cost savings potential if
older appliances are replaced with
newer, more efficient ones
Rebate Finder
A tool that, once the consumer decides
to replace, finds applicable rebates and
incentives
1) Replacing inefficient appliances
6
Concept
Estimates monthly energy bill savings
associated with specific actions:
 Lowering thermostat by two
degrees
 Unplugging devices when not in
use
Offered by the electricity provider at
no cost
2) Managing how consumers use energy
7
3) Manage when consumers use energy
8
Core Concept
Avoid using specific appliances during
peak times
Consumer gives permission to provider
to delay appliance use to take
advantage of off-peak prices
Rate Plan Finder
A tool that finds applicable rate plans
that would save them money
How Did Concepts Test?
9
Over 40% of
consumers expressed
interest
Almost 60% said
they were interested
enough to do some
research
Join Our April 16 Smart Home Webinar
Voice Assistants and The
Energy-Saving Smart Home
Tuesday, April 16 at 2 p.m. (ET)
• Paul Wezner, Director, Product
Management & Marketing,
Powerley
• Gregg Knight, Chief Customer
Officer, CenterPoint Energy
• Hannah Bascom, Energy
Partnerships, Google
Sign up at smartenergycc.org
Patty Durand,
President & CEO
Smart Energy Consumer Collaborative
@seconsumer
patty.durand@smartenergycc.org
Follow SECC for Consumer Insights
Case Study: It’s All About Data – And the Customer
Raiford Smith
Vice President, Energy Technology & Analytics
Entergy Services, Inc.
April 3, 2019
• Fortune 500, vertically-integrated utility company with annual
revenues of approximately $11.5 billion USD.
• Owns and operates ~30,000 MW of electric generating capacity,
including nearly 10,000 MW of nuclear power.
• Delivers electricity to 2.9 million utility customers in Arkansas,
Louisiana, Mississippi and Texas.
• Supplies natural gas to approximately 199,000 customers in Baton
Rouge and New Orleans.
• Operates 15,500 miles of transmission lines and approximately
1,500 substations across a 114,000 square mile area.
• Employs more than 13,000 people.
A VERTICALLY-INTEGRATED ELECTRIC AND GAS
UTILITY HEADQUARTERED IN NEW ORLEANS, LA
About Entergy
• Need for growth (traditional commodity sales are stalling)
• Customer needs are shifting beyond the traditional value propositions
(affordable, reliable, safe)
• Technology innovation results in lower costs and new capabilities to serve
our customers
• Uncertainty in traditional forecasting, planning, and operations
• Non-utilities (e.g. Google, Apple, Facebook) are defining the customer
experience
• Shift from analog to digital capabilities requires an emphasis on data and
analytics
Major Influences Impacting Utilities and Our Customers
Key Interlocking Strategies for Utility Evolution (Regardless of Market Structure)
How do we “look over the
horizon” for new opportunities
or threats, shape them, and
integrate them?
INNOVATION AND EMERGING TECHNOLOGY
How do we remain relevant with the
customer, improve their experience, and
remain financially viable?
CUSTOMER EVOLUTION
How do we make the grid more
interoperable, secure, and resilient
to do what customers want?
GRID EVOLUTION
How do we turn data into
insights and use our data more
effectively?
ANALYTICS
Investing in Analytics and Customer Digital Infrastructure
Implementing new, digital
infrastructure to assist
customers in their energy-
related relationship with
Entergy.INTERACTIVE VOICE
RESPONSE (IVR)
MOBILE APP
DEVELOPMENT
WEBSITE RE-DESIGN WITH
CUSTOMER PORTALS AND
MARKETPLACE
CUSTOMER
RELATIONSHIP
MANAGER (CRM)
Implementing analytics
org and infrastructure to
create new insights and
utilize data for customer
benefits.
ARCHITECTURE &
INFRASTRUCTURE
ORGANIZATIONSTAFFING PROCESSES &
PROCEDURES
COMPLIMENTARY TO EACH OTHER
• Bass developed a set of equations and variables to
describe actual adoption.
• Rather than go into all of them, the most important
is the adoption rate in units of people/time is:
• AR =E + W, where E = e*P and W = (c*i*P)*(A/N)
• Within this, the two most important factors are:
• Advertising effectiveness, e, is often called the
coefficient of innovation (p).
• The product of the contact rate and adoption
fraction , c*i, is often called the coefficient of
imitation (q).
The Bass Diffusion Model accounts for real
world effects of innovation and imitation.
Quick Wins: Adoption Estimation Using Bass Diffusion
Source: examples taken from a study of
historical adoption - V. Mahajan, E. Muller
and Y. Wind NEW-PRODUCT DIFFUSION
MODELS. 2000
Technology
q – coefficient
of imitation
P – coefficient
of innovation
Ultrasound
Imaging
0.51 0.001
Stores. with retail
scanners
0.605 0.001
Room air
conditioner
0.304 0.016
Freezer 0.213 0.043
Calculators 0.52 0.143
Radio 0.422 0.028
VCR 0.832 0.011
SCENARIO q p DESCRIPTION
1 0.2 0.005
Slow adoption to begin with and never reach full
addressable market
2 0.4 0.01
Slow adoption to begin with but eventually reach
addressable market size
3 0.6 0.05
Immediate adoption and eventually reach addressable
market
4 0.8 0.1
Immediate adoption and very quickly reach
addressable market
0%
10%
20%
30%
40%
50%
60%
70%
80%
90%
100%
0 5 10 15 20 25
%ofAddressableMarketCaptured
Time Since Introduction (years)
1
234
Quick Wins: Propensity Estimation
Machine Learning model for predicting the
likelihood (1-5) of adoption of a new
product or service:
• Finds optimal splits in attributes.
• Divides up customers into groups with
similar outcomes.
• Advantageous when working with
large number of categorical predictors.
Quick Wins: Segmentation Using Classification Trees
Plotted attribute importance for modeling,
for all survey questions:
• Scores variable according to how
much uncertainty they reduced in the
classification model.
Overall attribute variable importance
tabulated.
Quick Wins: Product Attribute Importance
Once we can identify customers as likely adopters, we can:
• Map to Zip+4.
• Identify customers on particular feeders using each
adoption scenario.
This information can be critical to the grid modernization team
to better understand how customer activities may shape the
need and pace for future capabilities.
Similarly, this information is very helpful to distribution and
transmission planning.
Quick Wins: Geospatial Analytics of Adoption
Quick Wins: Evaluation, Measurement & Verification of Billing Programs
• Reusability:
• The analysis can be re-purposed to
help design targeting marketing
campaigns
*Results consistent with similar analysis performed by other utilities and consulting agencies.
• Deployed a repeatable and reusable framework to control for non-
program related changes, weather, economy etc.
• Internal EM&V capabilities
• The framework was applied to a billing program and we found an
increase in consumption 5X larger than previously outsourced
analytics
• Lot’s of analytics in the DSM sphere can be in-sourced
Quick Wins: Segment of One – High Bill Alert
Current State (Reactive)
Performed once/twice a year based on subject matter knowledge,
current month bill, ad-hoc reports, and “features” (cross-tab) analysis in
Excel.
Customer accounts evaluated by:
• Actual percentage increase between previous two months bills (25%,
30%, 50%, etc.)
• 1 or more high bill complaints in current year
• Etc etc.
• Predicts bill amount before each meter cycle has begun based on bespoke
customer variables (weather forecasts, previous account history)
• Repeatability: useful to then tie to probability for non-payment
• Communicate with customer before they get their high bill
Future State (Proactive)
Monthly >25% Difference Accuracy
Average Temperatures vs KWH
Quick Wins: Discovering Load Archetypes (AMI Pilot Data)
• AMI deployment will enable us to better understand consumption patterns at the inter-month (down to 15
minute interval) level
• The volume of data becomes so significant (and varied) that advanced statistical techniques are needed turn the
data into actionable insights
• AMI analytics allows us to generate new segmentation approaches as well as serve as foundational for many
other use cases
Quick Wins: Paperless Billing Segmentation
Wave 1
Performed using subject matter
knowledge and Excel crosstabs
• ~40k customers targeted
• 93.4% stick rate
• Lacks repeatability (very low
hanging fruit)
Wave 2
Performed using subject matter knowledge and
CHAID (advanced decision tree correlation)
analysis
• ~26k customers targeted
• 97.1% stick rate
• Important: All customers are “scored” for
future waves
• Challenge: Identify customers that currently receive both a paper and paperless bill and convert to
paperless billing
Best Worst
• Young people, relatively high
income and digitally engaged
with us (auto-bill pay etc)
Thank you!
Raiford Smith
rsmit57@entergy.com
linkedin.com/in/raiford-smith-9821a6/

Case Study: It’s All About Data – And the Customer

  • 1.
    It’s All AboutData – And the Customer GTM Grid Edge East Patty Durand, President & CEO Smart Energy Consumer Collaborative
  • 2.
  • 3.
    “Data Analytics” ConsumerResearch What do residential customers want from their energy usage data?
  • 4.
  • 5.
  • 6.
    Tested Three Data-PoweredConcepts Driven by data and analytics Address a specific consumer pain point Provide personalization and quantification Can be delivered with existing technology 5
  • 7.
    Core Concept Identify monthlycost savings potential if older appliances are replaced with newer, more efficient ones Rebate Finder A tool that, once the consumer decides to replace, finds applicable rebates and incentives 1) Replacing inefficient appliances 6
  • 8.
    Concept Estimates monthly energybill savings associated with specific actions:  Lowering thermostat by two degrees  Unplugging devices when not in use Offered by the electricity provider at no cost 2) Managing how consumers use energy 7
  • 9.
    3) Manage whenconsumers use energy 8 Core Concept Avoid using specific appliances during peak times Consumer gives permission to provider to delay appliance use to take advantage of off-peak prices Rate Plan Finder A tool that finds applicable rate plans that would save them money
  • 10.
    How Did ConceptsTest? 9 Over 40% of consumers expressed interest Almost 60% said they were interested enough to do some research
  • 11.
    Join Our April16 Smart Home Webinar Voice Assistants and The Energy-Saving Smart Home Tuesday, April 16 at 2 p.m. (ET) • Paul Wezner, Director, Product Management & Marketing, Powerley • Gregg Knight, Chief Customer Officer, CenterPoint Energy • Hannah Bascom, Energy Partnerships, Google Sign up at smartenergycc.org
  • 12.
    Patty Durand, President &CEO Smart Energy Consumer Collaborative @seconsumer patty.durand@smartenergycc.org Follow SECC for Consumer Insights
  • 13.
    Case Study: It’sAll About Data – And the Customer Raiford Smith Vice President, Energy Technology & Analytics Entergy Services, Inc. April 3, 2019
  • 14.
    • Fortune 500,vertically-integrated utility company with annual revenues of approximately $11.5 billion USD. • Owns and operates ~30,000 MW of electric generating capacity, including nearly 10,000 MW of nuclear power. • Delivers electricity to 2.9 million utility customers in Arkansas, Louisiana, Mississippi and Texas. • Supplies natural gas to approximately 199,000 customers in Baton Rouge and New Orleans. • Operates 15,500 miles of transmission lines and approximately 1,500 substations across a 114,000 square mile area. • Employs more than 13,000 people. A VERTICALLY-INTEGRATED ELECTRIC AND GAS UTILITY HEADQUARTERED IN NEW ORLEANS, LA About Entergy
  • 15.
    • Need forgrowth (traditional commodity sales are stalling) • Customer needs are shifting beyond the traditional value propositions (affordable, reliable, safe) • Technology innovation results in lower costs and new capabilities to serve our customers • Uncertainty in traditional forecasting, planning, and operations • Non-utilities (e.g. Google, Apple, Facebook) are defining the customer experience • Shift from analog to digital capabilities requires an emphasis on data and analytics Major Influences Impacting Utilities and Our Customers
  • 16.
    Key Interlocking Strategiesfor Utility Evolution (Regardless of Market Structure) How do we “look over the horizon” for new opportunities or threats, shape them, and integrate them? INNOVATION AND EMERGING TECHNOLOGY How do we remain relevant with the customer, improve their experience, and remain financially viable? CUSTOMER EVOLUTION How do we make the grid more interoperable, secure, and resilient to do what customers want? GRID EVOLUTION How do we turn data into insights and use our data more effectively? ANALYTICS
  • 17.
    Investing in Analyticsand Customer Digital Infrastructure Implementing new, digital infrastructure to assist customers in their energy- related relationship with Entergy.INTERACTIVE VOICE RESPONSE (IVR) MOBILE APP DEVELOPMENT WEBSITE RE-DESIGN WITH CUSTOMER PORTALS AND MARKETPLACE CUSTOMER RELATIONSHIP MANAGER (CRM) Implementing analytics org and infrastructure to create new insights and utilize data for customer benefits. ARCHITECTURE & INFRASTRUCTURE ORGANIZATIONSTAFFING PROCESSES & PROCEDURES COMPLIMENTARY TO EACH OTHER
  • 18.
    • Bass developeda set of equations and variables to describe actual adoption. • Rather than go into all of them, the most important is the adoption rate in units of people/time is: • AR =E + W, where E = e*P and W = (c*i*P)*(A/N) • Within this, the two most important factors are: • Advertising effectiveness, e, is often called the coefficient of innovation (p). • The product of the contact rate and adoption fraction , c*i, is often called the coefficient of imitation (q). The Bass Diffusion Model accounts for real world effects of innovation and imitation. Quick Wins: Adoption Estimation Using Bass Diffusion
  • 19.
    Source: examples takenfrom a study of historical adoption - V. Mahajan, E. Muller and Y. Wind NEW-PRODUCT DIFFUSION MODELS. 2000 Technology q – coefficient of imitation P – coefficient of innovation Ultrasound Imaging 0.51 0.001 Stores. with retail scanners 0.605 0.001 Room air conditioner 0.304 0.016 Freezer 0.213 0.043 Calculators 0.52 0.143 Radio 0.422 0.028 VCR 0.832 0.011 SCENARIO q p DESCRIPTION 1 0.2 0.005 Slow adoption to begin with and never reach full addressable market 2 0.4 0.01 Slow adoption to begin with but eventually reach addressable market size 3 0.6 0.05 Immediate adoption and eventually reach addressable market 4 0.8 0.1 Immediate adoption and very quickly reach addressable market 0% 10% 20% 30% 40% 50% 60% 70% 80% 90% 100% 0 5 10 15 20 25 %ofAddressableMarketCaptured Time Since Introduction (years) 1 234 Quick Wins: Propensity Estimation
  • 20.
    Machine Learning modelfor predicting the likelihood (1-5) of adoption of a new product or service: • Finds optimal splits in attributes. • Divides up customers into groups with similar outcomes. • Advantageous when working with large number of categorical predictors. Quick Wins: Segmentation Using Classification Trees
  • 21.
    Plotted attribute importancefor modeling, for all survey questions: • Scores variable according to how much uncertainty they reduced in the classification model. Overall attribute variable importance tabulated. Quick Wins: Product Attribute Importance
  • 22.
    Once we canidentify customers as likely adopters, we can: • Map to Zip+4. • Identify customers on particular feeders using each adoption scenario. This information can be critical to the grid modernization team to better understand how customer activities may shape the need and pace for future capabilities. Similarly, this information is very helpful to distribution and transmission planning. Quick Wins: Geospatial Analytics of Adoption
  • 23.
    Quick Wins: Evaluation,Measurement & Verification of Billing Programs • Reusability: • The analysis can be re-purposed to help design targeting marketing campaigns *Results consistent with similar analysis performed by other utilities and consulting agencies. • Deployed a repeatable and reusable framework to control for non- program related changes, weather, economy etc. • Internal EM&V capabilities • The framework was applied to a billing program and we found an increase in consumption 5X larger than previously outsourced analytics • Lot’s of analytics in the DSM sphere can be in-sourced
  • 24.
    Quick Wins: Segmentof One – High Bill Alert Current State (Reactive) Performed once/twice a year based on subject matter knowledge, current month bill, ad-hoc reports, and “features” (cross-tab) analysis in Excel. Customer accounts evaluated by: • Actual percentage increase between previous two months bills (25%, 30%, 50%, etc.) • 1 or more high bill complaints in current year • Etc etc. • Predicts bill amount before each meter cycle has begun based on bespoke customer variables (weather forecasts, previous account history) • Repeatability: useful to then tie to probability for non-payment • Communicate with customer before they get their high bill Future State (Proactive) Monthly >25% Difference Accuracy Average Temperatures vs KWH
  • 25.
    Quick Wins: DiscoveringLoad Archetypes (AMI Pilot Data) • AMI deployment will enable us to better understand consumption patterns at the inter-month (down to 15 minute interval) level • The volume of data becomes so significant (and varied) that advanced statistical techniques are needed turn the data into actionable insights • AMI analytics allows us to generate new segmentation approaches as well as serve as foundational for many other use cases
  • 26.
    Quick Wins: PaperlessBilling Segmentation Wave 1 Performed using subject matter knowledge and Excel crosstabs • ~40k customers targeted • 93.4% stick rate • Lacks repeatability (very low hanging fruit) Wave 2 Performed using subject matter knowledge and CHAID (advanced decision tree correlation) analysis • ~26k customers targeted • 97.1% stick rate • Important: All customers are “scored” for future waves • Challenge: Identify customers that currently receive both a paper and paperless bill and convert to paperless billing Best Worst • Young people, relatively high income and digitally engaged with us (auto-bill pay etc)
  • 27.

Editor's Notes