Download to read offline
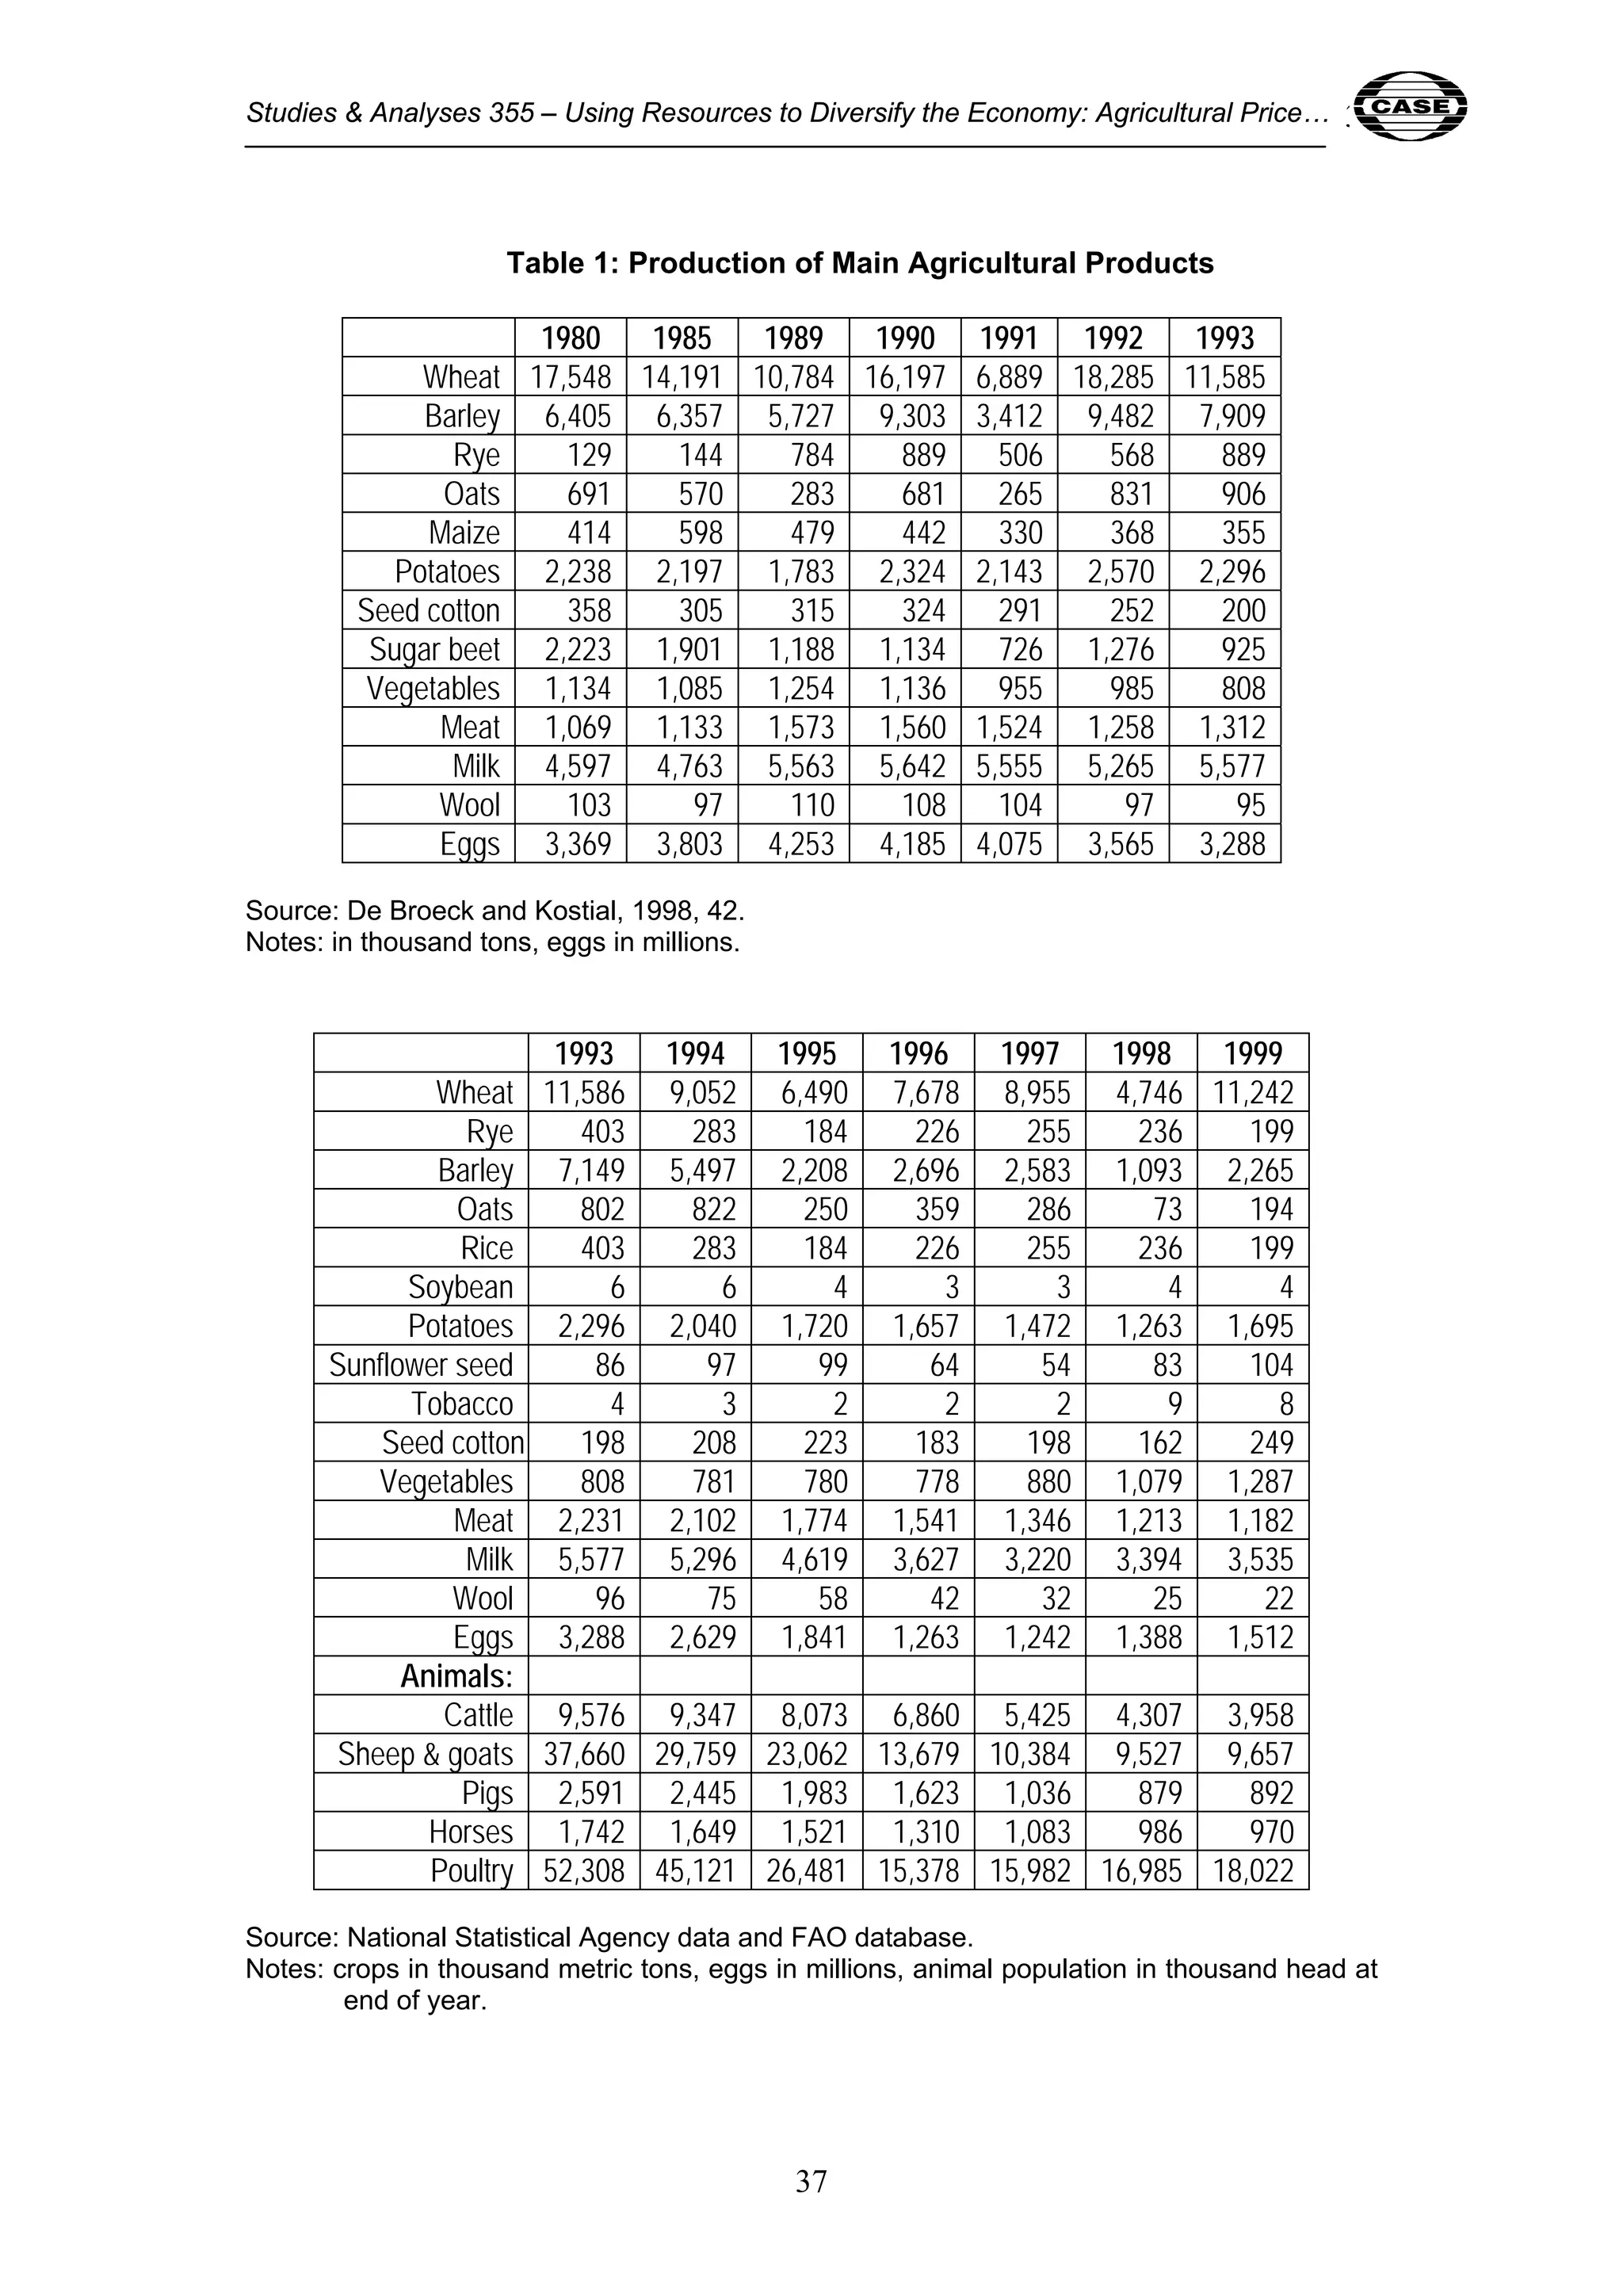
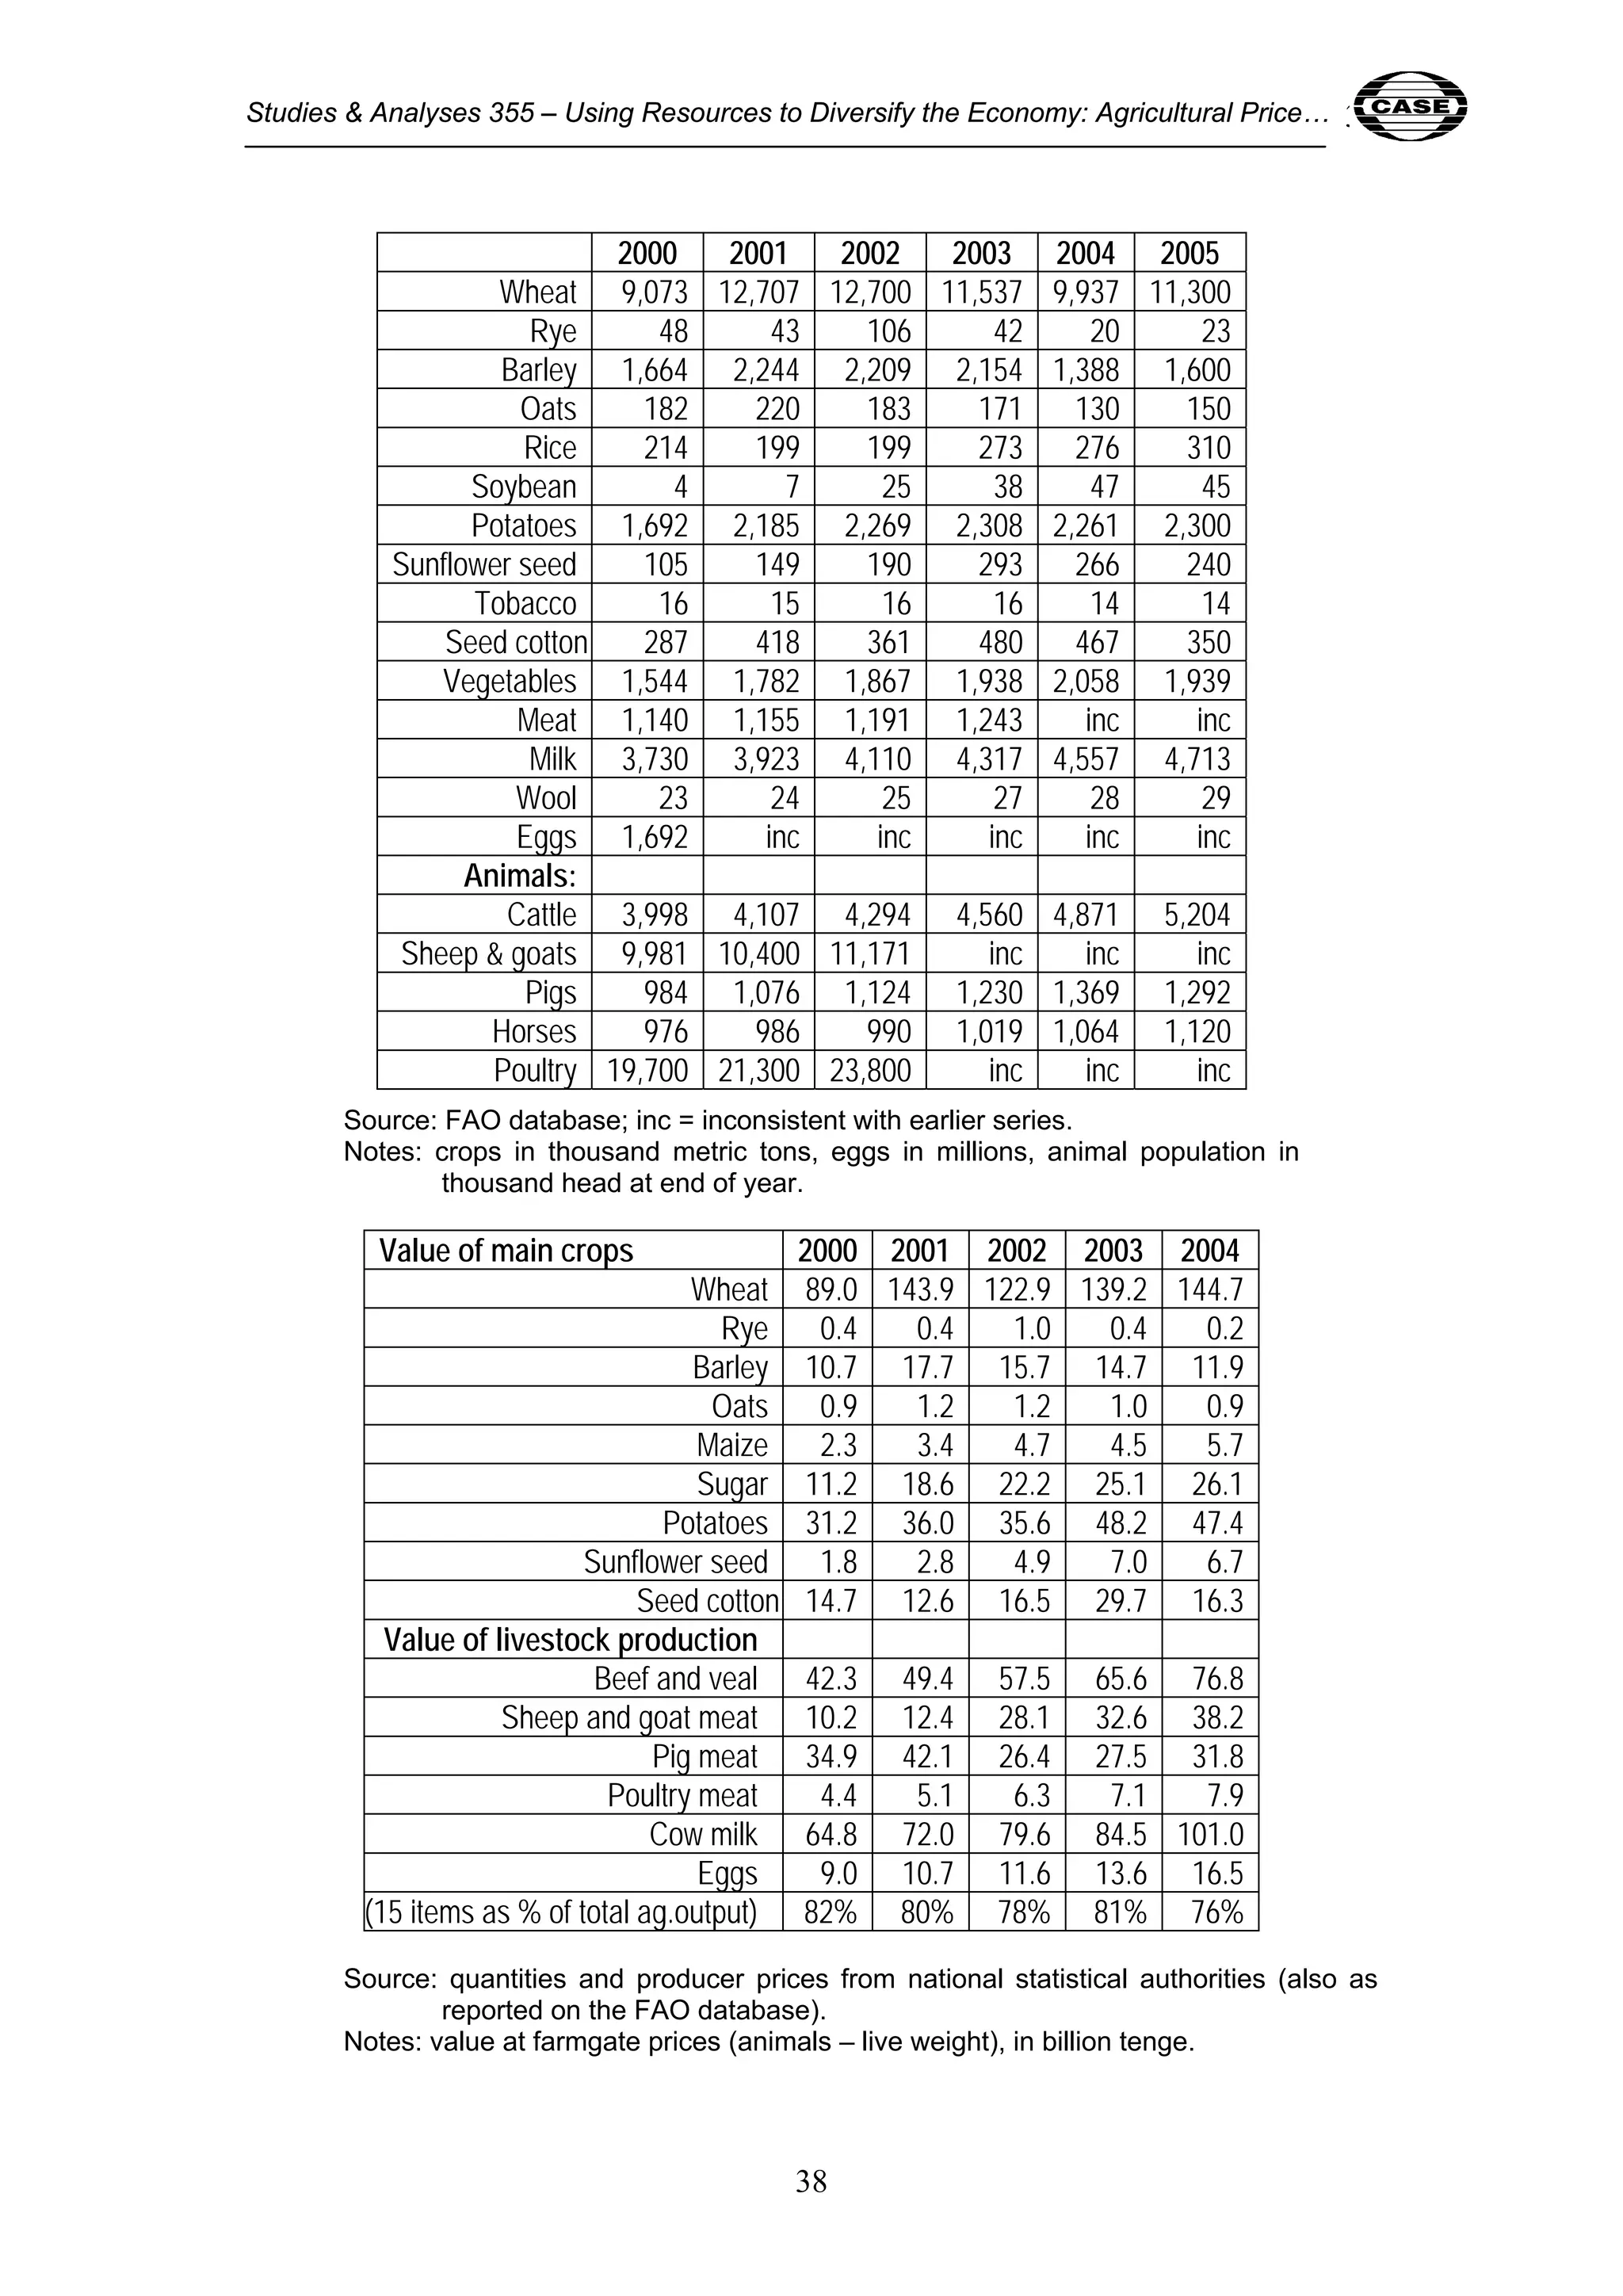
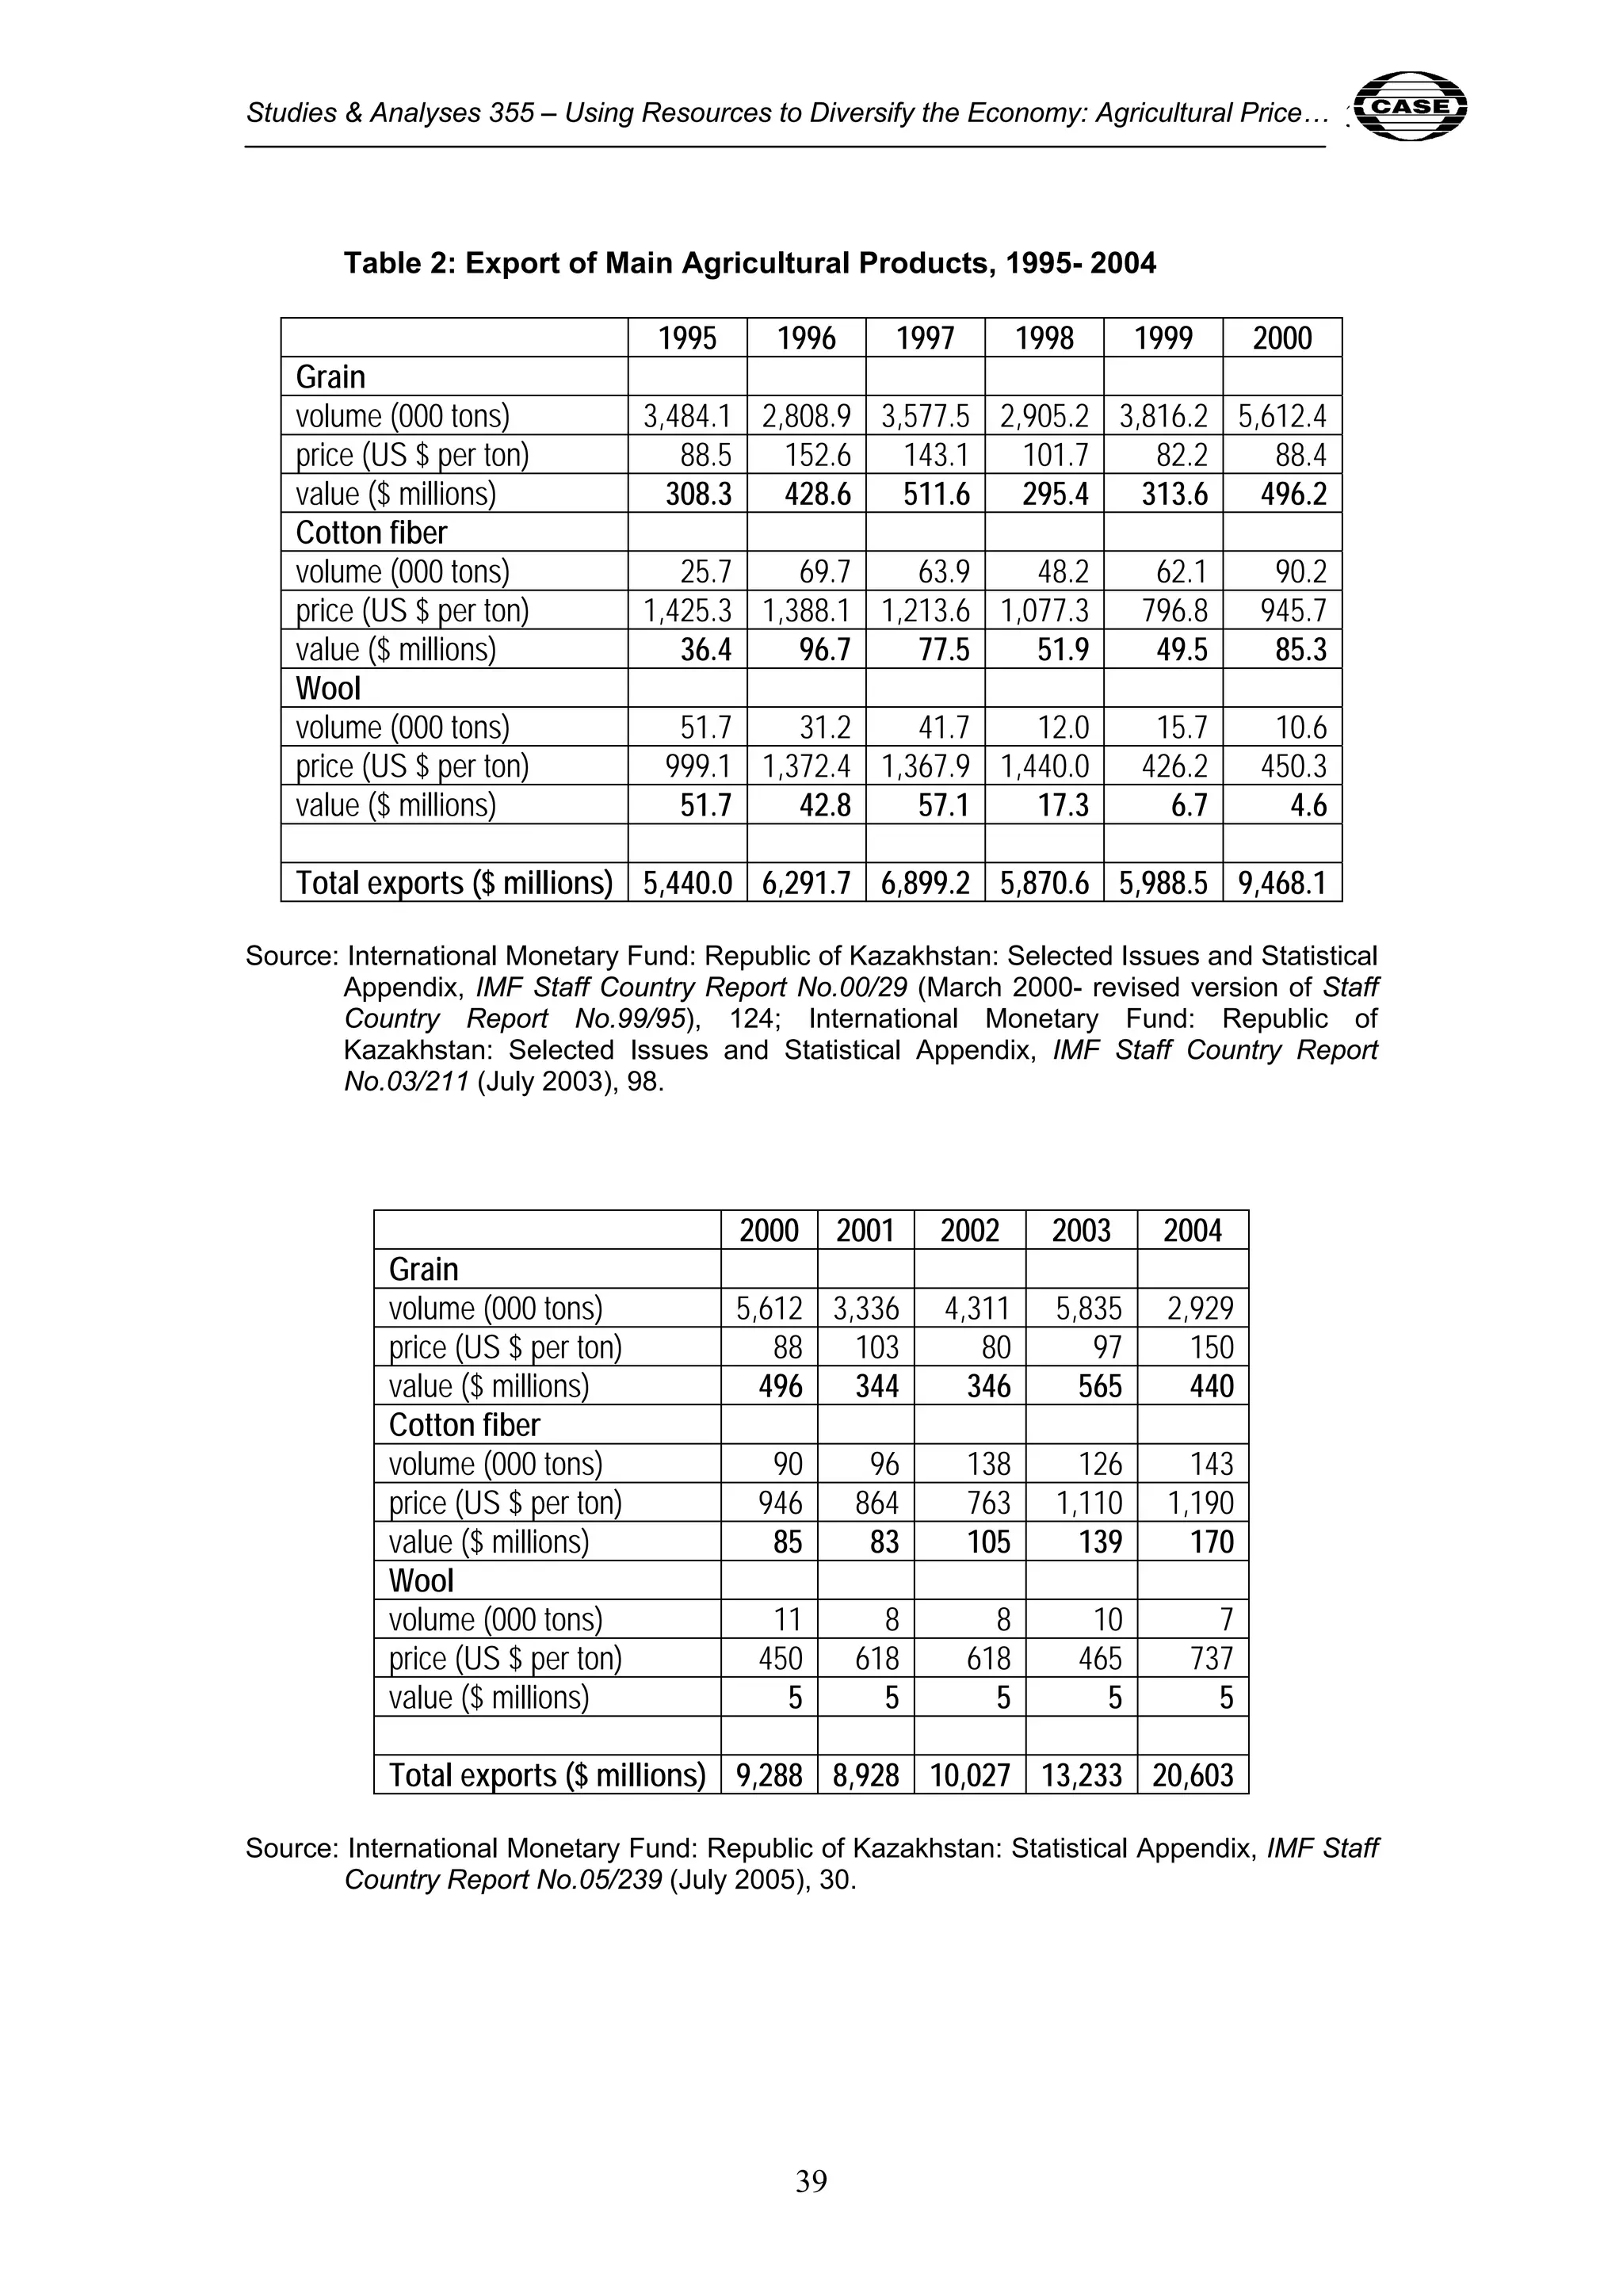
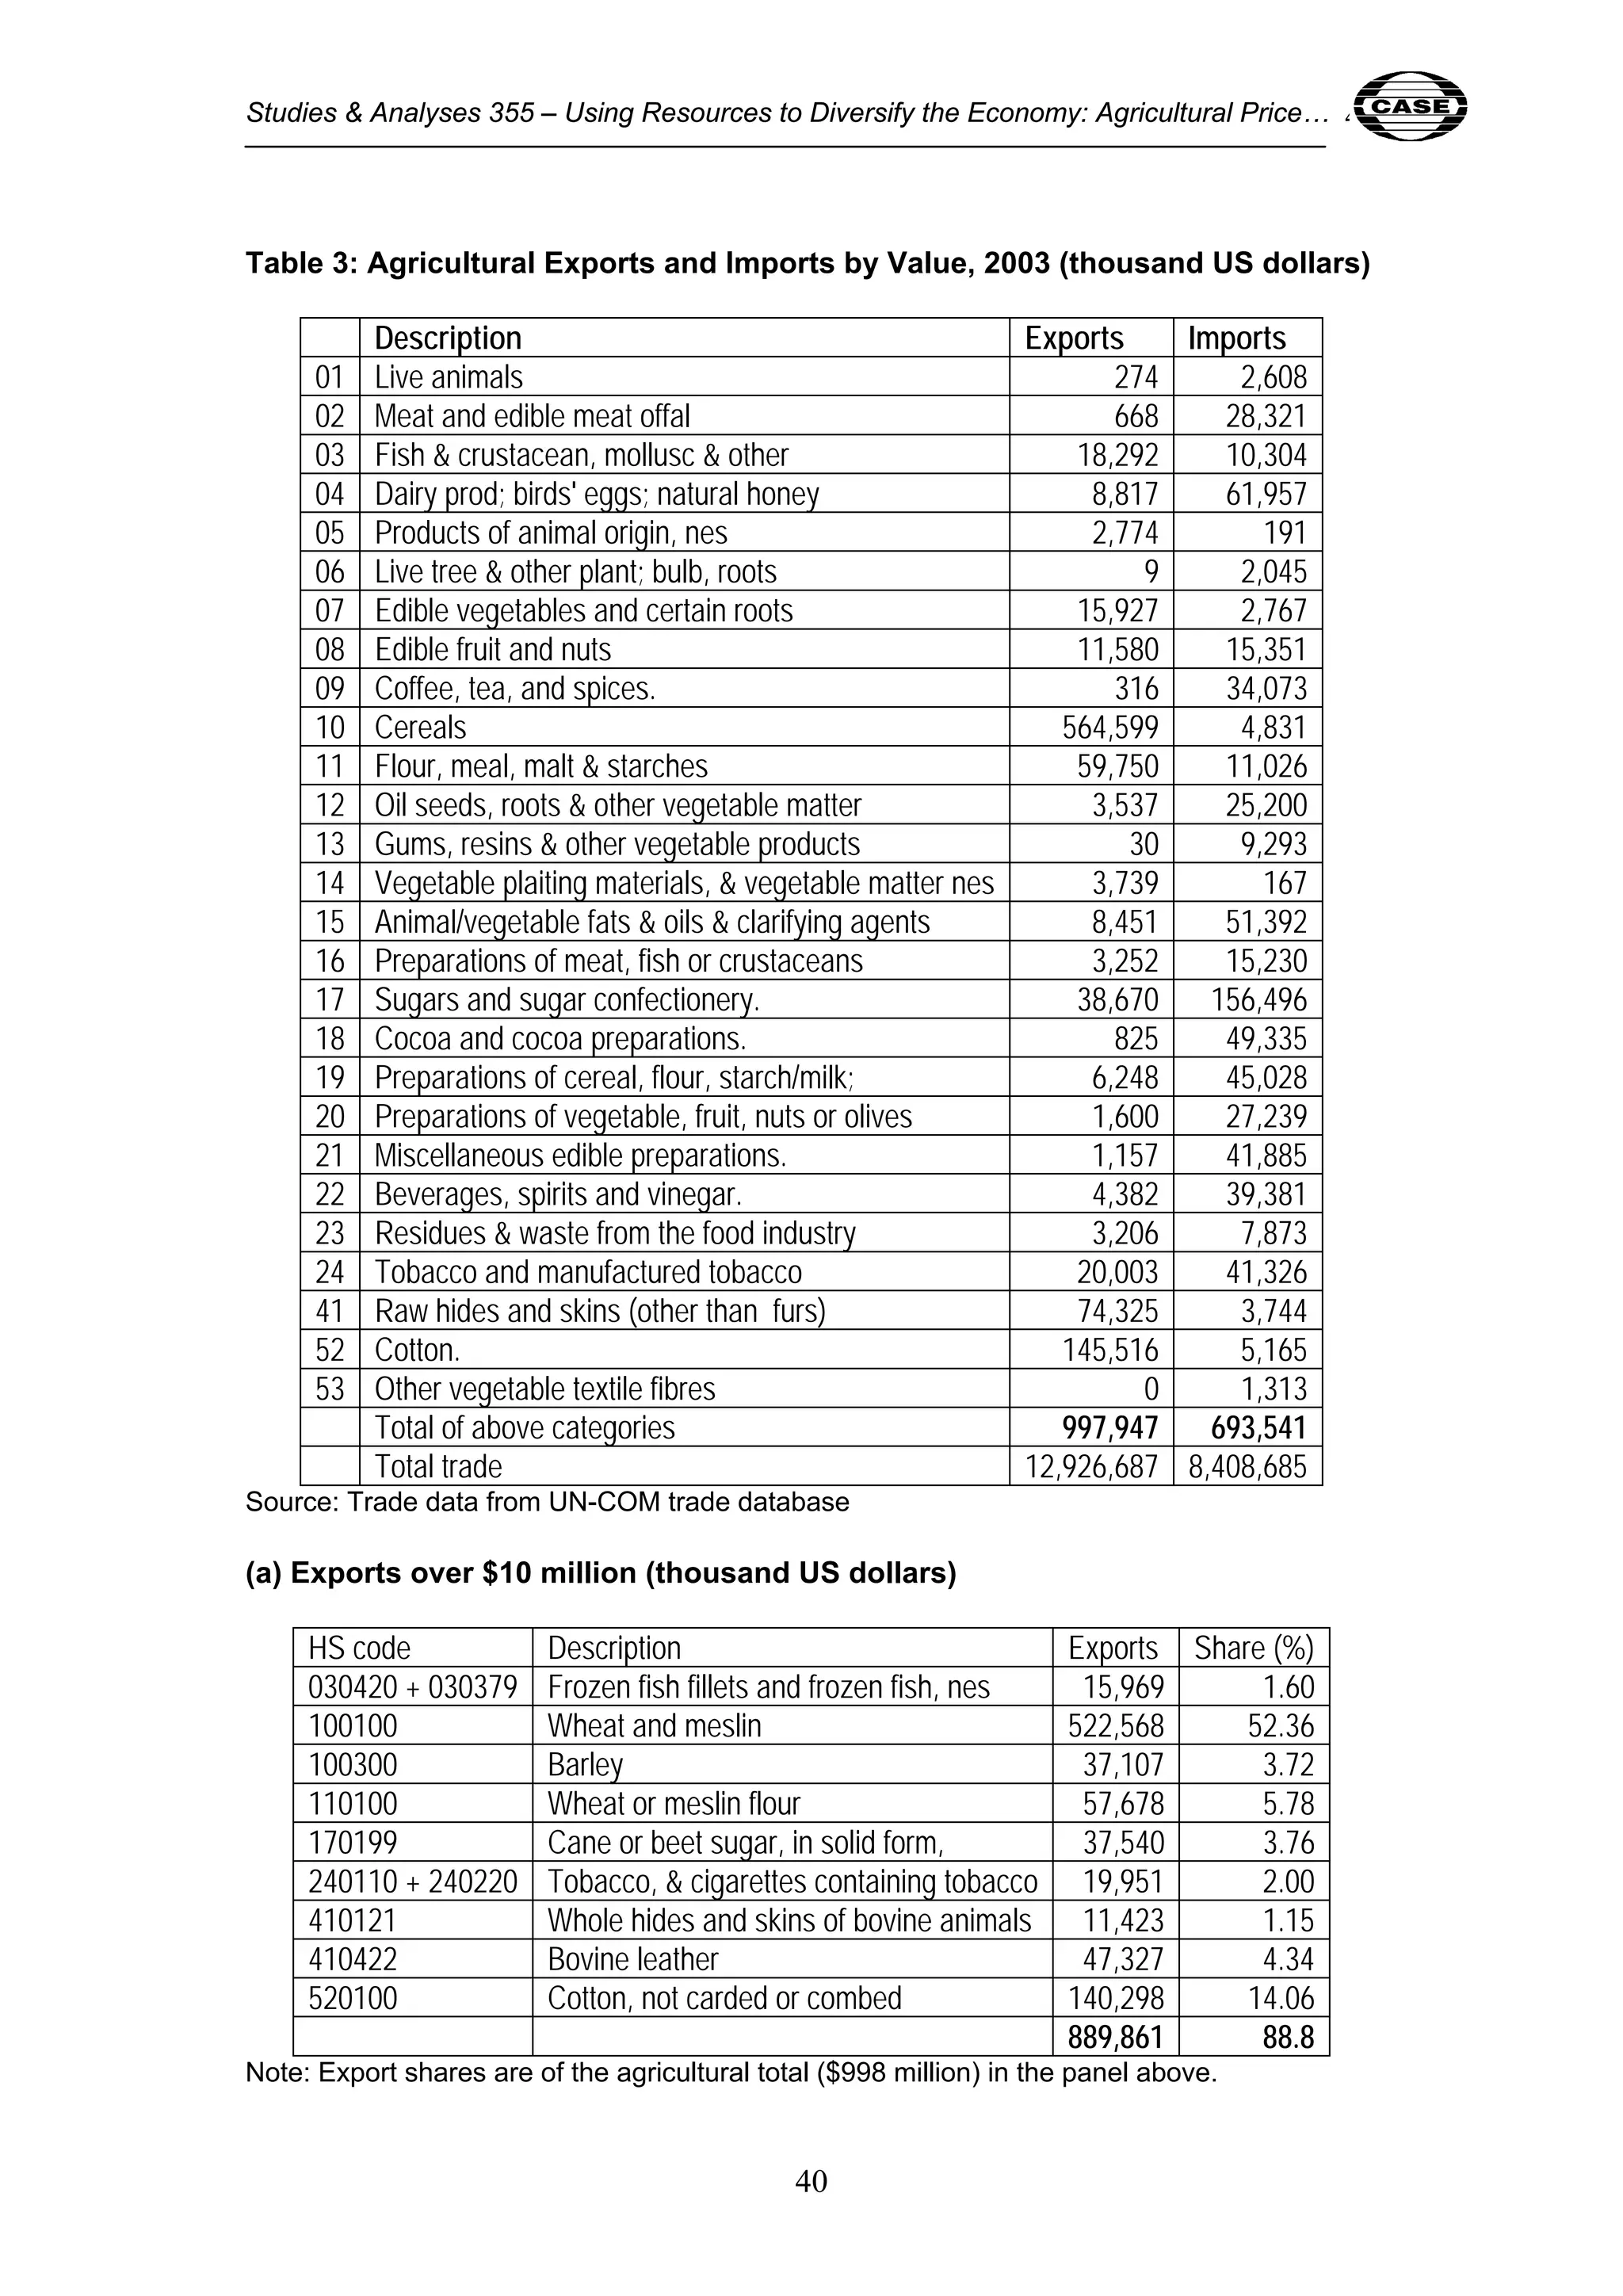
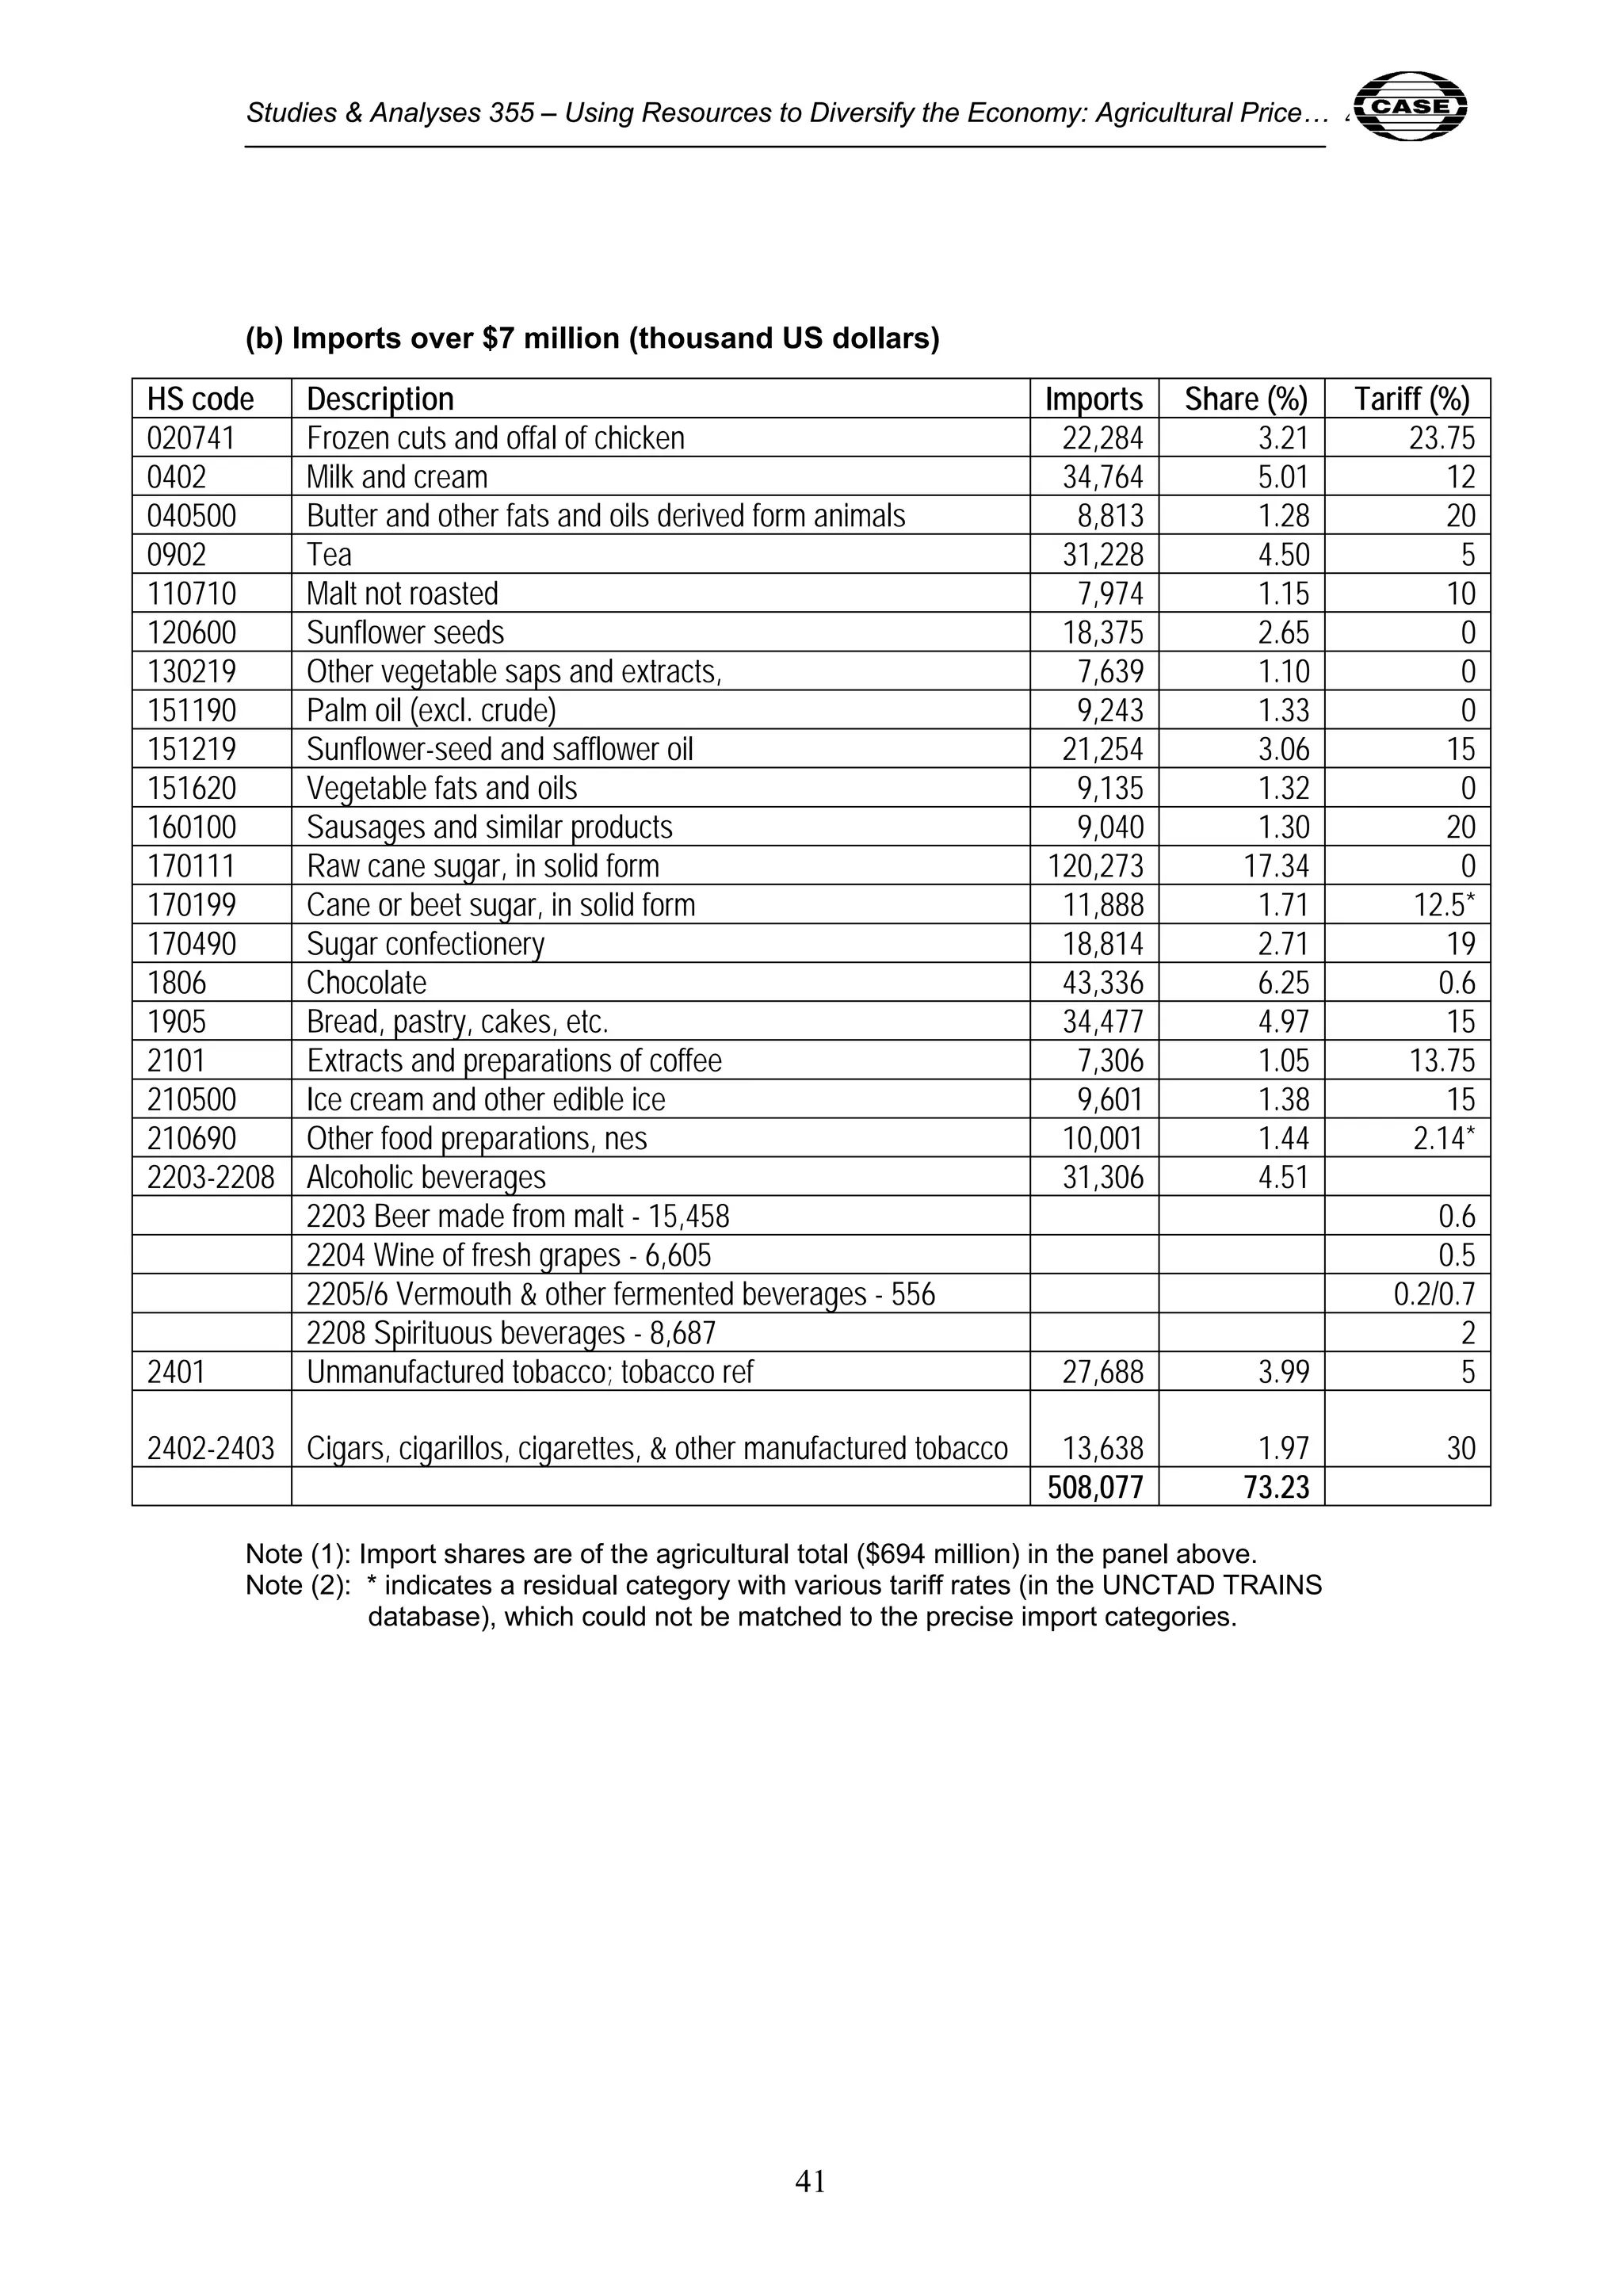
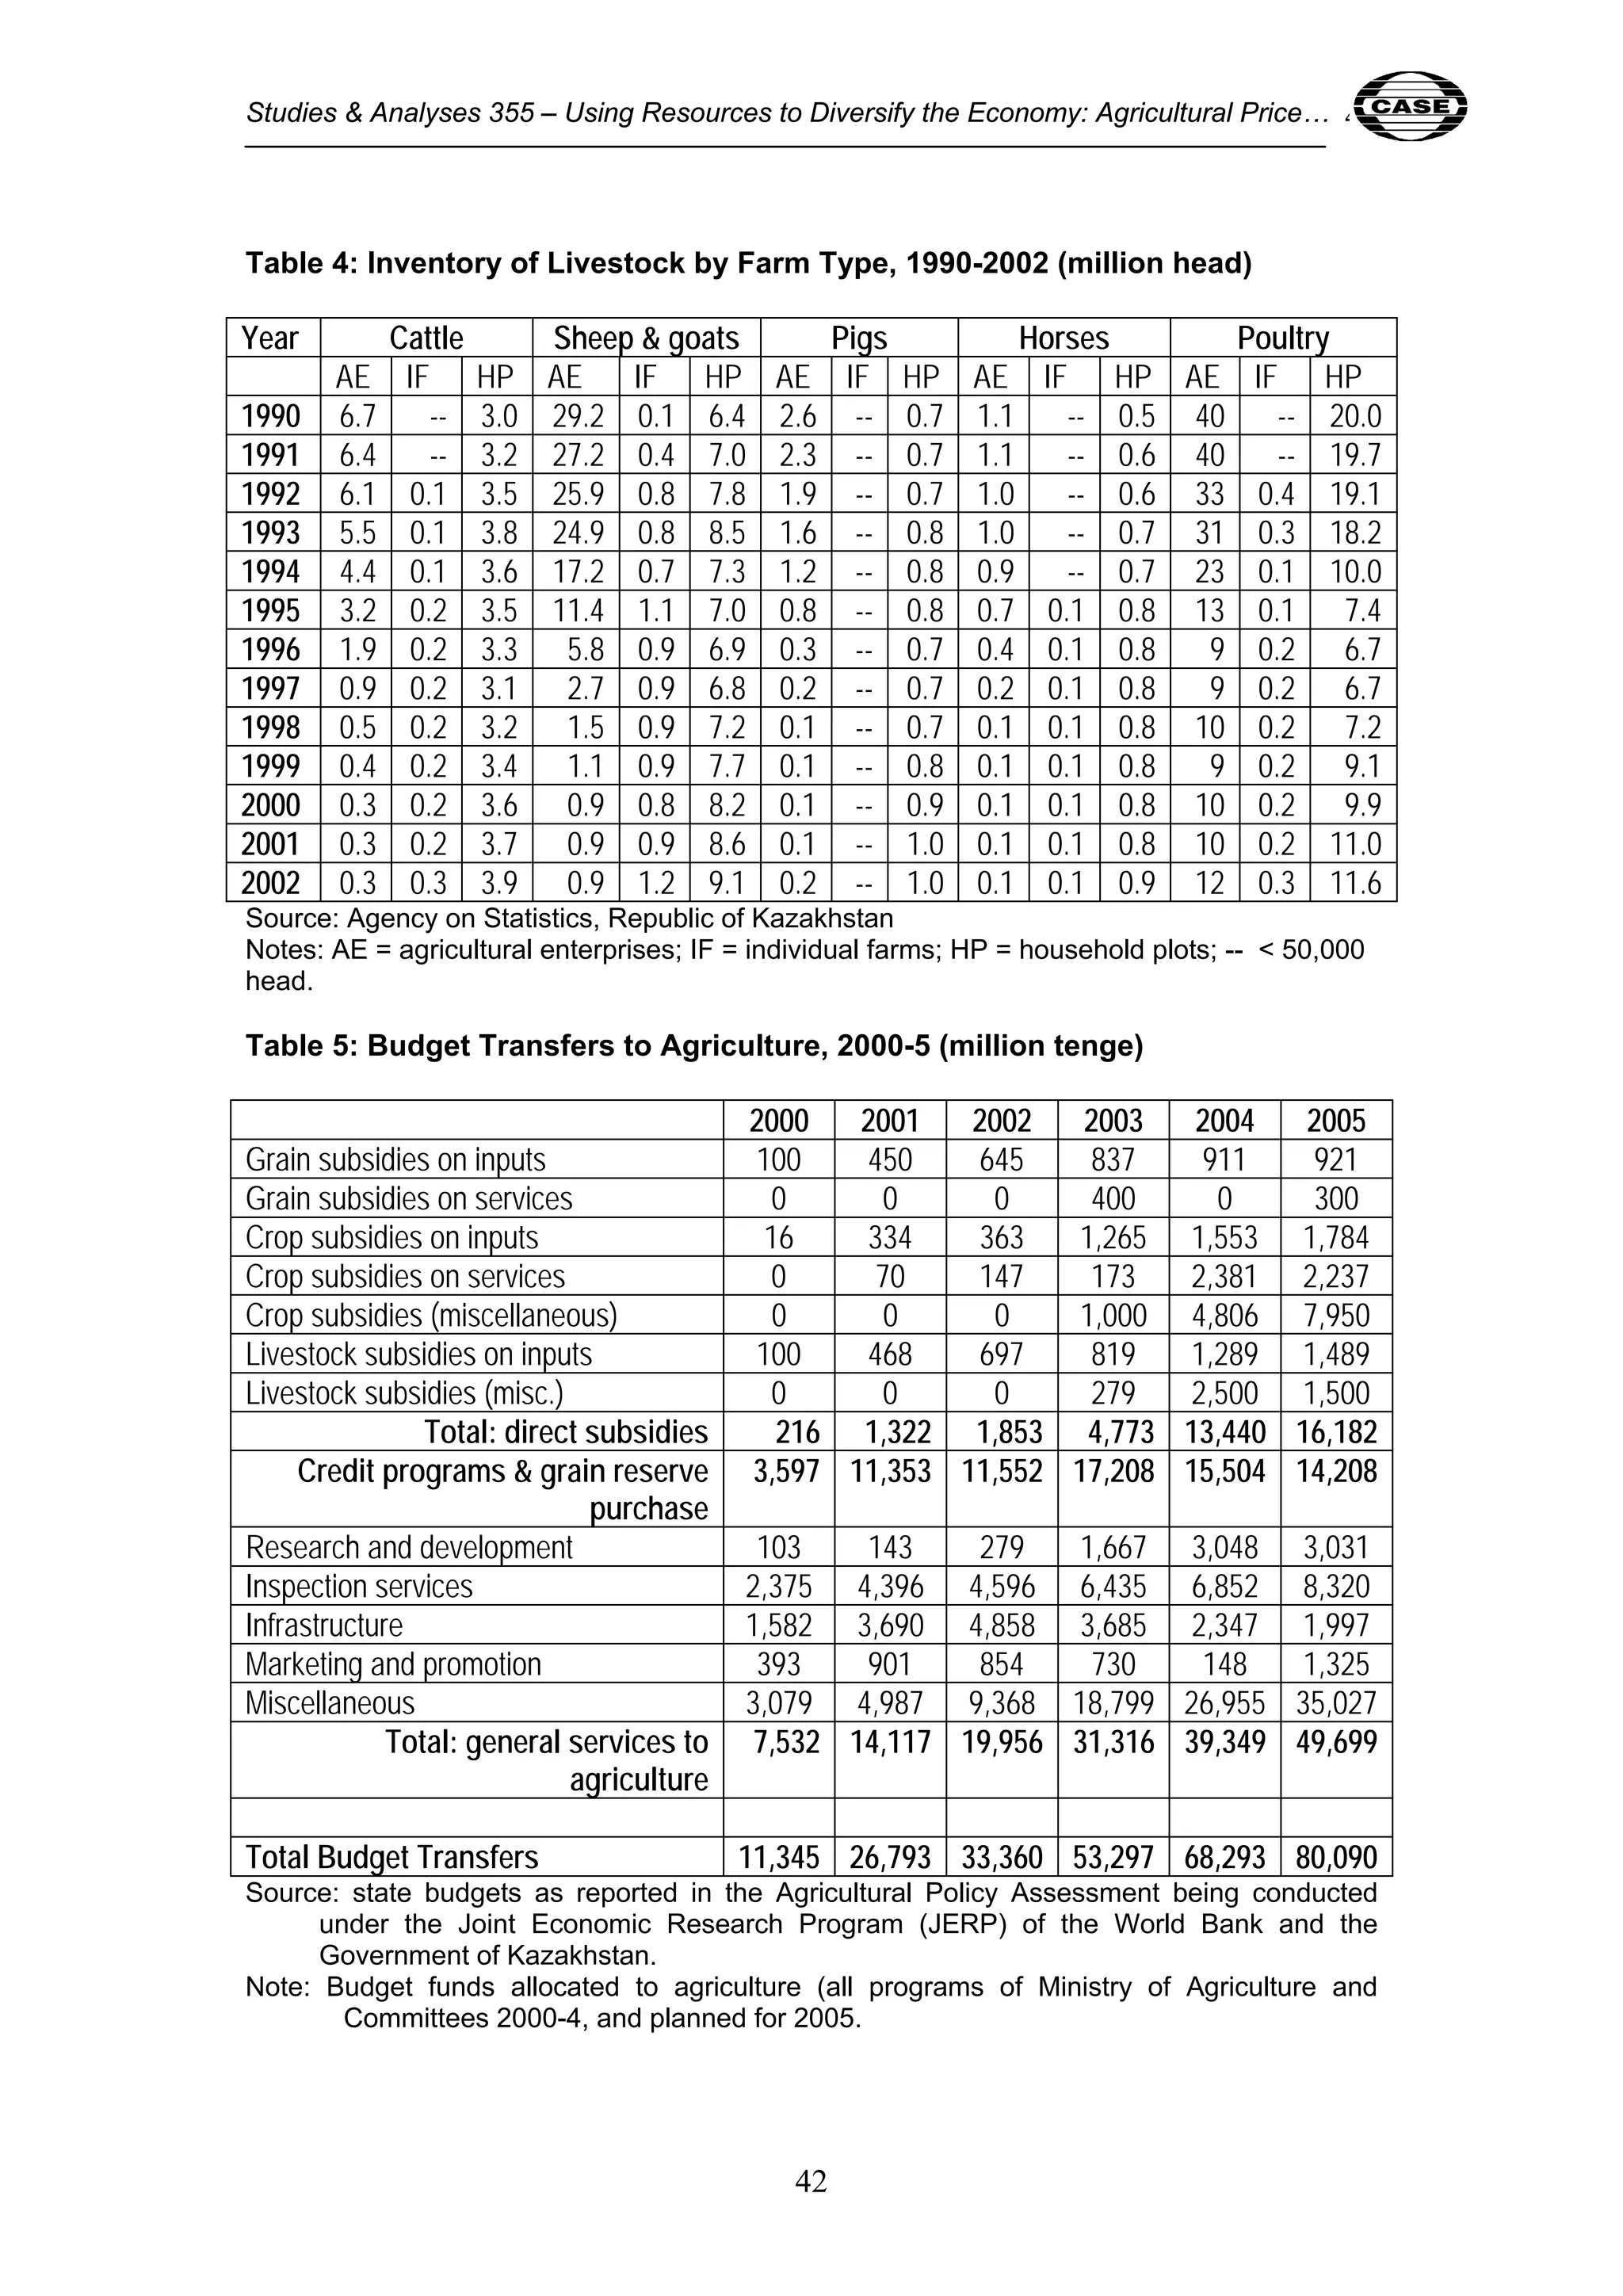
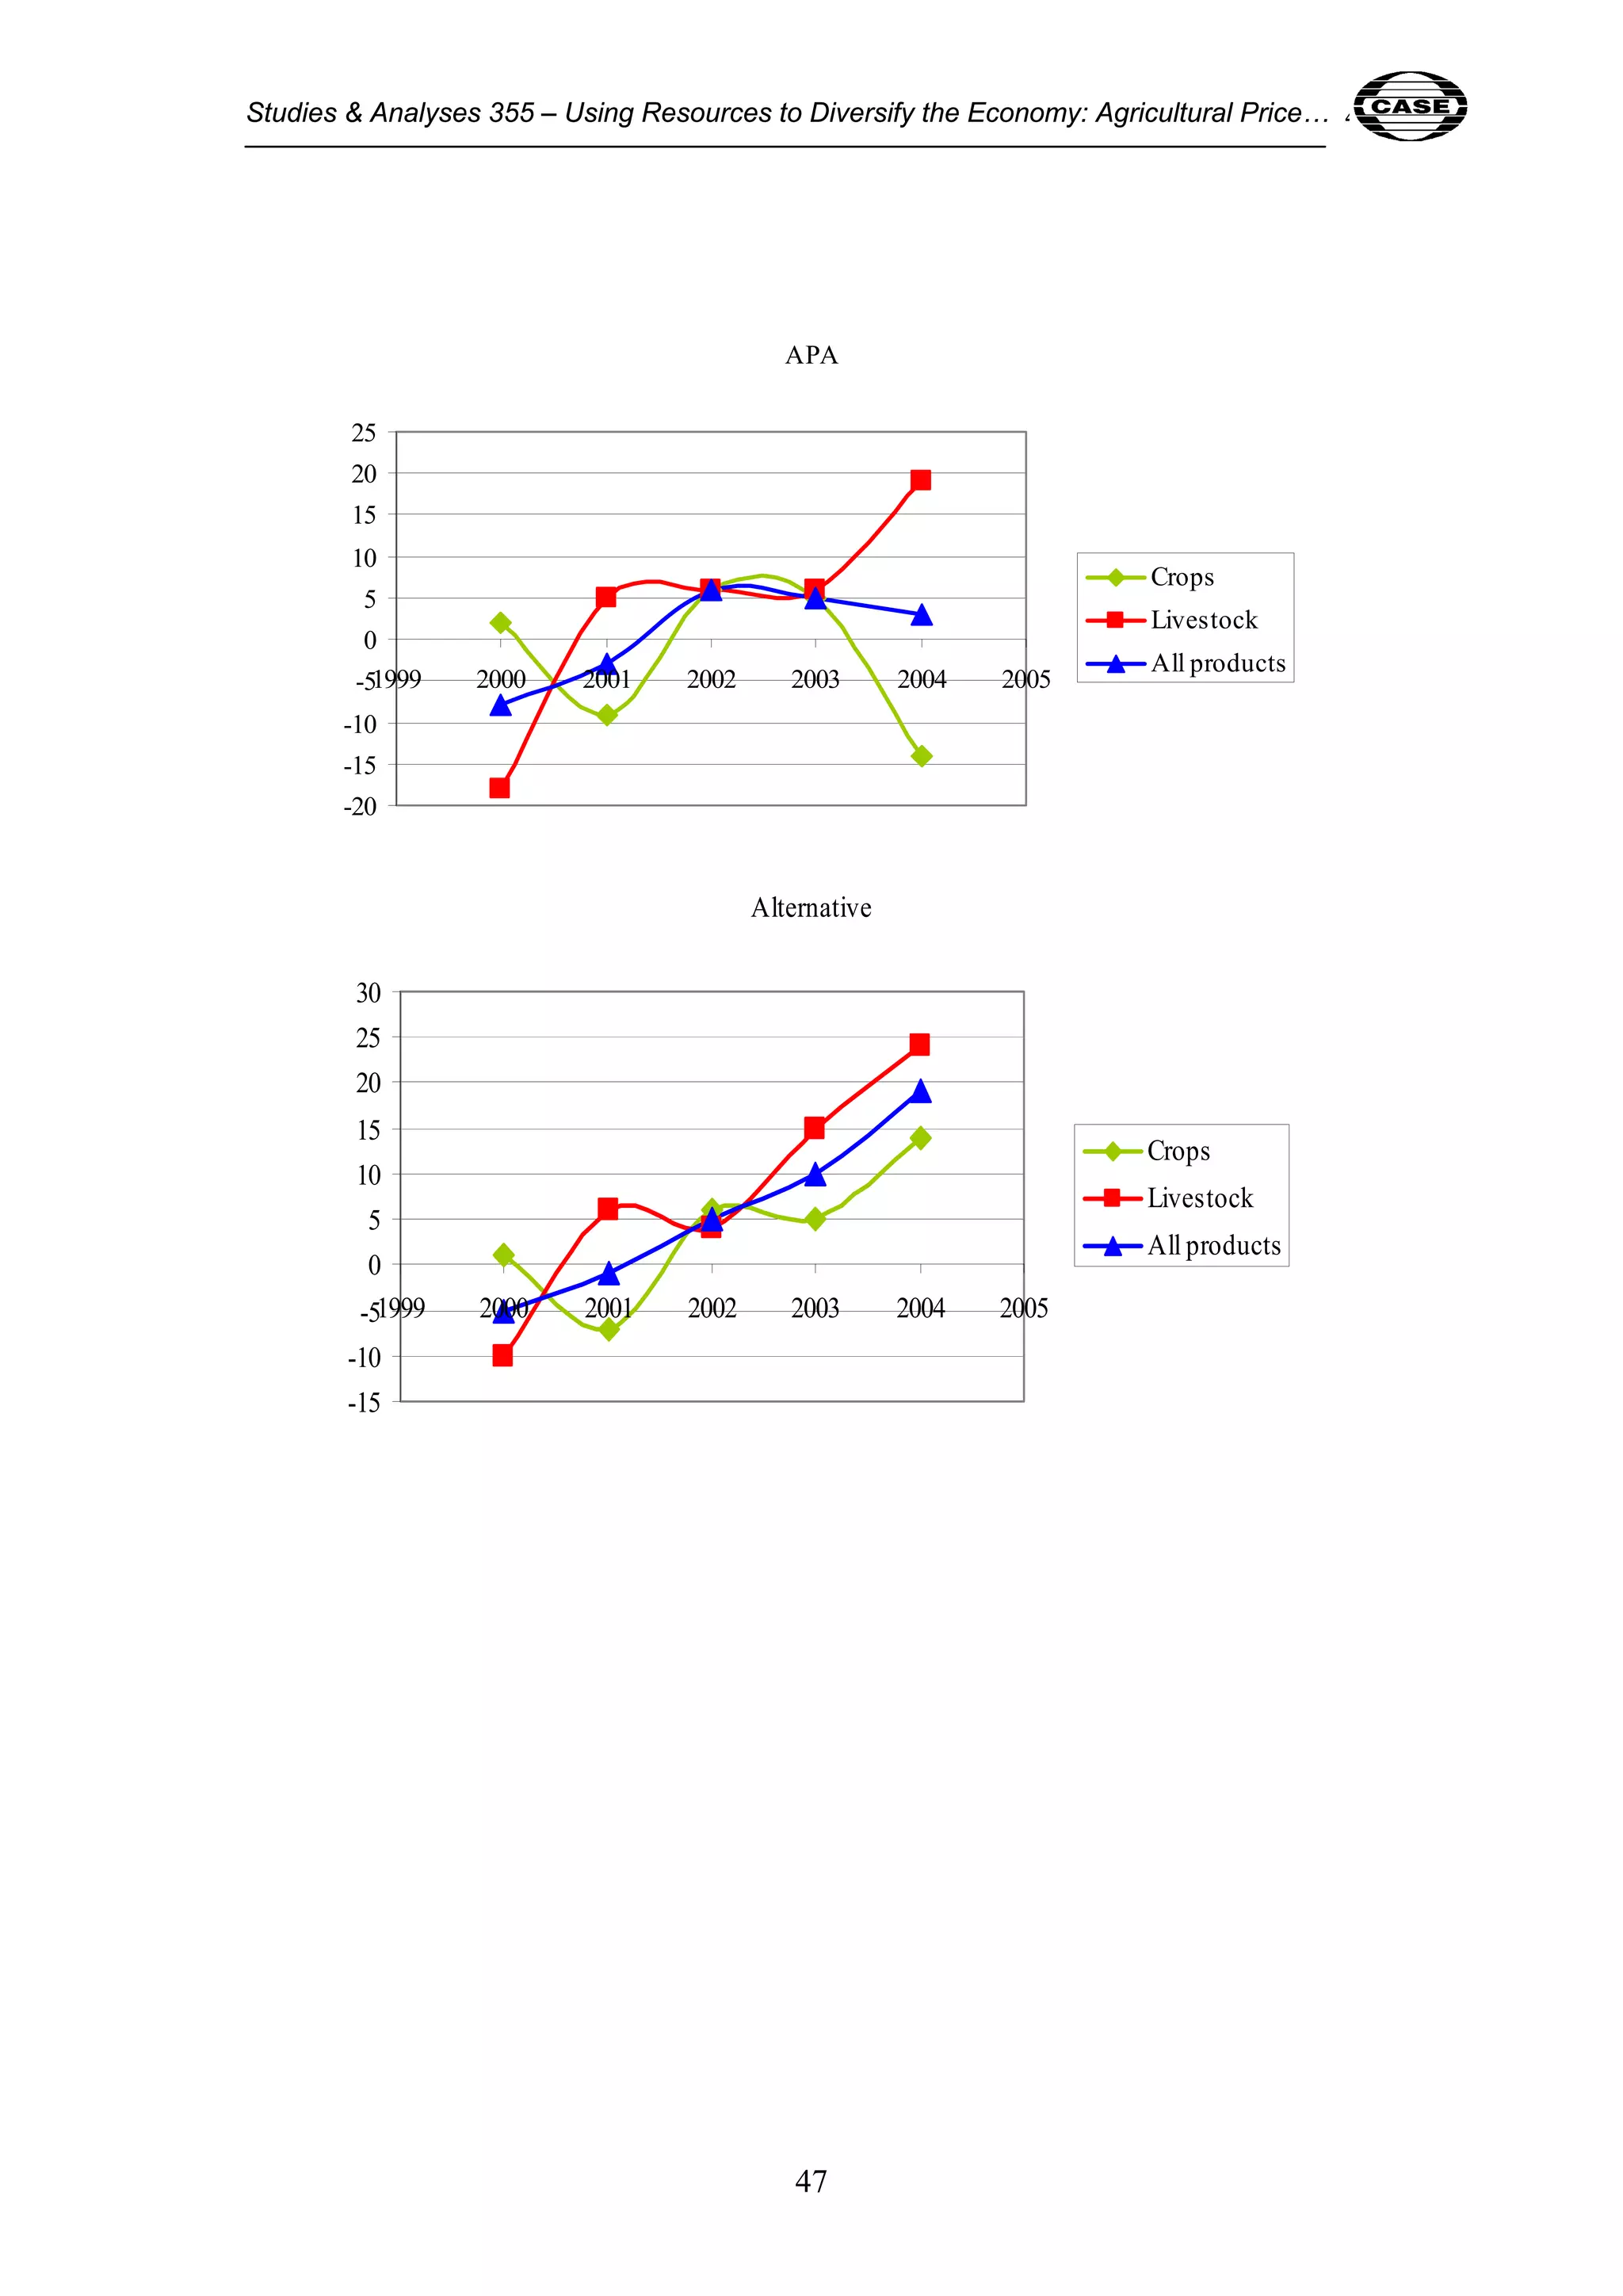
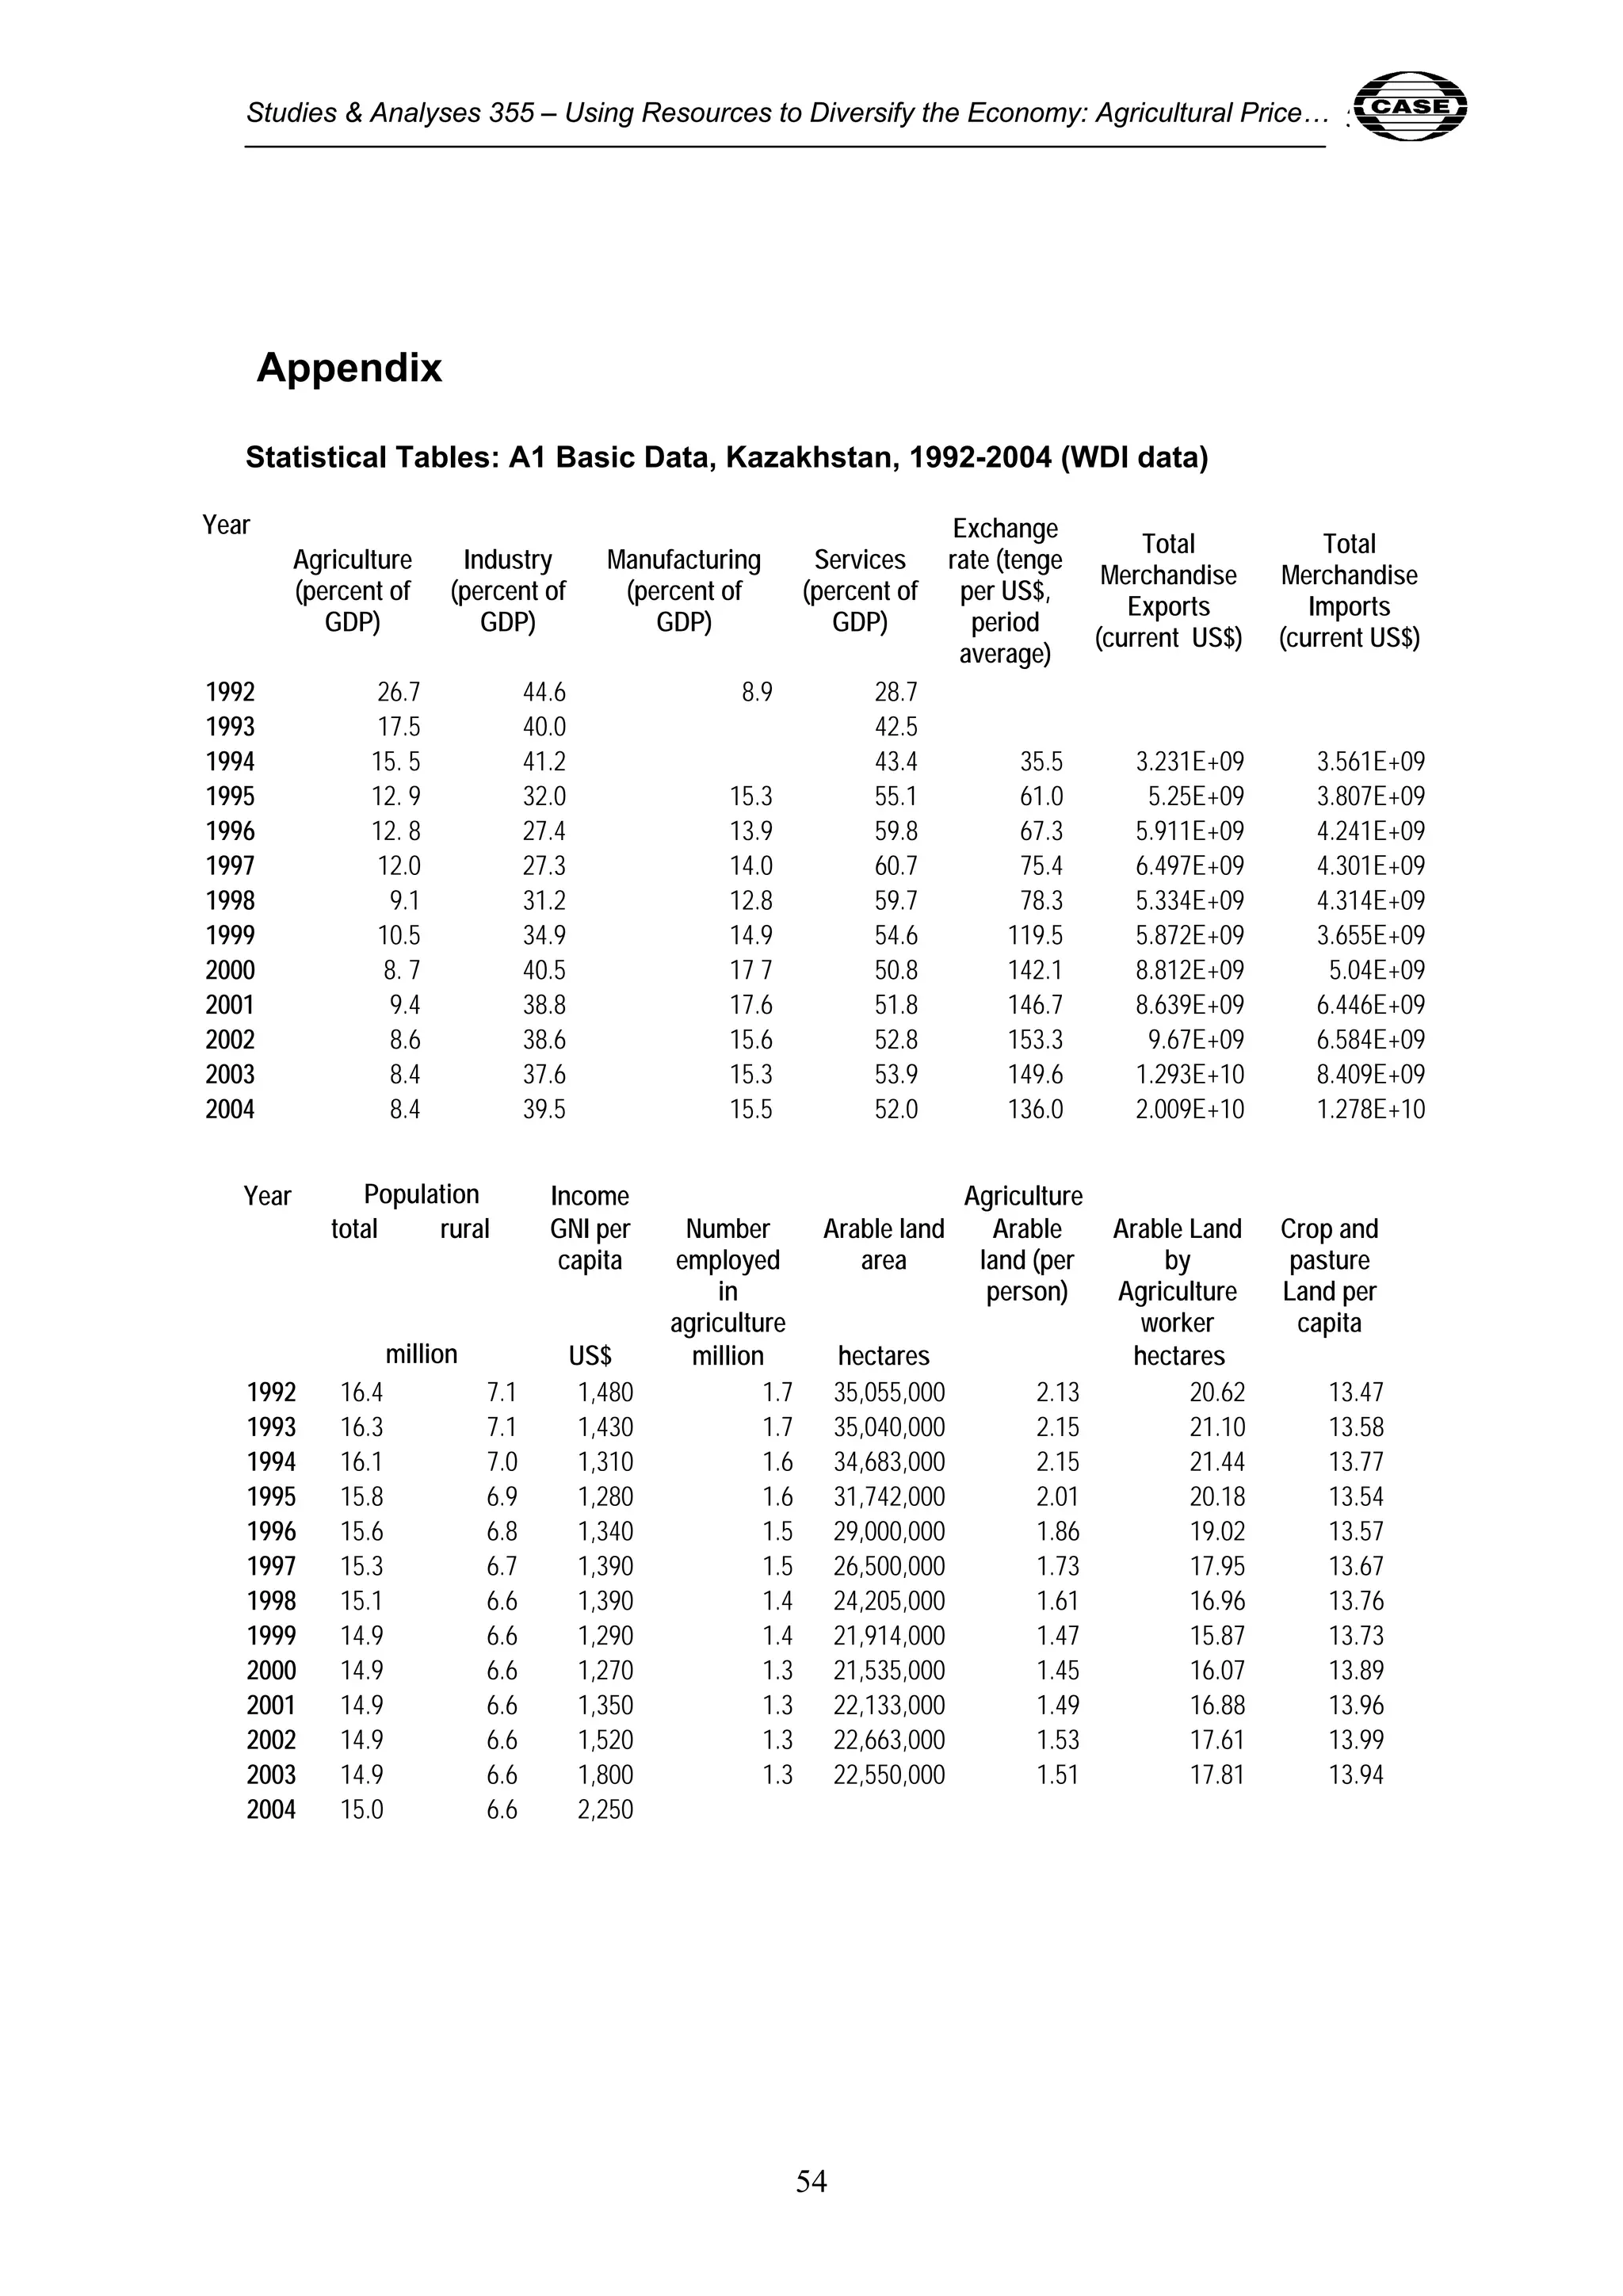

This document analyzes agricultural price distortions in Kazakhstan over time. It discusses how agricultural support shifted from favoring farmers under the Soviet system to disfavoring them after independence in the 1990s. Agricultural output declined sharply during this period. The document then examines how policies changed again in the 2000s to provide more support to agriculture, driven by revenues from oil exports. It aims to quantify the price distortions for key crops and livestock to understand the impacts of changing agricultural policies.


