Case 3Competition in the Craft Brewing Industry in 2017
John D. Varlaro
Johnson & Wales University
John E. Gamble
Texas A&M University–Corpus Christi
Locally produced or regional craft beers caused a seismic shift in the U.S. beer industry during the early 2010s with the gains of the small, regional newcomers coming at the expense of such well-known brands as Budweiser, Miller, Coors, and Bud Light. Craft breweries, which by definition sold fewer than 6 million barrels (bbls) per year, expanded rapidly with the deregulation of intrastate alcohol distribution and retail laws and a change in consumer preferences toward unique and high-quality beers. The growing popularity of craft beers allowed the total beer industry in the United States to increase by 6.7 percent annually between 2011 and 2016 to reach $39.5 billion. The production of U.S. craft breweries more than doubled from 11.5 million bbls per year to about 24.6 million bbls per year during that time. In addition, production by microbreweries and brewpubs accounted for 90 percent of craft brewer growth in 2016.1
The industry had begun to show signs of a slowdown going into 2017, with Boston Beer Company, the second largest craft brewery in the United States and known for its Samuel Adams brand, experiencing a 4 percent sales decline in 2016 that erased two years of of growth. The annual revenues of Anheuser-Busch InBev SA, whose portfolio included global brands Budweiser, Corona, and Stella Artois and numerous international and local brands, remained relatively consistent from 2014 to 2016. However, the sales volume of Anheuser-Busch’s flagship brands and its newly acquired and international brands such as Corona, Goose Island, Shock Top, Beck’s, and St. Pauli Girl allowed it to control 45.8 percent of the U.S. market for beer in 2016.2
Industry competition was increasing as grain price fluctuations affected cost structures and growing consolidation within the beer industry—led most notably by AB InBev’s acquisition of several craft breweries, Grupo Modelo, and its pending $104 billion acquisition of SABMiller—created a battle for market share. While the market for specialty beer was expected to gradually plateau by 2020, it appeared that the slowing growth had arrived by 2017. Nevertheless, craft breweries and microbreweries were expected to expand in number and in terms of market share as consumers sought out new pale ales, stouts, wheat beers, pilsners, and lagers with regional or local flairs.The Beer Market
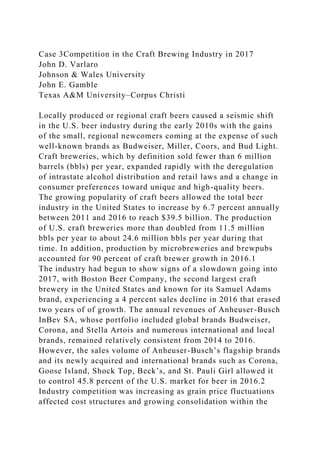
The total economic impact of the beer market was estimated to be 2.0 percent of the total U.S. GDP in 2016 when variables such as jobs within beer production, sales, and distribution were included.3Exhibit 1 presents annual beer production statistics for the United States between 2006 and 2016.
Year
Barrels Produced (in millions)*
2006
198
2007
200
2008
200
2009
197
2010
195
2011
193
2012
196
2013
192
2014
193
2015
191
2016
189
*Rounded to the nearest million. .
C128CASESCASE 20THE BOSTON BEER COMPANYThe Bost.docxRAHUL126667
C128
CASES
CASE 20
THE BOSTON BEER COMPANY*
The Boston Beer Company, known for its Samuel Adams brand, is the largest craft brewery in the United States, holding
a 1 percent stake in the overall beer market.1 It faces growing competitive threats from other breweries, both large and
small. In the past several years, the beer industry as a whole has been on a decline, while sales of wines and spirits have
increased. The Boston Beer Company competes within the premium beer industry, which includes craft beer and
premium imported beers like Heineken and Corona. Although the beer industry has been on a decline, the premium beer
industry has seen a small amount of growth, and the craft beer industry has seen a surge in popularity. Because of this
success of the craft breweries in particular the major breweries have taken notice and many new craft breweries have
sprung up.
Anheuser-Busch Inbev and MillerCoors, LLC, account for over 80 percent of the beer market in the United States.2
They have caught on to the current trend in the beer industry toward higher quality beers and have started releasing their
own higher quality beers. For example, Anheuser-Busch Inbev has released Bud Light Wheat and Bud Light Platinum in
an effort to provide quality beers to their loyal customers. MillerCoors makes Blue Moon beer, which is the most popular
craft beer in the United States. Anheuser-Busch Inbev released ShockTop to combat the popularity of Blue Moon. These
companies have also begun to purchase smaller craft breweries, whose products have been rising in popularity.
Anheuser-Busch Inbev purchased Goose Island Brewing Company in March 2011. MillerCoors has started a group
within the company titled Tenth and Blake Beer Company for the purpose of creating and purchasing craft breweries.
According to MillerCoors CEO Tom Lang, the plan is to grow Tenth and Blake Beer Company by 60 percent within the
next three years.3 The two major companies plan to use their massive marketing budgets to tell people about their craft
beers.
According to the Brewers Association, 1,940 craft breweries and 1,989 total breweries operated in the United States
for some or all of 2011. While craft breweries account for over 97 percent of all the breweries in the United States, they
only produce approximately 25 percent of all beer sold.4 However, with the rise in popularity of premium beers, the craft
breweries will continue to grab more of the market. As the country’s largest craft brewery, the Boston Beer Company
had revenue of over $500 million in 2011 and sold over 2 million barrels of beer. Other large craft breweries include
New Belgium Brewing Company and Sierra Nevada Brewing Company, which sold over 580,000 and 720,000 barrels of
beer in 2011, respectively.5 In addition, some smaller breweries have been merging to take advantage of economies of
scale and enhance their competitive position.
According to the Boston Beer Company, there are approximat ...
Annual Report 2011Annual Report 2011W here innovationis .docxrossskuddershamus
Annual Report 2011Annual Report 2011
W here innovation
is always bre wing
THE BOSTON BEER COMPANY
41007_5c.indd 141007_5c.indd 1 3/28/12 3:53 PM3/28/12 3:53 PM
NUMBER OF DIFFERENT
RECIPES BREWED
100
NUMBER OF BEERS BREWED
AND RELEASED
54
NUMBER OF NEW BEERS
INTRODUCED (INCLUDING
LONGSHOT)
23
NUMBER OF AWARDS
AND MEDALS
287
2011
by the numbers
We served 54 of those Samuel Adams®
beer styles, however, to beer lovers. That’s
a record for us. We are especially proud
to report that 23 styles were new to our
line-up. Later in this report, we’ll talk
about the explosion of new breweries
across the country. It is an exciting time
to be in the craft beer business. As the
leader in the craft category, we think
Samuel Adams has continued to lead
in creativity and variety. Among those
54 beers, we have pushed boundaries
to create many exciting, innovative
beer styles sure to surprise and enchant
even the most adventurous craft beer
afi cionado.
If we wanted to characterize 2011 for you in a single word, that
word would be “innovation”. Never before has our industry
experienced such a pace of innovation. Drinkers demand it.
Despite our being the largest craft brewer (at 1% of total US
beer sales), we maintained our agility, and in 2011 that paid
off. All departments from brewing to operations to sales and
marketing, teamed up to maintain our leadership position.
Think about it; every beer we bring to market has to go
through its own regulatory approval process. It needs its own
unique packaging, and our sales force needs to introduce it to
wholesalers, retailers and drinkers. While 2011 was a year when
we had to balance speed and excellence, chaos
and effi ciency, and creativity and order, we are
proud of what we accomplished in 2011, and
we always look forward to this opportunity to
bring you up to date about what’s brewing.
A Look Back at 2011
For years we have joked about how in 1984
we were invisible, and how over the years we
grew from invisible, to insignifi cant, then
infi nitesimal and then tiny. We longed to be
small, and we’re proud to say, in 2011, we crossed
that threshold to small. The Boston Beer Company
now offi cially has just over 1% of the U.S. beer
market. We depleted more than two million
barrels of beer, 2.41 million to be precise. Given
that our original goal was to sell 5,000 barrels
a year of just one style of beer, Samuel Adams
Boston Lager®, and just within Massachusetts,
this is a pretty staggering accomplishment. Our
total Boston Beer Company depletions growth in
2011 was 7.2%.
The Boston Beer Company
now of fi cially has just over
1% of the U.S. beer market.
“One Hundred Bottles of Beer on
the Wall.” Who has not been part of a team returning from an outing and
heard that song sung ad infi nitum, right down to the last beer? For The Boston Beer Company
the “team” is our 840 employees, and in 2011 we really did brew one hundred distinct beers. .
Demographic Conditions prompt a Gloomy Canadian Beer Outlook: Ken ResearchKen Research Pvt ltd.
Canada Beer Market Insights 2016 Report provides a complete overview of the Canada beer industry structure offering a comprehensive insight into historical background trends, 2015 performance and 2016 outlook.
Running Head MKTG PLAN - THE BOSTON TEA .docxjeanettehully
Running Head: MKTG PLAN - THE BOSTON TEA 1
Running Head: MKTG PLAN - THE BOSTON TEA 20
Business Plan: The Boston Tea
Team A
Executive Summary
The Boston Beer Company’s products are one of the most recognized brands in the alcoholic beverage market, especially in the craft beer market. But the trends in the craft spirit market are changing and we are on the verge of a change similar to the one the market experienced in the craft beer market 7 -8 years ago and the Boston Beer Company with it unique expertise can make a difference and substantial profits, as it did with the Craft beer market.
What we have accomplished?
The Boston Beer Company’s goal is to becoming the leading supplier of Better Beer market and we have become the largest supplier of quality craft beer. We are proud to have introduced into the market world-class variety of traditional and innovative alcoholic beverages under brand names Samuel Adams, Angry Orchard and Twisted Tea. The company’s growth has been fueled by both alcoholic and non-alcoholic beverage, but more so by the hard ciders. But the trends in the spirits market are on the cusp of a new change. The spirits market is going through newer disruptive new innovations. The Boston Brewing Company, with its unique expertise, experience of reshaping craft beer market can be a disruptive force in the Craft Spirit market.
Therefore, we propose to introduce a new craft spirit, a moonshine, under the name “THE BOSTON TEA”.
Who are our customers
Traditionally spirits have been consumer mostly by men, especially older men. But recently consumer interest has risen in moonshines and craft spirits. The consumers mostly young men and women between the ages 25-44 are increasingly gravitating towards the high quality spirits with unique flavors rather than just plain spirits. The increase in the number of manufacturers of moonshines in the southern United States and their popularity among the consumers reflects this trend (The Boston Beer Company, Inc., 2017)
How big is the market
The Spirit market in United States is approximately $7.5 billion in 2017 and the craft spirit market accounts for only 0.5% of the sales. But we need to remember that the craft spirit market has very near market origin. The global Craft Spirit markets is expected to grow at a staggering rate from 2017 to 2025 to more than $80 billion dollar business and United States is projected to account for nearly 53% of that sales. The opportunity for a tremendous growth in this market is potentially huge.
What’s our strategy goal
Boston Beer Company has always had the goal of becoming the number one producer of the quality beer in the better beer category and we accomplished this by offering customers unique and quality beer. We will employ the same strategy employed for the craft beer market i.e, make early inroads into the craft ...
CASE 6B – CHESTER & WAYNE Chester & Wayne is a regional .docxannandleola
CASE 6B – CHESTER & WAYNE
Chester & Wayne is a regional food distribution company. Mr. Chester, CEO, has asked your
assistance in preparing cash-flow information for the last three months of this year. Selected
accounts from an interim balance sheet dated September 30, have the following balances:
Cash $142,100 Accounts payable $354,155
Marketable securities 200,000 Other payables 53,200
Accounts receivable $1,012,500
Inventories 150,388
Mr. Wayne, CFO, provides you with the following information based on experience and
management policy. All sales are credit sales and are billed the last day of the month of sale.
Customers paying within 10 days of the billing date may take a 2 percent cash discount. Forty
percent of the sales is paid within the discount period in the month following billing. An
additional 25 percent pays in the same month but does not receive the cash discount. Thirty
percent is collected in the second month after billing; the remainder is uncollectible. Additional
cash of $24,000 is expected in October from renting unused warehouse space.
Sixty percent of all purchases, selling and administrative expenses, and advertising expenses is
paid in the month incurred. The remainder is paid in the following month. Ending inventory is
set at 25 percent of the next month's budgeted cost of goods sold. The company's gross profit
averages 30 percent of sales for the month. Selling and administrative expenses follow the
formula of 5 percent of the current month's sales plus $75,000, which includes depreciation of
$5,000. Advertising expenses are budgeted at 3 percent of sales.
Actual and budgeted sales information is as follows:
Actual: Budgeted:
August $750,000 October $826,800
September 787,500 November 868,200
December 911,600
January 930,000
The company will acquire equipment costing $250,000 cash in November. Dividends of $45,000
will be paid in December.
The company would like to maintain a minimum cash balance at the end of each month of
$120,000. Any excess amounts go first to repayment of short-term borrowings and then to
investment in marketable securities. When cash is needed to reach the minimum balance, the
company policy is to sell marketable securities before borrowing.
Questions (use of spreadsheet software is recommended):
1. Prepare a cash budget for each month of the fourth quarter and for the quarter in total.
Prepare supporting schedules as needed. (Round all budge.
CASE 9 Bulimia Nervosa Table 9-1 Dx Checklist Bulimia Nervos.docxannandleola
"CASE 9 Bulimia Nervosa Table 9-1 Dx Checklist Bulimia Nervosa 1. Repeated binge-eating episodes. 2. Repeated performance of ill-advised compensatory behaviors (e.g., forced vomiting) to prevent weight gain. 3. Symptoms take place at least weekly for a period of 3 months. 4. Inappropriate influence of weight and shape on appraisal of oneself. (Based on APA, 2013.) Rita was a 26-year-old manager of a local Italian restaurant and lived in the same city as her parents. Her childhood was not a happy one. Her parents divorced when she was about 5 years of age. She and her three older brothers remained with their mother, who often seemed overwhelmed with her situation and unable to run the household effectively. Rita would often refer to her childhood as utterly chaotic, as if no one were in charge. Within a 12-month period, 1 percent to 1.5 percent of individuals will meet the diagnostic criteria for bulimia nervosa; at least 90 percent of cases occur in females (APA, 2013). She nevertheless muddled through. When her brothers were finally all off to college or beyond, Rita entered high school, and the household seemed more manageable. Ultimately, she developed a close relationship with her mother, indeed too close, Rita suspected. Her mother seemed like her closest friend, at times the entire focus of her social life. They were both women alone, so to speak, and relied heavily on one another for comfort and support, preventing Rita from developing serious friendships. The two often went shopping together. Rita would give her mother an update on the most recent fashion trends, and her mother would talk to Rita about “how important it is to look good and be put together in this day and age.” Rita didn’t mind the advice, but sometimes she did wonder if her mother kept saying that as a way of telling her that she didn’t think she looked good. Rita later attended a local public college, majoring in business. However, she quit after 3 years to take a job at the restaurant. She had begun working in the restaurant part-time while a sophomore and after 2 years was offered the position of daytime manager. It was a well-paying job, and since her interest was business anyway, Rita figured it made sense to seize an attractive business opportunity. Her mother was not very supportive of her decision to leave college, but Rita reassured her that she intended to go back and finish up after she had worked for a while and saved some money. Just before leaving college, Rita began a serious relationship with a man whom she met at school. Their interest in each other grew, and they eventually got engaged. Everything seemed to be going well when out of the blue, her fiancé’s mental state began to deteriorate. Ultimately he manifested a pattern of schizophrenia and had to be hospitalized. As his impairment extended from days to months and then to more than a year, Rita finally had to end the engagement; she had to pick up the pieces and go on without him. She felt .
Case 9 Bulimia Nervosa in Gorenstein and Comer (2014)Rita was a.docxannandleola
Case 9: Bulimia Nervosa in Gorenstein and Comer (2014)
Rita was a 26-year-old manager of a local Italian restaurant and lived in the same city as her parents. Her childhood was not a happy one. Her parents divorced when she was about 5 years of age. She and her three older brothers remained with their mother, who often seemed overwhelmed with her situation and unable to run the household effectively. Rita would often refer to her childhood as utterly chaotic, as if no one were in charge. Within a 12-month period, 1 percent to 1.5 percent of individuals will meet the diagnostic criteria for bulimia nervosa; at least 90 percent of cases occur in females (APA, 2013). She nevertheless muddled through. When her brothers were finally all off to college or beyond, Rita entered high school, and the household seemed more manageable. Ultimately, she developed a close relationship with her mother, indeed too close, Rita suspected. Her mother seemed like her closest friend, at times the entire focus of her social life. They were both women alone, so to speak, and relied heavily on one another for comfort and support, preventing Rita from developing serious friendships. The two often went shopping together. Rita would give her mother an update on the most recent fashion trends, and her mother would talk to Rita about “how important it is to look good and be put together in this day and age.” Rita didn’t mind the advice, but sometimes she did wonder if her mother kept saying that as a way of telling her that she didn’t think she looked good. Rita later attended a local public college, majoring in business. However, she quit after 3 years to take a job at the restaurant. She had begun working in the restaurant part-time while a sophomore and after 2 years was offered the position of daytime manager. It was a well-paying job, and since her interest was business anyway, Rita figured it made sense to seize an attractive business opportunity. Her mother was not very supportive of her decision to leave college, but Rita reassured her that she intended to go back and finish up after she had worked for a while and saved some money. Just before leaving college, Rita began a serious relationship with a man whom she met at school. Their interest in each other grew, and they eventually got engaged. Everything seemed to be going well when out of the blue, her fiancé’s mental state began to deteriorate. Ultimately he manifested a pattern of schizophrenia and had to be hospitalized. As his impairment extended from days to months and then to more than a year, Rita finally had to end the engagement; she had to pick up the pieces and go on without him. She felt as if he had died. A period of psychotherapy helped ease her grief and her adjustment following this tragedy, and eventually she was able to move on with her life and to resume dating again. However, serious relationships eluded her. Rita knew that she was a moody person—she judged people harshly and displayed irrita.
Case 8.1 Pros and Cons of Balkan Intervention59Must the a.docxannandleola
Case 8.1 Pros and Cons of Balkan Intervention59
“Must the agony of Bosnia-Herzegovina be regarded, with whatever regrets, as somebody else’s trouble?
We don’t think so, but the arguments on behalf of that view deserve an answer. Among them are the
following:
The Balkan conflict is a civil war and unlikely to spread beyond the borders of the former
Yugoslavia. Wrong. Belgrade has missiles trained on Vienna. Tito’s Yugoslavia claimed, by way of
Macedonia, that northern Greece as far south as Thessaloniki belonged under its sovereignty. Those
claims may return. ‘Civil’ war pitting non-Slavic Albanians against Serbs could spread to Albania,
Turkey, Bulgaria, and Greece.
The United States has no strategic interest in the Balkans. Wrong. No peace, no peace dividend.
Unless the West can impose the view that ethnic purity can no longer be the basis for national
sovereignty, then endless national wars will replace the Cold War. This threat has appeared in
genocidal form in Bosnia. If it cannot be contained here, it will erupt elsewhere, and the Clinton
administration’s domestic agenda will be an early casualty.
If the West intervenes on behalf of the Bosnians, the Russians will do so on behalf of the Serbs, and
the Cold War will be reborn. Wrong. The Russians have more to fear from ‘ethnic cleansing’ than
any people on Earth. Nothing would reassure them better than a new, post-Cold War Western
policy of massive, early response against the persecution of national minorities, including the
Russian minorities found in every post-Soviet republic. The Russian right may favor the Serbs, but
Russian self-interest lies elsewhere.
The Serbs also have their grievances. Wrong. They do, but their way of responding to these
grievances, according to the State Department’s annual human rights report, issued this past week,
‘dwarfs anything seen in Europe since Nazi times.’ Via the Genocide Convention, armed
intervention is legal as well as justified.
The UN peace plan is the only alternative. Wrong. Incredibly, the plan proposes the reorganization
of Bosnia-Herzegovina followed by a cease-fire. A better first step would be a UN declaration that
any nation or ethnic group proceeding to statehood on the principle of ethnic purity is an outlaw
state and will be treated as such. As now drafted, the UN peace plan, with a map of provinces that
not one party to the conflict accepts, is really a plan for continued ‘ethnic cleansing.’”
Case 8.2 Images, Arguments, and the Second Persian Gulf Crisis, 1990–
1991
The analysis of policy arguments can be employed to investigate the ways that policymakers represent or
structure problems (Chapter 3). We can thereby identify the images, or problem representations, that
shape processes of making and justifying decisions. For example, during times of crisis, the images which
United States policymakers have of another country affect deliberations about the use of peacekeeping
and negotiation, the imposition of economic sanctions, o.
Case 6-2 Not Getting Face Time at Facebook—and Getting the Last La.docxannandleola
Case 6-2 Not Getting Face Time at Facebook—and Getting the Last Laugh!
In August 2009, Facebook turned down job applicant Brian Acton, an experienced engineer who had previously worked at Yahoo and Apple. More than 4 years later, Facebook paid him $3 billion to acquire his 20% stake of WhatsApp, a start-up he had cofounded immediately after Facebook rejected his job application.(1) WhatsApp Messenger is a proprietary, cross-platform, instant-messaging subscription service for smartphones and selected feature phones that use the Internet for communication. In addition to text messaging, users can send each other images, video, and audio media messages, as well as their location using integrated mapping features.(2) How could Facebook, a highly successful firm, have made such a drastic mistake?
Back in 2009, Brian Acton was a software engineer who was out of work for what seemed like a very long time. He believed he had what it took to make a difference in the industry, but his career did not work out as planned. Even though he spent years at Apple and Yahoo, he got rejected many times by Twitter and Facebook.(3) Acton described the details of the interview process that he failed to do well in as follows:
First of all, interviewing a person for a job that requires technical skills is difficult for both the interviewer and the interviewee. Facebook is a highly desirable firm to work for and requires the best skills and talents from all of their potential employees. It is therefore not surprising that the selection process rivals, if not tops, any company in the industry. The process starts with an email or a phone call from a recruiter in response to an online application or [to] a recommendation from a friend who may work for Facebook. Sometimes, in the initial chat online, timed software coding challenges are set to find the best performers. If this chat goes well, an applicant will go on to the next level—an initial in-person interview or phone screening.(4)
In this next hurdle, the applicant will have a 45-minute chat with a fellow engineer/potential coworker, [with] whom he or she shares the same area of expertise. They will tell you about their job and what their role is in Facebook; then they ask about the applicant’s résumé, motivation, and interests. Additionally, the applicant will be tested about his or her technical skills, coding exercises, and programming abilities.(5)
If successful, the applicant will be invited for back-to-back interviews. This part of the process is very grueling and stressful since all the interviews take place throughout a single day. The candidate will also be asked to manually write a program on a whiteboard to make sure that the applicant is knowledgeable about program writing. The goal in this final step is to see how one approaches a problem and comes up with a solution [that] is simple enough to solve in 10–30 minutes and can be easily explained.(6)
As a potential coworker, the applicant will be te.
Case 6.4 The Case of the Poorly Performing SalespersonEd Markham.docxannandleola
Case 6.4 The Case of the Poorly Performing Salesperson
Ed Markham, the African American sales manager at WCTV, is considering how to handle a problem with one of his salespersons, Jane Folsom, who is White. Ed was promoted to sales manager three months ago after working at WCTV for 2 years. He earned his promotion by exceeding sales goals every month after his first on the job. He developed a research report using secondary data like MRI and the Lifestyle Market Analyst to analyze the market. His former boss praised the report, gave a copy to all salespersons, and included a summary of it in the rate card. When his former boss left for a new job in a larger market, he recommended Ed as his replacement.
Jane has been a salesperson at WCTV for 2 years. For most of that time, she has exceeded sales quotas about as much as Ed had. For the past 3 months, she has not met sales quotas. After his second month as sales manager, Ed talked to Jane about her performance. She attributed her below-average performance to the closing of a major advertiser, Anthony’s Fashions. This local clothing store closed because several major retailers, including JC Penney and Dillard’s, had opened at the local mall.
Ed listened to Jane’s explanation and then suggested ways to obtain new clients. He asked Jane whether she had set personal sales goals, set up a prospect file of new and inactive advertisers as well as existing businesses that were potential clients, come up with research and data on the market to use in presentations and reports to clients, come up with new ideas or opportunities to advertise for clients, or asked her clients about their needs and goals (Shaver, 1995). Jane said no, she simply telephoned or visited her clients regularly to see if they wanted to run ads.
Ed also asked Jane why several of her clients had not paid their bills. He explained that a salesperson must check out a client’s ability to pay before running a schedule. Jane replied that she was not aware of that fact and that no one had ever trained her to sell. She had sold time for a radio station before, but that was all the training she had. Ed’s predecessor had just hired her and cut her loose.
Ed gave Jane a memo after their first meeting a month ago asking her to focus on sales training for the next month. First, she should read Shaver’s (1995) Making the Sale! How to Sell Media With Marketing. He gave her a copy, told her to read it, and asked her to contact him if she had any questions. After reading the book, he told her that she should establish written personal sales goals, begin to develop a prospect file (with two new and two inactive clients), and develop three ideas for new advertising opportunities for existing clients. In the memo, Ed told Jane that he would not hold her to sales performance standards that month. He wanted Jane to focus on doing the background work he assigned to help her improve her future sales performance.
At the meeting a month later, Ed discovered.
Case 5.6Kelo v City of New London545 U.S. 469 (2005)Ye.docxannandleola
Case 5.6
Kelo v City of New London
545 U.S. 469 (2005)
Yes, Actually, They Can Take That Away From You
Facts
In 1978, the city of New London, Connecticut, undertook a redevelopment plan for purposes of creating a redeveloped area in and around the existing park at Fort Trumbull. The plan sought to develop the related ambience a state park should have, including the absence of pink cottages and other architecturally eclectic homes. Part of the redevelopment plan was the city’s deal with Pfizer Corporation for the location of its research facility in the area. The preface to the city’s development plan included the following statement of goals and purpose:
To create a development that would complement the facility that Pfizer was planning to build, create jobs, increase tax and other revenues, encourage public access to and use of the city’s waterfront, and eventually “build momentum” for the revitalization of the rest of the city, including its downtown area.
The affected property owners, including Susette Kelo, live in homes and cottages (15 total) located in and around other existing structures that would be permitted to stay in the area designated for the proposed new structures (under the city’s economic development plan) that would be placed there primarily by private land developers and corporations. The city was assisted by a private, nonprofit corporation, the New London Development Corporation (NLDC), in the development of the economic plan and piloting it through the various governmental processes, including that of city council approval. The central focus of the plan was getting Pfizer to the Fort Trumbull area (where the homeowners and their properties were located) with the hope of a resulting economic boost that such a major corporate employer can bring to an area.
Kelo and the other landowners whose homes would be razed to make room for Pfizer and the accompanying and resulting economic development plan filed suit challenging New London’s legal authority to take their homes. The trial court issued an injunction preventing New London from taking certain of the properties but allowing others to be taken. The appellate court found for New London on all the claims, and the landowners (petitioners) appealed.
Judicial Opinion
STEVENS, Justice Two polar propositions are perfectly clear. On the one hand, it has long been accepted that the sovereign may not take the property of A for the sole purpose of transferring it to another private party B, even though A is paid just compensation. On the other hand, it is equally clear that a State may transfer property from one private party to another if future “use by the public” is the purpose of the taking; the condemnation of land for a railroad with common-carrier duties is a familiar example. Neither of these propositions, however, determines the disposition of this case.
The disposition of this case therefore turns on the question whether the City’s development plan serves a “public purpos.
CASE 5.10 FIBREBOARD PAPER PRODUCTS CORP. V. NLRB SUPREME COURT OF.docxannandleola
CASE 5.10 FIBREBOARD PAPER PRODUCTS CORP. V. NLRB SUPREME COURT OF THE UNITED STATES, 379 U.S. 203 (1964).
[After receiving union proposals for contract revisions for the benefit of the maintenance workers at the company’s Emeryville, California, plant, the company advised the union that negotiations for a new contract would be pointless because it had definitely decided to contract out the work performed by the employees covered by the agreement upon the expiration of the agreement. The company planned to replace these employees with an independent contractor’s employees and expected that substantial savings would be effected by this contracting-out of the work. The Board ordered the company to reinstate the maintenance operation with the union employees, reinstate the employees with back pay, and fulfill its statutory bargaining obligation. The court of appeals granted the Board’s enforcement petition, and the Supreme Court agreed to hear the case.]
WARREN, C. J.... I. Section 8(a)(5) of the National Labor Relations Act provides that it shall be an unfair labor practice for an employer “to refuse to bargain collectively with the representatives of his employees.” Collective bar- gaining is defined in Section 8(d)
as the performance of the mutual obligation of the employer and the representative of the employees to meet at reasonable times and confer in good faith with respect to wages, hours, and other terms and conditions of employment.
“Read together, these provisions establish the obligation of the employer and the representative of its employees to bargain with each other in good faith with respect to ‘wages, hours, and other terms and conditions of employment....’ The duty is limited to those subjects, and within that area neither is legally obligated to yield. Labor Board v. American Ins. Co., 343 U.S. 395. As to other matters, however, each party is free to bargain or not to bargain....” Labor Board v. Wooster Div. of Borg-Warner Corp., 356 U.S. 342, 349. Because of the limited grant of certiorari, we are concerned here only with whether the subject upon which the employer allegedly refused to bargain— contracting out of plant maintenance work previously performed by employees in the bargaining unit, which the employees were capable of continuing to perform—is covered by the phrase “terms and conditions of employment” within the meaning of Section 8(d).
The subject matter of the present dispute is well within the literal meaning of the phrase “terms and conditions of employment.”
As the Court of Appeals pointed out, it is not necessary that it be likely or probable that the union will yield or supply a feasible solution but rather that the union be afforded an opportunity to meet management’s legitimate complaints that its maintenance was unduly costly.
We are thus not expanding the scope of mandatory bargaining to hold, as we do now, that the type of “contracting out” involved in this case—the replacement of employees in the exi.
Case 4 The McDonald’s China Food Supplier Scandal1. What we.docxannandleola
Case 4:
The McDonald’s China Food Supplier Scandal
1. What were the root causes for Husi’s misbehavior?
2. What are the major challenges faced by the multinationals such as McDonald’s in supply chain management in China?
3. Should McDonald’s be held responsible for the scandal? How could McDonald’s avoid similar situations from happening again?
4. Should OSI be held responsible for the scandal? What should OSI do to prevent similar situations from happening again?
.
More Related Content
Similar to Case 3Competition in the Craft Brewing Industry in 2017John D. Var.docx
Annual Report 2011Annual Report 2011W here innovationis .docxrossskuddershamus
Annual Report 2011Annual Report 2011
W here innovation
is always bre wing
THE BOSTON BEER COMPANY
41007_5c.indd 141007_5c.indd 1 3/28/12 3:53 PM3/28/12 3:53 PM
NUMBER OF DIFFERENT
RECIPES BREWED
100
NUMBER OF BEERS BREWED
AND RELEASED
54
NUMBER OF NEW BEERS
INTRODUCED (INCLUDING
LONGSHOT)
23
NUMBER OF AWARDS
AND MEDALS
287
2011
by the numbers
We served 54 of those Samuel Adams®
beer styles, however, to beer lovers. That’s
a record for us. We are especially proud
to report that 23 styles were new to our
line-up. Later in this report, we’ll talk
about the explosion of new breweries
across the country. It is an exciting time
to be in the craft beer business. As the
leader in the craft category, we think
Samuel Adams has continued to lead
in creativity and variety. Among those
54 beers, we have pushed boundaries
to create many exciting, innovative
beer styles sure to surprise and enchant
even the most adventurous craft beer
afi cionado.
If we wanted to characterize 2011 for you in a single word, that
word would be “innovation”. Never before has our industry
experienced such a pace of innovation. Drinkers demand it.
Despite our being the largest craft brewer (at 1% of total US
beer sales), we maintained our agility, and in 2011 that paid
off. All departments from brewing to operations to sales and
marketing, teamed up to maintain our leadership position.
Think about it; every beer we bring to market has to go
through its own regulatory approval process. It needs its own
unique packaging, and our sales force needs to introduce it to
wholesalers, retailers and drinkers. While 2011 was a year when
we had to balance speed and excellence, chaos
and effi ciency, and creativity and order, we are
proud of what we accomplished in 2011, and
we always look forward to this opportunity to
bring you up to date about what’s brewing.
A Look Back at 2011
For years we have joked about how in 1984
we were invisible, and how over the years we
grew from invisible, to insignifi cant, then
infi nitesimal and then tiny. We longed to be
small, and we’re proud to say, in 2011, we crossed
that threshold to small. The Boston Beer Company
now offi cially has just over 1% of the U.S. beer
market. We depleted more than two million
barrels of beer, 2.41 million to be precise. Given
that our original goal was to sell 5,000 barrels
a year of just one style of beer, Samuel Adams
Boston Lager®, and just within Massachusetts,
this is a pretty staggering accomplishment. Our
total Boston Beer Company depletions growth in
2011 was 7.2%.
The Boston Beer Company
now of fi cially has just over
1% of the U.S. beer market.
“One Hundred Bottles of Beer on
the Wall.” Who has not been part of a team returning from an outing and
heard that song sung ad infi nitum, right down to the last beer? For The Boston Beer Company
the “team” is our 840 employees, and in 2011 we really did brew one hundred distinct beers. .
Demographic Conditions prompt a Gloomy Canadian Beer Outlook: Ken ResearchKen Research Pvt ltd.
Canada Beer Market Insights 2016 Report provides a complete overview of the Canada beer industry structure offering a comprehensive insight into historical background trends, 2015 performance and 2016 outlook.
Running Head MKTG PLAN - THE BOSTON TEA .docxjeanettehully
Running Head: MKTG PLAN - THE BOSTON TEA 1
Running Head: MKTG PLAN - THE BOSTON TEA 20
Business Plan: The Boston Tea
Team A
Executive Summary
The Boston Beer Company’s products are one of the most recognized brands in the alcoholic beverage market, especially in the craft beer market. But the trends in the craft spirit market are changing and we are on the verge of a change similar to the one the market experienced in the craft beer market 7 -8 years ago and the Boston Beer Company with it unique expertise can make a difference and substantial profits, as it did with the Craft beer market.
What we have accomplished?
The Boston Beer Company’s goal is to becoming the leading supplier of Better Beer market and we have become the largest supplier of quality craft beer. We are proud to have introduced into the market world-class variety of traditional and innovative alcoholic beverages under brand names Samuel Adams, Angry Orchard and Twisted Tea. The company’s growth has been fueled by both alcoholic and non-alcoholic beverage, but more so by the hard ciders. But the trends in the spirits market are on the cusp of a new change. The spirits market is going through newer disruptive new innovations. The Boston Brewing Company, with its unique expertise, experience of reshaping craft beer market can be a disruptive force in the Craft Spirit market.
Therefore, we propose to introduce a new craft spirit, a moonshine, under the name “THE BOSTON TEA”.
Who are our customers
Traditionally spirits have been consumer mostly by men, especially older men. But recently consumer interest has risen in moonshines and craft spirits. The consumers mostly young men and women between the ages 25-44 are increasingly gravitating towards the high quality spirits with unique flavors rather than just plain spirits. The increase in the number of manufacturers of moonshines in the southern United States and their popularity among the consumers reflects this trend (The Boston Beer Company, Inc., 2017)
How big is the market
The Spirit market in United States is approximately $7.5 billion in 2017 and the craft spirit market accounts for only 0.5% of the sales. But we need to remember that the craft spirit market has very near market origin. The global Craft Spirit markets is expected to grow at a staggering rate from 2017 to 2025 to more than $80 billion dollar business and United States is projected to account for nearly 53% of that sales. The opportunity for a tremendous growth in this market is potentially huge.
What’s our strategy goal
Boston Beer Company has always had the goal of becoming the number one producer of the quality beer in the better beer category and we accomplished this by offering customers unique and quality beer. We will employ the same strategy employed for the craft beer market i.e, make early inroads into the craft ...
Similar to Case 3Competition in the Craft Brewing Industry in 2017John D. Var.docx (12)
CASE 6B – CHESTER & WAYNE Chester & Wayne is a regional .docxannandleola
CASE 6B – CHESTER & WAYNE
Chester & Wayne is a regional food distribution company. Mr. Chester, CEO, has asked your
assistance in preparing cash-flow information for the last three months of this year. Selected
accounts from an interim balance sheet dated September 30, have the following balances:
Cash $142,100 Accounts payable $354,155
Marketable securities 200,000 Other payables 53,200
Accounts receivable $1,012,500
Inventories 150,388
Mr. Wayne, CFO, provides you with the following information based on experience and
management policy. All sales are credit sales and are billed the last day of the month of sale.
Customers paying within 10 days of the billing date may take a 2 percent cash discount. Forty
percent of the sales is paid within the discount period in the month following billing. An
additional 25 percent pays in the same month but does not receive the cash discount. Thirty
percent is collected in the second month after billing; the remainder is uncollectible. Additional
cash of $24,000 is expected in October from renting unused warehouse space.
Sixty percent of all purchases, selling and administrative expenses, and advertising expenses is
paid in the month incurred. The remainder is paid in the following month. Ending inventory is
set at 25 percent of the next month's budgeted cost of goods sold. The company's gross profit
averages 30 percent of sales for the month. Selling and administrative expenses follow the
formula of 5 percent of the current month's sales plus $75,000, which includes depreciation of
$5,000. Advertising expenses are budgeted at 3 percent of sales.
Actual and budgeted sales information is as follows:
Actual: Budgeted:
August $750,000 October $826,800
September 787,500 November 868,200
December 911,600
January 930,000
The company will acquire equipment costing $250,000 cash in November. Dividends of $45,000
will be paid in December.
The company would like to maintain a minimum cash balance at the end of each month of
$120,000. Any excess amounts go first to repayment of short-term borrowings and then to
investment in marketable securities. When cash is needed to reach the minimum balance, the
company policy is to sell marketable securities before borrowing.
The company will acquire equipment costing $250,000 cash in November. Dividends of $45,000
will be paid in December.
The company would like to maintain a minimum cash balance at the end of each month of
$120,000. Any excess amounts go first to repayment of short-term borrowings and then to
investment in marketable securities. When cash is needed to reach the minimum balance, the
company policy is to sell marketable securities before borrowing.
Questions (use of spreadsheet software is recommended):
1. Prepare a cash budget for each month of the fourth quarter and for the quarter in total.
Prepare supporting schedules as needed. (Round all budge.
CASE 9 Bulimia Nervosa Table 9-1 Dx Checklist Bulimia Nervos.docxannandleola
"CASE 9 Bulimia Nervosa Table 9-1 Dx Checklist Bulimia Nervosa 1. Repeated binge-eating episodes. 2. Repeated performance of ill-advised compensatory behaviors (e.g., forced vomiting) to prevent weight gain. 3. Symptoms take place at least weekly for a period of 3 months. 4. Inappropriate influence of weight and shape on appraisal of oneself. (Based on APA, 2013.) Rita was a 26-year-old manager of a local Italian restaurant and lived in the same city as her parents. Her childhood was not a happy one. Her parents divorced when she was about 5 years of age. She and her three older brothers remained with their mother, who often seemed overwhelmed with her situation and unable to run the household effectively. Rita would often refer to her childhood as utterly chaotic, as if no one were in charge. Within a 12-month period, 1 percent to 1.5 percent of individuals will meet the diagnostic criteria for bulimia nervosa; at least 90 percent of cases occur in females (APA, 2013). She nevertheless muddled through. When her brothers were finally all off to college or beyond, Rita entered high school, and the household seemed more manageable. Ultimately, she developed a close relationship with her mother, indeed too close, Rita suspected. Her mother seemed like her closest friend, at times the entire focus of her social life. They were both women alone, so to speak, and relied heavily on one another for comfort and support, preventing Rita from developing serious friendships. The two often went shopping together. Rita would give her mother an update on the most recent fashion trends, and her mother would talk to Rita about “how important it is to look good and be put together in this day and age.” Rita didn’t mind the advice, but sometimes she did wonder if her mother kept saying that as a way of telling her that she didn’t think she looked good. Rita later attended a local public college, majoring in business. However, she quit after 3 years to take a job at the restaurant. She had begun working in the restaurant part-time while a sophomore and after 2 years was offered the position of daytime manager. It was a well-paying job, and since her interest was business anyway, Rita figured it made sense to seize an attractive business opportunity. Her mother was not very supportive of her decision to leave college, but Rita reassured her that she intended to go back and finish up after she had worked for a while and saved some money. Just before leaving college, Rita began a serious relationship with a man whom she met at school. Their interest in each other grew, and they eventually got engaged. Everything seemed to be going well when out of the blue, her fiancé’s mental state began to deteriorate. Ultimately he manifested a pattern of schizophrenia and had to be hospitalized. As his impairment extended from days to months and then to more than a year, Rita finally had to end the engagement; she had to pick up the pieces and go on without him. She felt .
Case 9 Bulimia Nervosa in Gorenstein and Comer (2014)Rita was a.docxannandleola
Case 9: Bulimia Nervosa in Gorenstein and Comer (2014)
Rita was a 26-year-old manager of a local Italian restaurant and lived in the same city as her parents. Her childhood was not a happy one. Her parents divorced when she was about 5 years of age. She and her three older brothers remained with their mother, who often seemed overwhelmed with her situation and unable to run the household effectively. Rita would often refer to her childhood as utterly chaotic, as if no one were in charge. Within a 12-month period, 1 percent to 1.5 percent of individuals will meet the diagnostic criteria for bulimia nervosa; at least 90 percent of cases occur in females (APA, 2013). She nevertheless muddled through. When her brothers were finally all off to college or beyond, Rita entered high school, and the household seemed more manageable. Ultimately, she developed a close relationship with her mother, indeed too close, Rita suspected. Her mother seemed like her closest friend, at times the entire focus of her social life. They were both women alone, so to speak, and relied heavily on one another for comfort and support, preventing Rita from developing serious friendships. The two often went shopping together. Rita would give her mother an update on the most recent fashion trends, and her mother would talk to Rita about “how important it is to look good and be put together in this day and age.” Rita didn’t mind the advice, but sometimes she did wonder if her mother kept saying that as a way of telling her that she didn’t think she looked good. Rita later attended a local public college, majoring in business. However, she quit after 3 years to take a job at the restaurant. She had begun working in the restaurant part-time while a sophomore and after 2 years was offered the position of daytime manager. It was a well-paying job, and since her interest was business anyway, Rita figured it made sense to seize an attractive business opportunity. Her mother was not very supportive of her decision to leave college, but Rita reassured her that she intended to go back and finish up after she had worked for a while and saved some money. Just before leaving college, Rita began a serious relationship with a man whom she met at school. Their interest in each other grew, and they eventually got engaged. Everything seemed to be going well when out of the blue, her fiancé’s mental state began to deteriorate. Ultimately he manifested a pattern of schizophrenia and had to be hospitalized. As his impairment extended from days to months and then to more than a year, Rita finally had to end the engagement; she had to pick up the pieces and go on without him. She felt as if he had died. A period of psychotherapy helped ease her grief and her adjustment following this tragedy, and eventually she was able to move on with her life and to resume dating again. However, serious relationships eluded her. Rita knew that she was a moody person—she judged people harshly and displayed irrita.
Case 8.1 Pros and Cons of Balkan Intervention59Must the a.docxannandleola
Case 8.1 Pros and Cons of Balkan Intervention59
“Must the agony of Bosnia-Herzegovina be regarded, with whatever regrets, as somebody else’s trouble?
We don’t think so, but the arguments on behalf of that view deserve an answer. Among them are the
following:
The Balkan conflict is a civil war and unlikely to spread beyond the borders of the former
Yugoslavia. Wrong. Belgrade has missiles trained on Vienna. Tito’s Yugoslavia claimed, by way of
Macedonia, that northern Greece as far south as Thessaloniki belonged under its sovereignty. Those
claims may return. ‘Civil’ war pitting non-Slavic Albanians against Serbs could spread to Albania,
Turkey, Bulgaria, and Greece.
The United States has no strategic interest in the Balkans. Wrong. No peace, no peace dividend.
Unless the West can impose the view that ethnic purity can no longer be the basis for national
sovereignty, then endless national wars will replace the Cold War. This threat has appeared in
genocidal form in Bosnia. If it cannot be contained here, it will erupt elsewhere, and the Clinton
administration’s domestic agenda will be an early casualty.
If the West intervenes on behalf of the Bosnians, the Russians will do so on behalf of the Serbs, and
the Cold War will be reborn. Wrong. The Russians have more to fear from ‘ethnic cleansing’ than
any people on Earth. Nothing would reassure them better than a new, post-Cold War Western
policy of massive, early response against the persecution of national minorities, including the
Russian minorities found in every post-Soviet republic. The Russian right may favor the Serbs, but
Russian self-interest lies elsewhere.
The Serbs also have their grievances. Wrong. They do, but their way of responding to these
grievances, according to the State Department’s annual human rights report, issued this past week,
‘dwarfs anything seen in Europe since Nazi times.’ Via the Genocide Convention, armed
intervention is legal as well as justified.
The UN peace plan is the only alternative. Wrong. Incredibly, the plan proposes the reorganization
of Bosnia-Herzegovina followed by a cease-fire. A better first step would be a UN declaration that
any nation or ethnic group proceeding to statehood on the principle of ethnic purity is an outlaw
state and will be treated as such. As now drafted, the UN peace plan, with a map of provinces that
not one party to the conflict accepts, is really a plan for continued ‘ethnic cleansing.’”
Case 8.2 Images, Arguments, and the Second Persian Gulf Crisis, 1990–
1991
The analysis of policy arguments can be employed to investigate the ways that policymakers represent or
structure problems (Chapter 3). We can thereby identify the images, or problem representations, that
shape processes of making and justifying decisions. For example, during times of crisis, the images which
United States policymakers have of another country affect deliberations about the use of peacekeeping
and negotiation, the imposition of economic sanctions, o.
Case 6-2 Not Getting Face Time at Facebook—and Getting the Last La.docxannandleola
Case 6-2 Not Getting Face Time at Facebook—and Getting the Last Laugh!
In August 2009, Facebook turned down job applicant Brian Acton, an experienced engineer who had previously worked at Yahoo and Apple. More than 4 years later, Facebook paid him $3 billion to acquire his 20% stake of WhatsApp, a start-up he had cofounded immediately after Facebook rejected his job application.(1) WhatsApp Messenger is a proprietary, cross-platform, instant-messaging subscription service for smartphones and selected feature phones that use the Internet for communication. In addition to text messaging, users can send each other images, video, and audio media messages, as well as their location using integrated mapping features.(2) How could Facebook, a highly successful firm, have made such a drastic mistake?
Back in 2009, Brian Acton was a software engineer who was out of work for what seemed like a very long time. He believed he had what it took to make a difference in the industry, but his career did not work out as planned. Even though he spent years at Apple and Yahoo, he got rejected many times by Twitter and Facebook.(3) Acton described the details of the interview process that he failed to do well in as follows:
First of all, interviewing a person for a job that requires technical skills is difficult for both the interviewer and the interviewee. Facebook is a highly desirable firm to work for and requires the best skills and talents from all of their potential employees. It is therefore not surprising that the selection process rivals, if not tops, any company in the industry. The process starts with an email or a phone call from a recruiter in response to an online application or [to] a recommendation from a friend who may work for Facebook. Sometimes, in the initial chat online, timed software coding challenges are set to find the best performers. If this chat goes well, an applicant will go on to the next level—an initial in-person interview or phone screening.(4)
In this next hurdle, the applicant will have a 45-minute chat with a fellow engineer/potential coworker, [with] whom he or she shares the same area of expertise. They will tell you about their job and what their role is in Facebook; then they ask about the applicant’s résumé, motivation, and interests. Additionally, the applicant will be tested about his or her technical skills, coding exercises, and programming abilities.(5)
If successful, the applicant will be invited for back-to-back interviews. This part of the process is very grueling and stressful since all the interviews take place throughout a single day. The candidate will also be asked to manually write a program on a whiteboard to make sure that the applicant is knowledgeable about program writing. The goal in this final step is to see how one approaches a problem and comes up with a solution [that] is simple enough to solve in 10–30 minutes and can be easily explained.(6)
As a potential coworker, the applicant will be te.
Case 6.4 The Case of the Poorly Performing SalespersonEd Markham.docxannandleola
Case 6.4 The Case of the Poorly Performing Salesperson
Ed Markham, the African American sales manager at WCTV, is considering how to handle a problem with one of his salespersons, Jane Folsom, who is White. Ed was promoted to sales manager three months ago after working at WCTV for 2 years. He earned his promotion by exceeding sales goals every month after his first on the job. He developed a research report using secondary data like MRI and the Lifestyle Market Analyst to analyze the market. His former boss praised the report, gave a copy to all salespersons, and included a summary of it in the rate card. When his former boss left for a new job in a larger market, he recommended Ed as his replacement.
Jane has been a salesperson at WCTV for 2 years. For most of that time, she has exceeded sales quotas about as much as Ed had. For the past 3 months, she has not met sales quotas. After his second month as sales manager, Ed talked to Jane about her performance. She attributed her below-average performance to the closing of a major advertiser, Anthony’s Fashions. This local clothing store closed because several major retailers, including JC Penney and Dillard’s, had opened at the local mall.
Ed listened to Jane’s explanation and then suggested ways to obtain new clients. He asked Jane whether she had set personal sales goals, set up a prospect file of new and inactive advertisers as well as existing businesses that were potential clients, come up with research and data on the market to use in presentations and reports to clients, come up with new ideas or opportunities to advertise for clients, or asked her clients about their needs and goals (Shaver, 1995). Jane said no, she simply telephoned or visited her clients regularly to see if they wanted to run ads.
Ed also asked Jane why several of her clients had not paid their bills. He explained that a salesperson must check out a client’s ability to pay before running a schedule. Jane replied that she was not aware of that fact and that no one had ever trained her to sell. She had sold time for a radio station before, but that was all the training she had. Ed’s predecessor had just hired her and cut her loose.
Ed gave Jane a memo after their first meeting a month ago asking her to focus on sales training for the next month. First, she should read Shaver’s (1995) Making the Sale! How to Sell Media With Marketing. He gave her a copy, told her to read it, and asked her to contact him if she had any questions. After reading the book, he told her that she should establish written personal sales goals, begin to develop a prospect file (with two new and two inactive clients), and develop three ideas for new advertising opportunities for existing clients. In the memo, Ed told Jane that he would not hold her to sales performance standards that month. He wanted Jane to focus on doing the background work he assigned to help her improve her future sales performance.
At the meeting a month later, Ed discovered.
Case 5.6Kelo v City of New London545 U.S. 469 (2005)Ye.docxannandleola
Case 5.6
Kelo v City of New London
545 U.S. 469 (2005)
Yes, Actually, They Can Take That Away From You
Facts
In 1978, the city of New London, Connecticut, undertook a redevelopment plan for purposes of creating a redeveloped area in and around the existing park at Fort Trumbull. The plan sought to develop the related ambience a state park should have, including the absence of pink cottages and other architecturally eclectic homes. Part of the redevelopment plan was the city’s deal with Pfizer Corporation for the location of its research facility in the area. The preface to the city’s development plan included the following statement of goals and purpose:
To create a development that would complement the facility that Pfizer was planning to build, create jobs, increase tax and other revenues, encourage public access to and use of the city’s waterfront, and eventually “build momentum” for the revitalization of the rest of the city, including its downtown area.
The affected property owners, including Susette Kelo, live in homes and cottages (15 total) located in and around other existing structures that would be permitted to stay in the area designated for the proposed new structures (under the city’s economic development plan) that would be placed there primarily by private land developers and corporations. The city was assisted by a private, nonprofit corporation, the New London Development Corporation (NLDC), in the development of the economic plan and piloting it through the various governmental processes, including that of city council approval. The central focus of the plan was getting Pfizer to the Fort Trumbull area (where the homeowners and their properties were located) with the hope of a resulting economic boost that such a major corporate employer can bring to an area.
Kelo and the other landowners whose homes would be razed to make room for Pfizer and the accompanying and resulting economic development plan filed suit challenging New London’s legal authority to take their homes. The trial court issued an injunction preventing New London from taking certain of the properties but allowing others to be taken. The appellate court found for New London on all the claims, and the landowners (petitioners) appealed.
Judicial Opinion
STEVENS, Justice Two polar propositions are perfectly clear. On the one hand, it has long been accepted that the sovereign may not take the property of A for the sole purpose of transferring it to another private party B, even though A is paid just compensation. On the other hand, it is equally clear that a State may transfer property from one private party to another if future “use by the public” is the purpose of the taking; the condemnation of land for a railroad with common-carrier duties is a familiar example. Neither of these propositions, however, determines the disposition of this case.
The disposition of this case therefore turns on the question whether the City’s development plan serves a “public purpos.
CASE 5.10 FIBREBOARD PAPER PRODUCTS CORP. V. NLRB SUPREME COURT OF.docxannandleola
CASE 5.10 FIBREBOARD PAPER PRODUCTS CORP. V. NLRB SUPREME COURT OF THE UNITED STATES, 379 U.S. 203 (1964).
[After receiving union proposals for contract revisions for the benefit of the maintenance workers at the company’s Emeryville, California, plant, the company advised the union that negotiations for a new contract would be pointless because it had definitely decided to contract out the work performed by the employees covered by the agreement upon the expiration of the agreement. The company planned to replace these employees with an independent contractor’s employees and expected that substantial savings would be effected by this contracting-out of the work. The Board ordered the company to reinstate the maintenance operation with the union employees, reinstate the employees with back pay, and fulfill its statutory bargaining obligation. The court of appeals granted the Board’s enforcement petition, and the Supreme Court agreed to hear the case.]
WARREN, C. J.... I. Section 8(a)(5) of the National Labor Relations Act provides that it shall be an unfair labor practice for an employer “to refuse to bargain collectively with the representatives of his employees.” Collective bar- gaining is defined in Section 8(d)
as the performance of the mutual obligation of the employer and the representative of the employees to meet at reasonable times and confer in good faith with respect to wages, hours, and other terms and conditions of employment.
“Read together, these provisions establish the obligation of the employer and the representative of its employees to bargain with each other in good faith with respect to ‘wages, hours, and other terms and conditions of employment....’ The duty is limited to those subjects, and within that area neither is legally obligated to yield. Labor Board v. American Ins. Co., 343 U.S. 395. As to other matters, however, each party is free to bargain or not to bargain....” Labor Board v. Wooster Div. of Borg-Warner Corp., 356 U.S. 342, 349. Because of the limited grant of certiorari, we are concerned here only with whether the subject upon which the employer allegedly refused to bargain— contracting out of plant maintenance work previously performed by employees in the bargaining unit, which the employees were capable of continuing to perform—is covered by the phrase “terms and conditions of employment” within the meaning of Section 8(d).
The subject matter of the present dispute is well within the literal meaning of the phrase “terms and conditions of employment.”
As the Court of Appeals pointed out, it is not necessary that it be likely or probable that the union will yield or supply a feasible solution but rather that the union be afforded an opportunity to meet management’s legitimate complaints that its maintenance was unduly costly.
We are thus not expanding the scope of mandatory bargaining to hold, as we do now, that the type of “contracting out” involved in this case—the replacement of employees in the exi.
Case 4 The McDonald’s China Food Supplier Scandal1. What we.docxannandleola
Case 4:
The McDonald’s China Food Supplier Scandal
1. What were the root causes for Husi’s misbehavior?
2. What are the major challenges faced by the multinationals such as McDonald’s in supply chain management in China?
3. Should McDonald’s be held responsible for the scandal? How could McDonald’s avoid similar situations from happening again?
4. Should OSI be held responsible for the scandal? What should OSI do to prevent similar situations from happening again?
.
Case 3 Neesha Wilson Phoenix Rising Risks, Protective Factors, and.docxannandleola
Case 3 Neesha Wilson Phoenix Rising Risks, Protective Factors, and Psychological Well-Being
Neesha Wilson, a 10-year-old African American girl, was referred for assessment to the school psychologist as a result of a child study team meeting held at the school in May. Presenting problems included poor school progress and escalating behavioral concerns. It was the school’s impression that Neesha might qualify for special education assistance as a child with an emotional disorder. Currently, Neesha has an older brother, Tyrone, who is attending an alternate school program for children and youth with severe emotional disturbance.
Developmental History/Family Background
The school social worker completed Neesha’s initial work-up just prior to the end of the academic term; intake information is summarized as follows:
Neesha lives with her 15-year-old brother, Tyrone, and her mother in a two-bedroom apartment. The social worker described the apartment as tiny but very well kept. Neesha has her own bedroom, and Tyrone sleeps on the couch, which folds out into a bed. The social worker noted that it was difficult to book an appointment with Mrs. Wilson, who was reportedly working two jobs: cleaning offices and working as a hairstylist. Mrs. Wilson graduated from hairstylist classes last year. Although her career as a hairstylist has a lot of potential, she is only beginning to develop clientele. She also works part time cleaning offices. Despite the lack of financial resources, the children were clean, well dressed, and did not miss any meals. The children were on the free-lunch program at the schools. According to Mrs. Wilson, Neesha’s early history was unremarkable and motor and language milestones developed on schedule.
An immediate concern of the social worker’s centered on who cared for the children when their mother, Tanya, had to work evenings cleaning offices. Tanya stated that it was not a problem for her because she would either send the children to her sister’s apartment a few blocks away, or have a cousin who lived in the building check in on the kids. Also, Tyrone was 15, so he was capable of watching his sister, although she preferred to have an adult nearby, given Tyrone’s behavior problems.
Neesha’s mother described her as an easy baby and said that she never really had any problems with her. She added that it was Tyrone who was giving her all the problems, not Neesha. The family had struggled since her husband, Walt, left the family about 3 years ago, when Neesha was in Grade 1. In the past two years, Walt has had virtually no contact with the children. He moved in with his girlfriend and their one-year-old baby and recently moved to another state. Neesha was very upset with the marriage breakdown and misses her father very much. Neesha visited with her dad and his new family, initially, but was very disappointed that the visits were neither consistent nor more frequent. Neesha did not like Walt’s girlfriend and felt that her father wa.
Case 48 Sun Microsystems Done by Nour Abdulaziz Maryam .docxannandleola
Case 48: Sun Microsystems
Done by: Nour Abdulaziz
Maryam Barifah
Shrouq Al-Jaadi
Balqees Mekhalfi
Yara El-Feki
Introduction
•In 2009, Oracle was planning to acquire Sun Microsystems.
•This acquisition would allow Oracle;
•to further diversify their brand, customers and acquire various new platforms that would be added to their portfolio such as MySQL, Solaris and Java.
•Oracle originally placed an offer of $9.50 per share price which is considerably higher than Sun Microsystem’s price that is $6.69.
•This will cut the production costs and make the company more efficient throughout all the value chain.
•Oracle aimed to capitalize on Sun Microsystem’s decline by getting particular assets or the whole company at the deflated price.
Is Sun Microsystems a good strategic fit for Oracle? Should Oracle acquire Sun Microsystems?
- as it will allow them to achieve their vision of becoming the Apple of the software industry.
- it will allow the company to deliver high-quality customer products by combining both hardware and software components, hence reducing the consumer setup process.
Continue
It will provide Oracle with the needed expansion.
-This acquisition fits Oracle’s overall strategy which is to improve through acquiring and effectively integrating other companies
Worth of Sun Microsystems and Valuation Approaches
To know how much Sun Microsystems worth, we must find the Stand Alone Value of the company.
The Stand Alone value represents the present value of Sun Microsystem individually before factoring the synergy that would be created when Oracle acquires Sun.
Another method is the value of Sun Microsystem with synergies, which after being acquired by Oracle, must be found. This is done to see whether or not the acquisition was a proper strategic decision or not
Another method of valuing the Sun Microsystem is through the comparative company analysis (CCA). That is done through the thorough assessment of rival and peer businesses of similar size and industry.
Finally, the acquisition price, which is the price that is paid to the target when it is first acquired, is also used as a separate method of valuation. The value of the acquisition price ranges between the values of the stand-alone and the synergies.
USING THE DCF
To be able to find the values of both, the Stand Alone and the synergies, we have decided the best way to do so is by calculating the discounted cash flow (DCF) by using the multiples and the perpetuity growth methods and finding the average of both.
DCF Using Multiples MethodDCF Using Perpetuity Growth MethodIt does not consider long-term growth rate or the economics of business.This method seems inaccurate as the company assumes a certain growth rate will remains the same 2014 onwards (forever) which is unrealistic.It is considered a challenging method to use as it is very difficult to identify truly comparable companies.
USING THE WACC
The weig.
CASE 42 Myasthenia Gravis The immune response turns agai.docxannandleola
CASE 42 Myasthenia Gravis
The immune response turns against the host.
The specific adaptive immune response can, in rare instances, be mounted
against self antigens and cause autoimmune disease. Injury to body tissues
can result from antibodies directed against cell-surface or extracellular-matrix
molecules, from antibodies bound to circulating molecules that deposit as
immune complexes, or from clones of T cells that react with self antigens. A
special class of autoimmune disease is caused by autoantibodies against cell
surface receptors (Fig. 42.1). Graves' disease and myasthenia gravis are two
well-studied examples . Graves' disease is caused by autoantibodies against
the receptor on thyroid cells for thyroid-stimulating hormone (TSH), secreted
by the pituitary gland. In this disease, autoantibody binds to the TSH recep
tor; like TSH, it stimulates the thyroid gland to produce thyroid hormones.
In myasthenia gravis, the opposite effect is observed: antibodies against the
acetylcholine receptor at the neuromuscular junction impede the binding of
acetylcholine and stimulate internalization of the receptor, thereby block
ing the t ransmission of nerve impulses by acetylcholine (Fig. 42.2). In addi
tion, the presence of autoantibodies at the neuromuscular junction initiates
complement-mediated lysis ofthe muscle endplate and damages the muscle
membrane.
Myasthenia gravis means severe (gravis) muscle (my) weakness (asthenia).
This disease was first identified as an autoimmune disease when an immun
ologist immunized rabbits with purified acetylcholine receptors to obtain
antibodies against this receptor. He noticed that the rabbits developed floppy
ears, like the droopy eyelids (ptosis) that are the most characteristic symptom
of myasthenia gravis in humans. Subsequently, patients with this disease
were found to have antibodies against the acetycholine receptor. In addition,
pregnant women with myasthenia gravis transfer the disease to their newborn
infants. As IgG is the only maternal serum protein that crosses the placenta
fro m mother to fetus, neonatal myasthenia gravis is clear evidence that
myasthenia gravis is caused by an anti-IgG antibody. More recently, patients
with myasthenia gravis have been identified who have autoantibodies against
muscle-specific kinase (MUSK) rather than the acetylcholine receptor.
MUSK is a tyrosine kinase receptor involved in clustering acetylcholine
receptors; therefore, these autoantibodies also inhibit signaling through the
neuromuscular junction.
Topics bearing on
this case:
Humoral autoimmunity
Transfer of maternal
antibodies
Mechanisms for
breaking tolerance
This case was prepared by RaifGeha , MD, in collaboration with Janet Chou, MD.
~ Case 42: Myasthenia Gravis
Fig. 42.1 Autoimmune diseases caused
by antibody against surface or matrix
antigens. These are known as type II
autoimmune diseases. Damage by
IgE-mediated responses (type I) does no.
Case 4 JetBlue Delighting Customers Through Happy JettingIn the.docxannandleola
Case 4 JetBlue: Delighting Customers Through Happy Jetting
In the early years, JetBlue was a thriving young airline with a strong reputation for outstanding service. In fact, the low-fare airline referred to itself as a customer service company that just happened to fly planes. But on a Valentine’s Day, JetBlue was hit by the perfect storm, literally, of events that led to an operational meltdown. One of the most severe storms of the decade covered JetBlue’s main hub at New York’s John F. Kennedy International Airport with a thick layer of snow and ice. JetBlue did not have the infrastructure to deal with such a crisis. The severity of the storm, coupled with a series of poor management decisions, left JetBlue passengers stranded in planes on the runway for up to 11 hours. Worse still, the ripple effect of the storm created major JetBlue flight disruptions for six more days. Understandably, customers were livid. JetBlue’s efforts to clean up the mess following the six-day Valentine’s Day nightmare cost over $30 million in overtime, flight refunds, vouchers for future travel, and other expenses. But the blow to the company’s previously stellar customer-service reputation stung far more than the financial fallout. JetBlue became the butt of jokes by late night talk show hosts. Some industry observers even predicted that this would be the end
of JetBlue. But just three years later, the company is not only still flying, it is growing, profitable, and hotter than ever. During a serious economic downturn competing airlines were cut routes, retiring aircraft, laying off employees, and lost money. JetBlue added planes, expanded into new cities, hired thousands of new employees, and turning profits.
Truly Customer Focused What’s the secret to JetBlue’s success? Quite simply, it’s an obsession with making sure that every customer experience lives up to the company slogan, “Happy Jetting.” Lots of companies say they focus on customers. But at JetBlue, customer well-being is ingrained in the culture. From the beginning, JetBlue set out to provide features that would delight customers. For example, most air travelers expect to be squashed when flying coach. But JetBlue has configured its seats with three more inches of legroom than the average airline seat. That may not sound like much. But those three inches allow six-foot three-inch Arianne Cohen, author of The Tall Book: A Celebration of Life from on High, to stretch out and even cross her legs. If that’s not enough, for as little as $10 per flight, travelers can reserve one of JetBlue’s “Even More Legroom” seats, which offer even more space and a flatter recline position. Add the fact that every JetBlue seat is well padded and covered in leather, and you already have an air travel experience that rivals first-class accommodations (something JetBlue doesn’t offer). Food and beverage is another perk that JetBlue customers enjoy. The airline doesn’t serve meals, but it offers the best selection of free.
Case 4-2 Hardee TransportationThe Assignment Answer the four .docxannandleola
Case 4-2 Hardee Transportation
The Assignment: Answer the four (4) questions at the end of Case 4-2
Resources: Course Textbook, Appendix 4B, Table 4B-1, Attached worksheet (Word or Excel format)
Acceptable Length:
Show your work for solution to questions 1 and 2
. Well-written responses to question 3 and 4.
Formatting Requirements:
Enter your name and date
Provide well-structured solutions/answers- incomplete answers will receive partial credit
Show your work
2. Answer case questions,
using the attached word template or excel document
. Complete assignment and submit as an attachment using the assignment link when finished.
.
Case 3-8 Accountant takes on Halliburton and Wins!1. Descri.docxannandleola
Case 3-8 Accountant takes on Halliburton and Wins!
1. Describe the inadequacies in the corporate governance system at Halliburton.
2. Consider the role of KPMG in the case with respect to the accounting and auditing issues. How did the firms’ actions relate to the ethical and professional expectations for CPAs by the accounting profession?
3. The Halliburton case took place before the Dodd-Frank Financial Reform Act was adopted by Congress. Assume Dodd-Frank had been in effect and Menendez decided to inform the SEC under Dodd-Frank rather than SOX because it had been more than 180 days since the accounting violation had occurred. Given the facts of the case would Menendez have qualified for whistleblower protection? Explain.
4. Some critics claim that while Menendez’s actions may have been courageous, he harmed others along the way. His family was in limbo for many years and had to deal with the agony of being labeled a whistleblower and disloyal to Halliburton. The company’s overall revenue did not change; a small amount was merely shifted to an earlier period. Halliburton didn't steal any money, they didn't cheat the IRS, they didn't cheat their customers or their employees. In fact, they lessened their cash flows by paying out taxes earlier than they should have under the rules. How do you respond to these criticisms?
.
Case 3 Ford’s Pinto Fires The Retrospective View of Ford’s Fiel.docxannandleola
Case 3
Ford’s Pinto Fires: The Retrospective View of Ford’s Field Recall Coordinator
Brief Overview of the Ford Pinto Fires
Determined to compete with fuel- efficient Volkswagen and Japanese imports, the Ford Motor Company introduced the subcompact Pinto in the 1971 model year. Lee Iacocca, Ford’s president at the time, insisted that the Pinto weigh no more than 2,000 pounds and cost no more than $2,000. Even with these restrictions, the Pinto met federal safety standards, although some people have argued that strict adherence to the restrictions led Ford engineers to compromise safety. Some 2 million units were sold during the 10- year life of the Pinto.
The Pinto’s major design flaw— a fuel tank prone to rupturing with moderate speed rear- end collisions— surfaced not too long after the Pinto’s entrance to the market. In April 1974, the Center for Auto Safety petitioned the National Highway Traffic Safety Administration (NHTSA) to recall Ford Pintos due to the fuel tank design defect. The Center for Auto Safety’s petition was based on reports from attorneys of three deaths and four serious injuries in moderate- speed rear- end collisions involving Pintos. The NHTSA did not act on this petition until 1977. As a result of tests performed for the NHTSA, as well as the extraordinary amount of publicity generated by the problem, Ford agreed, on June 9, 1978, to recall 1.5 million 1971– 1976 Ford Pintos and 30,000 1975– 1976 Mercury Bobcat sedan and hatchback models for modifications to the fuel tank. Recall notices were mailed to the affected Pinto and Bobcat owners in September 1978. Repair parts were to be delivered to all dealers by September 15, 1978.
Unfortunately, the recall was initiated too late for six people. Between June 9 and September 15, 1978, six people died in Pinto fires after a rear impact. Three of these people were teenage girls killed in Indiana in August 1978 when their 1973 Pinto burst into flames after being rear- ended by a van. The fiery deaths of the Indiana teenagers led to criminal prosecution of the Ford Motor Company on charges of reckless homicide, marking the first time that an American corporation
was prosecuted on criminal charges. In the trial, which commenced on January 15, 1980, “Indiana state prosecutors alleged that Ford knew Pinto gasoline tanks were prone to catch fire during rear- end collisions but failed to warn the public or fix the problem out of concern for profits.” On March 13, 1980, a jury found Ford innocent of the charges. Production of the Pinto was discontinued in the fall of 1980.
Enter Ford’s Field Recall Coordinator
Dennis A. Gioia, currently a professor in the Department of Management and Organization at Pennsylvania State University, was the field recall coordinator at Ford Motor Company as the Pinto fuel tank defect began unfolding. Gioia’s responsibilities included the operational coordination of all the current recall
92 Business Ethics
campaigns, tracking incoming information.
CASE 3.2 Ethics, Schmethics-Enrons Code of EthicsIn Jul.docxannandleola
CASE 3.2 "Ethics, Schmethics"-Enron's Code of Ethics
In July 2000, Enron Corporation published an internal code of ethics docu-
ment that ran 64 pages in length (see the Appendix 1).Page 12 of the document
proudly announced the company's position on business ethics:
Employees of Enron Corp., its subsidiaries, and its affiliated companies
(collectively the "Company") are charged with conducting their business
affairs in accordance with the highest ethical standards. An employee
shall not conduct himself or herself in a manner which directly or indi-
rectly would be detrimental to the best interests of the Company or in
a manner which would bring to the employee financial gain separately
derived as a direct consequence of his or her employment with the Com-
pany. Moral as well as legal obligations will be fulfilled openly, promptly,
and in a manner which will reflect pride on the Company's name.
Products and services of the Company will be of the highest quality and
as represented. Advertising and promotion will be truthful, not exagger-
ated or misleading.
Agreements, whether contractual or verbal, will be honored. No bribes,
bonuses, kickbacks, lavish entertainment, or gifts will be given or received
. in exchange for special position, price or privilege . . . Relations with
the Company's many publics-customers, stockholders, governments,
employees, suppliers, press, and bankers-will be conducted in honesty,
candor, and fairness." .- ~ ~ ~ -
Subsequent investigations into the inner workings of Enron Corp. revealed that
the only time this code of ethics received formal attention (other than, presum-
ably,when it was created and formally accepted) was when the board of directors
voted to waive key provisions of the code in order to allow the off-balance-sheet
partnerships that Chief Financial Officer Andy Fastow ultimately used to hide
over half a billion dollars of debt from analysts and investors.
A more realistic picture of the apparent flexibility of Enron's ethical culture
can be found in the extreme conflict of interest represented in its relationship
with Arthur Andersen. Andersen provided both consulting and auditing ser-
vices for fees running into millions of dollars-money that became so critical to
Andersen's continued growth that its employees were encouraged to sign off on
off-balance-sheet transactions-transactions that were not shown on Enron's
publicly-reported balance sheet-that stretched the limits of generally accepted
accounting principles (GAAP) to their furthest edges. In addition, Enron hired
former Andersen employees to manage the affairs of their former colleagues,
which further strengthened the conflict of interest in a relationship that was
supposed, at the very least, to be at arm's length, and, at best, above reproach.
1. What is the purpose of a code of ethics?
2. Do you think the employees of Enron Corp. were told about the vote to put
aside key elements of the code of ethics? If not, why not? If they had .
CASE 3-1 International Marketing Research at the Mayo Clinic.docxannandleola
CASE 3-1 International Marketing Research at
the Mayo Clinic
In recent years, however, it has begun to study the international
patient population in particular and the international marketplace
in general. These studies fall into a few categories and grow in
number in proportion to the organization’s understanding (or per-
haps greater understanding of how much it does not know) of the
international marketplace.
First, the Mayo Clinic tracks international patient trends rather
carefully, which seems like an obvious place to start. But as in
most data tracking, the value of the concept is significantly more
straightforward than the logistics of acquiring consistently reliable
data. Internal data systems must be coordinated—a significant un-
dertaking for any institution, and particularly hard when dealing
with a large and complicated infrastructure. To give a simple ex-
ample, data fields must be made uniform—not just on one data
system, but on all of them. Rather than a free-text field, for ex-
ample, that allows a registrant to enter Venzuela, or Venosuela, or
Vensuala, or maybe even Venezuela, the Mayo Clinic pushes for a
predefined field that provides standardized information.
The Clinic monitors international data by the quarter, care-
fully watching trends over time by country or region, tracking sig-
nificant changes in volume, hospitalization rates, and percentage
of new patients out of any given market. For example, it knows
it has between 9,000 and 10,000 patients, depending on the year,
from more than 160 different countries annually. Some are third-
generation patients—maybe their grandfather was cured there in
the 1930s—and others are brand new. Some are neighbors from
Ontario or Monterrey; others come all the way from Indonesia.
Some markets are significantly less predictable than others, and
some countries deliver more “new” patients than others. The Mayo
Clinic probes further to figure out why.
Second, it conducts research with internal salespeople—the
physicians and their support staff who deliver care to international
patients. Through carefully moderated focus groups, the Clinic
identifies the things that are going smoothly, as well as the barri-
ers to providing excellent care. And where appropriate, it makes
recommendations for change.
Third, just as with U.S.-based patients, the healthcare in-
stitute conducts both quantitative and qualitative research in
the international marketplace, including research with patients,
international physicians, and international healthcare consum-
ers, designed to help it understand why people choose to leave
their own communities for healthcare, why some of them come
to Mayo Clinic, and why others do not. It works hard to un-
derstand how healthcare decisions are made so it can better
assist decision makers, physicians, and their staff in providing
care. The Clinic positions itself to offer counsel on where to
best expend valuable institutio.
The Art Pastor's Guide to Sabbath | Steve ThomasonSteve Thomason
What is the purpose of the Sabbath Law in the Torah. It is interesting to compare how the context of the law shifts from Exodus to Deuteronomy. Who gets to rest, and why?
Welcome to TechSoup New Member Orientation and Q&A (May 2024).pdfTechSoup
In this webinar you will learn how your organization can access TechSoup's wide variety of product discount and donation programs. From hardware to software, we'll give you a tour of the tools available to help your nonprofit with productivity, collaboration, financial management, donor tracking, security, and more.
2024.06.01 Introducing a competency framework for languag learning materials ...Sandy Millin
http://sandymillin.wordpress.com/iateflwebinar2024
Published classroom materials form the basis of syllabuses, drive teacher professional development, and have a potentially huge influence on learners, teachers and education systems. All teachers also create their own materials, whether a few sentences on a blackboard, a highly-structured fully-realised online course, or anything in between. Despite this, the knowledge and skills needed to create effective language learning materials are rarely part of teacher training, and are mostly learnt by trial and error.
Knowledge and skills frameworks, generally called competency frameworks, for ELT teachers, trainers and managers have existed for a few years now. However, until I created one for my MA dissertation, there wasn’t one drawing together what we need to know and do to be able to effectively produce language learning materials.
This webinar will introduce you to my framework, highlighting the key competencies I identified from my research. It will also show how anybody involved in language teaching (any language, not just English!), teacher training, managing schools or developing language learning materials can benefit from using the framework.
How to Split Bills in the Odoo 17 POS ModuleCeline George
Bills have a main role in point of sale procedure. It will help to track sales, handling payments and giving receipts to customers. Bill splitting also has an important role in POS. For example, If some friends come together for dinner and if they want to divide the bill then it is possible by POS bill splitting. This slide will show how to split bills in odoo 17 POS.
How to Create Map Views in the Odoo 17 ERPCeline George
The map views are useful for providing a geographical representation of data. They allow users to visualize and analyze the data in a more intuitive manner.
The Indian economy is classified into different sectors to simplify the analysis and understanding of economic activities. For Class 10, it's essential to grasp the sectors of the Indian economy, understand their characteristics, and recognize their importance. This guide will provide detailed notes on the Sectors of the Indian Economy Class 10, using specific long-tail keywords to enhance comprehension.
For more information, visit-www.vavaclasses.com
Operation “Blue Star” is the only event in the history of Independent India where the state went into war with its own people. Even after about 40 years it is not clear if it was culmination of states anger over people of the region, a political game of power or start of dictatorial chapter in the democratic setup.
The people of Punjab felt alienated from main stream due to denial of their just demands during a long democratic struggle since independence. As it happen all over the word, it led to militant struggle with great loss of lives of military, police and civilian personnel. Killing of Indira Gandhi and massacre of innocent Sikhs in Delhi and other India cities was also associated with this movement.
Basic phrases for greeting and assisting costumers
Case 3Competition in the Craft Brewing Industry in 2017John D. Var.docx
1. Case 3Competition in the Craft Brewing Industry in 2017
John D. Varlaro
Johnson & Wales University
John E. Gamble
Texas A&M University–Corpus Christi
Locally produced or regional craft beers caused a seismic shift
in the U.S. beer industry during the early 2010s with the gains
of the small, regional newcomers coming at the expense of such
well-known brands as Budweiser, Miller, Coors, and Bud Light.
Craft breweries, which by definition sold fewer than 6 million
barrels (bbls) per year, expanded rapidly with the deregulation
of intrastate alcohol distribution and retail laws and a change in
consumer preferences toward unique and high-quality beers.
The growing popularity of craft beers allowed the total beer
industry in the United States to increase by 6.7 percent annually
between 2011 and 2016 to reach $39.5 billion. The production
of U.S. craft breweries more than doubled from 11.5 million
bbls per year to about 24.6 million bbls per year during that
time. In addition, production by microbreweries and brewpubs
accounted for 90 percent of craft brewer growth in 2016.1
The industry had begun to show signs of a slowdown going into
2017, with Boston Beer Company, the second largest craft
brewery in the United States and known for its Samuel Adams
brand, experiencing a 4 percent sales decline in 2016 that erased
two years of of growth. The annual revenues of Anheuser-Busch
InBev SA, whose portfolio included global brands Budweiser,
Corona, and Stella Artois and numerous international and local
brands, remained relatively consistent from 2014 to 2016.
However, the sales volume of Anheuser-Busch’s flagship brands
and its newly acquired and international brands such as Corona,
Goose Island, Shock Top, Beck’s, and St. Pauli Girl allowed it
to control 45.8 percent of the U.S. market for beer in 2016.2
Industry competition was increasing as grain price fluctuations
affected cost structures and growing consolidation within the
2. beer industry—led most notably by AB InBev’s acquisition of
several craft breweries, Grupo Modelo, and its pending $104
billion acquisition of SABMiller—created a battle for market
share. While the market for specialty beer was expected to
gradually plateau by 2020, it appeared that the slowing growth
had arrived by 2017. Nevertheless, craft breweries and
microbreweries were expected to expand in number and in terms
of market share as consumers sought out new pale ales, stouts,
wheat beers, pilsners, and lagers with regional or local
flairs.The Beer Market
The total economic impact of the beer market was estimated to
be 2.0 percent of the total U.S. GDP in 2016 when variables
such as jobs within beer production, sales, and distribution were
included.3Exhibit 1 presents annual beer production statistics
for the United States between 2006 and 2016.
Year
Barrels Produced (in millions)*
2006
198
2007
200
2008
200
2009
197
2010
195
2011
193
2012
196
2013
192
2014
193
2015
3. 191
2016
189
*Rounded to the nearest million. Source: Alcohol and Tobacco
Tax and Trade Bureau website.
EXHIBIT 1
Barrels of Beer Produced in the United States, 2006–2016 (in
millions)
Although U.S. production had declined since 2008, consumption
was increasing elsewhere in the world, resulting in a forecasted
global market of almost $700 billion in sales by 2020.4 Global
growth seemed to be fueled by the introduction of Page
262differing styles of beer to regions where consumers had not
previously had access and the expansion of demographics not
normally known for consuming beer. Thus, exported beer to
both developed and developing regions helped drive future
growth. As an example, China recently saw a number of
domestic craft breweries producing beer as well as
experimenting with locally and regionally known flavors,
enticing the domestic palette with flavors such as green tea.
The Brewers Association, a trade association for brewers,
suppliers, and others within the industry, designated a brewery
as a craft brewer when output was less than 6 million barrels
annually and the ownership was more than 75 percent
independent of another non–craft beer producer or entity. The
rapid increase in popularity for local beers allowed the number
of U.S. brewers to reach almost 5,500 in 2016—nearly double
the number in 2012. Of these breweries, 99 percent were
identified as craft breweries with distribution ranging from
local to national. While large global breweries occupied the top
four positions among the largest U.S. breweries, five craft
breweries were ranked among the top 10 largest U.S. brewers in
2015—see Exhibit 2. Exhibit 3 shows the production volume of
the 10 largest beer producers worldwide for 2014 and 2015. The
number of craft breweries in each U.S. state are presented
in Exhibit 4.
4. Rank
Brewery
1
Anheuser-Busch, Inc.
2
MillerCoors
3
Pabst Brewing Co.
4
D.G. Yuengling and Son, Inc.
5
Boston Beer Co.
6
North American Breweries
7
Sierra Nevada Brewing Co.
8
New Belgium Brewing Co.
9
Craft Brewing Alliance
10
Lagunitas Brewing Co.
Source: Brewers Association.
EXHIBIT 2
Top 10 U.S. Breweries in 2015
Rank
Producer
Volume (millions of barrels)*
2014
Volume (millions of barrels)*2015
1
AB InBev
351
353
2
SABMiller
6. Document, 2015 and 2016
EXHIBIT 3
Top 10 Global Beer Producers by Volume, 2014–2015
Page 263
State
Brewers
State
Brewers
Alabama
24
Montana
49
Alaska
27
Nebraska
33
Arizona
78
Nevada
34
Arkansas
26
New Hampshire
44
California
518
New Jersey
51
Colorado
284
New Mexico
45
Connecticut
35
New York
9. 23
Source: Brewers Association.
EXHIBIT 4
Number of Craft Brewers by State, 2015The Beer Production
Process
The beer production process involves the fermentation of
grains. The cereal grain barley is the most common grain used
in the production of beer. Before fermentation, however, barley
must be malted and milled. Malting allows the barley to
germinate and produce the sugars that would be fermented by
the yeast, yielding the sweetness of beer. By soaking the barley
in water, the barley germinates, or grows, as it would when
planted in the ground. This process is halted through the
introduction of hot air and drying after germination began.
After malting, the barley is milled to break open the husk while
also cracking the inner seed that has begun to germinate. Once
milled, the barley is mashed, or added to hot water. The
addition of the hot water produces sugar from the grain. This
mixture is then filtered, resulting in the wort. The wort is then
boiled, which sterilizes the beer. It is at this stage that hops are
added. The taste and aroma of beer depend on the variety of
hops and when the hops were added.
After boiling, the wort is cooled and then poured into the
fermentor where yeast is added. The sugar created in the
previous stages is broken down by the yeast through
fermentation. The different styles of beer depend on the type of
yeast used, typically either an ale or lager yeast. The time for
this process could take a couple of weeks to a couple of months.
After fermentation, the yeast is removed. The process is
completed after carbon dioxide is added and the product is
packaged.
Beer is a varied and differentiated product, with over 70 styles
in 15 categories. Each style is dependent on a number of
variables. These variables are controlled by the brewer through
the process, and could include the origin of raw materials,
approach to fermentation, and yeast used. For example,
10. Guinness referenced on its website how barley purchased by the
brewer was not only grown locally, but was also toasted
specifically after malting, lending to its characteristic taste and
color. As another example of differentiation through raw
materials, wheat beers, such as German-style hefeweizen, are
brewed with a minimum of 50 percent wheat instead of barley
grain.
Development of Microbreweries and Economies of Scale
Although learning the art of brewing takes time, beer
production lends itself to scalability and variety. For example,
an amateur—or home brewer—could brew beer for home
consumption. There had been a significant increase in the
interest in home brewing, with over 1 million people pursuing
the hobby in 2016.5 It was also not uncommon for a home
brewer to venture into entrepreneurship and begin brewing for
commercial sales. However, beer production was highly labor
intensive with much of the work done by hand. A certain level
of production volume was necessary to achieve breakeven and
make the microbrewery a successful commercial operation.Page
264
A small nanobrewery may brew a variety of flavor experiences
and compete in niche markets, while the macrobrewery may
focus on economies of scale and mass produce one style of beer.
Both may attract consumers across segments, and were
attributed to the easily scalable yet highly variable process of
brewing beer. In contrast, a global producer such as AB InBev
could produce beer for millions of consumers worldwide with
factory-automated processes.
Legal Environment of Breweries
As beer was an alcoholic beverage, the industry was subject to
much regulation. Further, these regulations could vary by state
and municipality. One such regulation was regarding sales and
distribution.
Distribution could be distinguished through direct sales (or self-
11. distribution), and two-tier and three-tier systems. Regulations
permitting direct sales allow the brewery to sell directly to the
consumer. Growlers, bottle sales, as well as taprooms were all
forms of direct, or retail, sales. There were usually requirements
concerning direct sales, including limitations on volume sold to
the consumer.
Even where self-distribution was legal, the legal volumes could
be very small and limited. Very few brewers were exempt from
distributing through wholesalers, referred to as a three-tier
distribution system. And often to be operationally viable,
brewers need access to this distribution system to generate
revenue. In a three-tier system, the brewery must first sell to a
wholesaler—the liquor or beer distributor. This distributor then
sells to the retailer, who then ultimately sells to the consumer.
This distribution structure, however, had ramifications for the
consumer, as much of what was available at retail outlets and
restaurants was impacted by the distributor. This was further
impacted by whether a brewery bottles or cans its beer, or
distributes through kegs. While restaurants and bars could carry
kegs, retail shelves at a local liquor store needed to have cans
and bottles, as a relatively small number of consumers could
accommodate kegs for home use. Thus, there may only be a few
liquor stores or restaurants where a consumer may find a locally
brewed beer. In states that do not allow self-distribution or on-
premise sales, distribution and exposure to consumers could
represent a barrier for breweries, especially those that were
small or new.
The Alcohol and Tobacco Tax and Trade Bureau (TTB) was the
main federal agency for regulating this industry. As another
example of regulations, breweries were required to have labels
for beers approved by the federal government, ensuring they
meet advertising guidelines. In some instances, the TTB may
need to approve the formula used for brewing the specific beer
prior to the label receiving approval. Given the approval
process, and the growth of craft breweries, the length of time
this takes could reach several months. For a small microbrewery
12. first starting, the delay in sales could potentially impact cash
flow.
Employment law was another area impacting breweries. The
Affordable Care Act (ACA) and changes to the Fair Labor
Standards Act (FLSA) greatly affected labor cost in the
industry. Where the ACA mandated health care coverage by
employers, the FLSA changed overtime rules for employees
previously classified as exempt or salaried. Finally, many states
and municipalities passed or were considering passing increases
to minimum wage. These changes in regulations could lead to
significant increases in business costs, potentially impacting a
brewery’s ability to remain viable or competitive.
Lawsuits might also impact breweries’ operations. Trademark
infringement lawsuits regarding brewery and beer names were
common. Further, food-related lawsuits could occur. In 2017,
there were potential lawsuits against breweries distributing in
California that did not meet the May 2016 requirement of
providing an additional sign warning against pregnancy and
BPA (Bisphenyl-A) consumption. BPA was commonly found in
both cans and bottle caps, and thus breweries were potentially
legally exposed, exemplifying the potential legal exposure to
any brewery.Suppliers to Breweries
The main suppliers to the industry were those who supply grain
and hops. Growers might sell direct to breweries or distribute
through wholesalers. Brewers who wish to produce a grain-
specific beer would be required to procure the specific grain.
Further, recipes might call for a variety of grains, including rye,
wheat, and corn. As previously mentioned, the definition of
craft was changed not only to include a higher threshold for
annual production, but it also was changed Page 265to not
exclude producers who used other grains, such as corn, in their
production. Finally, origin-specific beers, such as German- or
Belgian-styles, might also require specific grains.
The more specialized the grain or hop, the more difficult it was
to obtain. Those breweries, then, competing based on
specialized brewing were required to identify such suppliers.
13. Conversely, larger, global producers of single-style beers were
able to utilize economies of scale and demand lower prices from
suppliers. Organically grown grains and hops suppliers would
also fall into this category of providing specialized ingredients,
and specialty brewers tend to use such ingredients.
Exhibit 5 illustrates the amount of grain products used between
2010 and 2014 in the United States by breweries.
Grain*
2010
2011
2012
2013
2014
Corn
701
629
681
593
574
Rice
714
749
717
724
604
Barley
88
128
136
158
169
Wheat
22
24
26
30
14. 33
Malt
4,147
4,028
4,117
3,916
3,689
*Includes products derived from the type of grain for brewing
process.Source: Alcohol and Tobacco Tax and Trade Bureau
website.
EXHIBIT 5
Total Grain Usage in the Production of Beer, 2010–2014 (in
millions of pounds)
It was estimated that hops acreage within the United States
grew more than 70 percent from 2011 to 2016,6 which seems to
follow the growing demand due to the increased number of
breweries. Hops were primarily grown in the Pacific Northwest
states of Idaho, Washington, and Oregon. Washington’s Yakima
Valley was probably one of the more recognizable geographic-
growing regions. There were numerous varieties of hops,
however, and each contributes a different aroma and flavor
profile. Hop growers have also trademarked names and varieties
of hops. Further, as with grains, some beer styles require
specific hops. Farmlands that were formerly known for hops
have started to see a rejuvenation of this crop, such as in New
England. In other areas, farmers were introducing hops as a new
cash crop. Some hops farms were also dual purpose, combining
the growing operations with brewing, thus serving as both a
supplier of hops to breweries while also producing their own
beer for retail. Recent news reports, however, were citing
current and future shortages of hops due to the increased
number of breweries. Rising temperatures in Europe led to a
diminished yield in 2015, further impacting hops supplies. For
breweries using recipes that require these specific hops,
shortages could be detrimental to production. In some instances,
larger beer producers had vertically integrated into hops
15. farming to protect their supply.
Suppliers to the industry also include manufacturers and
distributors of brewing equipment, such as fermentation tanks
and refrigeration equipment. Purification equipment and testing
tools were also necessary, given the brewing process and the
need to ensure purity and safety of the product.
Depending on distribution and the distribution channel,
breweries might need bottling or canning equipment. Thus
breweries might invest heavily in automated bottling
capabilities to expand capacity. Recently, however, there had
been shortages in 16-ounce aluminum cans.How Breweries
Compete: Innovation and Quality versus Price
The consumer might seek out a specific beer or brewery’s name,
or purchase the lower-priced globally known brand. For some,
beer drinking might also be Page 266seasonal, as tastes change
with the seasons. Lighter beers were consumed in hotter
months, while heavier beers were consumed in the colder
months. Consumers might associate beer styles with the time of
year or season. Oktoberfest and German-style beers were
associated with fall, following the German-traditional
celebration of Oktoberfest. Finally, any one consumer might
enjoy several styles, or choose to be brewery or brand loyal.
The brewing process and the multiple varieties and styles of
beer allow for breweries to compete across the strategy
spectrum—low price and high volume, or higher price and low
volume. Industry competitors, then, might target both price
point and differentiation. The home brewer, who decided to
invest several thousand dollars in a small space to produce very
small quantities of beer and start a nanobrewery, might utilize a
niche competitive strategy. The consumer might patronize the
brewery on location, or seek it out on tap at a restaurant given
the quality and the style of beer brewed. If allowed by law, the
brewery might offer tastings or sell onsite to visitors. Further,
the nanobrewer was free to explore and experiment with unusual
flavors. To drive awareness, the brewer might enter
competitions, attend beer festivals, or host tastings and “tap
16. takeovers” at local restaurants. If successful, the brewer might
invest in larger facilities and equipment to increase capacity
with growing demand.
The larger, more established craft brewers, especially those
considered regional breweries, might compete through
marketing and distribution, while offering a higher value
compared to the mass production of macrobreweries. However,
the consumer might at times be sensitive to and desire the craft
beer experience through smaller breweries—so much so that
even craft breweries who by definition were craft might draw
the ire of the consumer due to its size and scope. Boston Beer
Company was one such company. Even though James Koch
started it as a microbrewery, pioneering the craft beer
movement in the 1980s, some craft beer consumers do not view
it as authentically craft.
Larger macrobreweries mass produced and competed using
economies of scale and established distribution systems. Thus,
low cost preserves margins as lower price points drive volume
sales. Many of these brands were sold en masse at sporting and
entertainment venues, as well as larger restaurant chains,
driving volume sales.
Companies like SABMiller and AB InBev possessed brands
within their portfolio that were sold under the perception of
craft beer, in what Boston Beer Company deems the better beer
category—beer with a higher price point, but also of higher
quality. For example, Blue Moon—a Belgian-style wheat ale—
was produced by MillerCoors. Blue Moon’s market share had
increased significantly since 2006 following the rise in craft
beer popularity, competing against Boston Beer Company’s Sam
Adams in this better beer segment. AB InBev had also recently
acquired the larger better-known craft breweries, including
Goose Island, in 2011. With a product portfolio that included
both low-price and premium craft beer brands, macrobreweries
were competing across the spectrum and putting pressure on
breweries within the better and craft beer segments—segments
demanding a higher price point due to production.
17. However, a lawsuit had claimed the marketing of Blue Moon
was misleading and its marketing obscured the ownership
structure. Although the case was dismissed, it further illustrated
consumer sentiment regarding what was perceived as craft beer.
It also illustrated the power of marketing and how a
macrobrewery might position a brand within these
segments.Consolidations and Acquisitions
In 2015 AB InBev offered to purchase SABMiller for $108
billion, which was approved by the European Union and
finalized in 2016. To allow for the acquisition, many of
SABMiller’s brands were required to be divested. Asahi Group
Holdings Ltd. purchased the European brands Peroni and
Grolsch from SABMiller. Molson Coors purchased SABMiller’s
58 percent ownership in MillerCoors LLC—originally a joint
venture between Molson Coors and SABMiller. This transaction
provided Molson Coors with 100 percent ownership of
MillerCoors. It should be noted that AB InBev and MillerCoors
represented over 80 percent of the beer produced in the United
States for domestic consumption.Page 267
Purchases of craft breweries by larger companies had also
increased during the 2010s. AB InBev had purchased 10 craft
breweries since 2011, including Goose Island, Blue Point, and
Devil’s Backbone Brewing. MillerCoors—whose brands already
included Killian’s Irish Red, Leinenkugel’s, and Foster’s—
acquired Saint Archer Brewing Company. Ballast Point Brewing
& Spirits was acquired by Constellations Brands. Finally,
Heineken NV purchased a stake in Lagunitas Brewing Company.
It would seem that craft beer and breweries had obtained the
attention of not only the consumer, but also the larger
multinational breweries and corporations.Profiles of Beer
Producers
Anheuser-Busch InBev
As the world’s largest producer by volume, AB InBev employed
over 150,000 people in 26 different countries. The product
portfolio included the production, marketing, and distribution of
18. over 200 beers, malt beverages, as well as soft drinks in 130
countries. These brands included Budweiser, Stella Artois,
Leffe, and Hoegaarden.
AB InBev managed its product portfolio through three tiers.
Global brands, such as Budweiser, Stella Artois, and Corona,
were distributed throughout the world. International brands
(Beck’s, Hoegaarden, Leffe) were found in multiple countries.
Local champions (i.e., local brands) represented regional or
domestic brands acquired by AB InBev, such as Goose Island in
the United States and Cass in South Korea. While some of the
local brands were found in different countries, it was due to
geographic proximity and the potential to grow the brand larger.
AB InBev estimated its market share in China as 19 percent,
United States 46 percent, Brazil 68 percent, and Mexico 58
percent.7 Its strength in brand recognition and focused
marketing on what it deemed as core categories resulted in AB
InBev as the top brewery in the United States, Brazil, and
Mexico markets, and number three in China by volume. AB
InBev reported that its 2016 volumes declined in Asia Pacific,
parts of Latin America, and Europe, Middle East, and Africa.
However, AB InBev's total revenue increased by 3 percent in
2016, led by 6 percent and 14 percent growth attributed to
Stella Artois and Corona, respectively.
AB InBev invested heavily in marketing. Budweiser planned to
sponsor the 2018 and 2022 FIFA World Cups™, as it had
sponsored the 2014 competition. This marketing helped bolster
the Budweiser brand, which experienced revenue growth of 3
percent in 2016. Bud Light—which was the best-selling beer in
the United States in 2016, is official sponsor of the National
Football League through 2022.
AB InBev had also actively acquired other brands and breweries
since the 1990s, including Labatt in 1995, Beck’s in 2002,
Anheuser-Busch in 2008, and Grupo Modelo in 2013. All of
these acquisitions preceded the SABMiller purchase. These
acquisitions provided AB InBev greater market share and
penetration through combining marketing and operations to all
19. brands. The reacquisition of the Oriental Brewery in 2014 was a
good example of the potential synergies garnered. Cass was the
leading beer in Korea and was produced by Oriental Brewery;
however, while Cass represented the local brand for AB InBev
in Korea, Hoegaarden was distributed in Korea, along with the
global brands of Budweiser, Corona, and Stella Artois.
A summary of AB InBev’s financial performance from 2014 to
2016 is presented in Exhibit 6.
2016
2015
2014
Revenue
$45,517
$43,604
$47,063
Cost of sales
(17,803)
(17,137)
(18,756)
Gross profit
27,715
26,467
28,307
Selling, general and administrative expenses
(15,171)
(13,732)
(10,285)
Other operating income/expenses
732
1,032
1,386
Non-recurring items
(394)
136
(197)
20. Profit from operations (EBIT)
12,882
13,904
15,111
Depreciation, amortization and impairment
3,477
3,153
3,354
EBITDA
$16,360
$ 17,057
$18,465
Sources: AB InBev Annual Reports, 2015, 2016.
EXHIBIT 6
Financial Summary for AB InBev, 2014–2016 (in millions of $)
Boston Beer Company
Boston Beer Company was the second largest craft brewer by
volume in the United States with sales of 4 million barrels in
2016. The company's 2016 sales volume declined by 100,000
barrels in 2016, but it remained the fifth largest overall brewer
in the United States—see Exhibit 2. The company history states
the recipe for Sam Adams was actually company founder Jim
Koch’s great-great-grandfather’s recipe. The story of Boston
Beer Company and Jim Koch’s success was referenced at times
as the beginning of the craft beer movement, often citing how
Koch originally sold his beer to bars with the beer and pitching
on the spot.
This beginning seemed to underpin much of Boston Beer
Company’s strategy as it competed in Page 268the higher value
and higher price-point category it referred to as the better beer
segment. Focusing on quality and taste, Boston Beer Company
marketed Samuel Adams Boston Lager as the original beer Koch
first discovered. The company also produced several Sam
Adams seasonal beers, such as Sam Adams Summer Ale and
Sam Adams Octoberfest. Other seasonal Sam Adams beers had
21. limited release in seasonal variety packs, including Samuel
Adams Harvest Pumpkin and Samuel Adams Holiday Porter. In
addition, there was also a Samuel Adams Brewmaster’s
Collection, a much smaller, limited release set of beers at much
higher points, including the Small Batch Collection and Barrel
Room Collection. Utopia—its highest-priced beer—was branded
as highly experimental and under very limited release.
In the spirit of craft beer and innovation, several years ago
Boston Beer Company launched a craft brew incubator as a
subsidiary, which had led to the successful development and
sales of beers under the Traveler Beer Company brand. The
incubator, Alchemy and Science, also built Concrete Beach
Brewery and Coney Island Brewery. Alchemy and Science
contributed to 7 percent of the total net sales in 2015 and 4
percent of net sales in 2016.
Boston Beer Company offered three non-beer brands. The
Twisted Tea brand was launched in 2001 and the Angry Orchard
brand was originated in 2011. Truly Spiked & Sparkling was a 5
percent alcohol sparkling water launched in 2016. These other
brands and products competed in the flavored malt beverage and
the hard cider categories, respectively.
A summary of Boston Brewing Company’s financial
performance from 2014 to 2016 is presented in Exhibit 7.
2016
2015
2014
Revenue
$968,994
$1,024,040
$966,478
Excise taxes
(62,548)
(64,106)
(63,471)
Cost of goods sold
22. (446,776)
(458,317)
(437,996)
Gross profit
459,670
501,617
465,011
Advertising, promotional and selling expenses
244,213
273,629
250,696
General and administrative expenses
78,033
71,556
65,971
Impairment of assets
(235)
258
1,777
Operating income
137,659
156,174
146,567
Interest income
56
56
21
Other expense, net
(594)
(1,220)
(994)
Provision for income taxes
49,772
56,596
54,851
Net Income
23. $ 87,349
$ 98,414
$ 90,743
Source: Boston Beer Company Annual Reports, 2015, 2016.
EXHIBIT 7
Financial Summary for Boston Brewing Company, 2014–2015
(in thousands of $)
Craft Brew Alliance
Craft Brew Alliance was the sixth largest craft brewing
company in the United States, and was ranked ninth for overall
brewing by volume in 2016. Founded in 2008, it represents the
mergers between Redhook Brewery, Widmer Brothers Brewing,
and Kona Brewing Company. Each with substantial history, the
decision to merge was to help assist with growth and meeting
demand. The Craft Brew Alliance also included Omission
Brewery, Resignation Brewery, and Square Mile Cider
Company. In addition to these brands, Craft Brew Alliance
operated five brewpubs. In total, there were 820 people
employed at Craft Brew Alliance, producing just over 1 million
barrels in 2016.
Craft Brew Alliance utilized automated brewing equipment and
distributed nationally through the Anheuser-Busch wholesaler
network alliance, leveraging many of the logistics and thus cost
advantages associated. Yet, it remained independent, leveraging
both its craft brewery brands and the cost advantage associated
with larger distributionPage 269 networks. It was the only
independent craft brewer to achieve this relationship and sought
to leverage the partnership to distribute its products in
international markets.
Craft Brew Alliance engaged in contract brewing—a practice
where space capacity in production was utilized to produce beer
under contract for sale under a different label or brand. In
addition, it had partnerships with retailers like Costco and
Buffalo Wild Wings, garnering further consumer exposure as
well as sales.
24. A summary of Craft Brew Alliance’s financial performance
from 2014 to 2016 is presented in Exhibit 8.
2016
2015
2014
Revenue
$202,507
$204,168
$200,022
Cost of sales
(142,908)
(141,972)
(141,312)
Gross profit
59,599
62,196
58,710
Selling, general and administrative expenses
59,224
57,932
53,000
Operating income
375
4,264
5,710
Income before provision for income taxes
(306)
3,718
5,099
Provision for income taxes
14
1,500
2,022
Net Income
$ 320
25. $ 2,218
$ 3,077
Sources: Craft Brew Alliance Annual Reports, 2015 and 2016.
EXHIBIT 8
Financial Summary for Craft Brew Alliance, 2014–2016 (in
thousands of $)Strategic Issues Confronting Craft Breweries in
2017
The vast majority of the craft breweries might produce only
enough beer for the local population in their area. Many of
these breweries started the same way as the larger breweries:
Home brewers or hobbyists Page 270decided to start to brew
and sell their own beer. Many obtained startup capital through
their own savings or solicited investments from friends and
family.
Given their entrepreneurial beginnings, these microbreweries
and even smaller nanobreweries were usually located in
industrial spaces. They were solely operated by the brewer-
turned-entrepreneur, or a small staff of two or three. This staff
would help with brewing and production, as well as potentially
brewery tours and visits—probably the most common marketing
and consumer relations tactic utilized by smaller breweries.
While almost all breweries offered tours and tastings, these
became ever more critical to the smaller brewery with limited
capital for marketing and advertising. If onsite sales were
available, the brewer could sell growlers to visitors.
Social media websites also offered significant exposure for free
and had become a foundational element of brewery marketing.
These websites helped the brewery reach the craft beer
consumer, who tended to seek out and follow new and upcoming
breweries. There were also mobile phone applications specific
to the craft beer industry that could help a startup gain
exposure. Participating in craft beer festivals, where local and
regional breweries were able to offer samples to attendees, was
another opportunity to gain exposure.
Some small microbreweries did not have enough employees for
bottling and labeling, and had been known to solicit volunteers