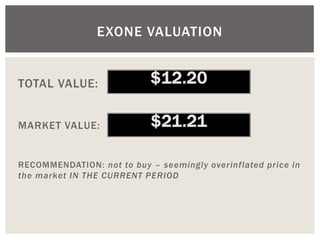
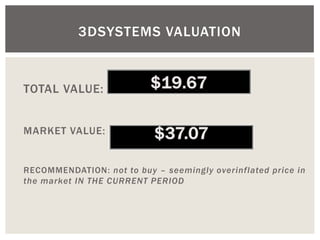
An Investor’s Report 
3D SYSTEMS THE EXONE COMPANY
ABOORVA SUNDAR 
DEGREE: Business/Law –majoring in Finance 
CAREER ASPRIATIONS: Family Law Barrister
Holding company founded in 1986 by Chuck Hull 
Market leader 
Growing customer base 
Incorporate stereolithography, selective laser sintering, colour-jet printing, fused deposition modelling, multi-jet printing and direct metal sintering technologies in its processes. 
3D SYSTEMS (DDD)
Founded in 2005 
Provides printing machines, printed products, material and other services to industrial customers on a global scale. 
They also supply associated materials, including consumables, replacement parts, and technical support that is necessary for their consumers. 
XONE’s ability to print products from a variety of desirable materials is one of their key competitive advantages. 
THE EXONE COMPANY (XONE)
Third quarter results are below expectations 
Company shares fell by 16.6 percent 
Revenue forcast fell from $700-740million to $650- 690million 
Missed Wall Street earnings targets for the last 6 consecutive quarters 
These figures have been blamed on 3D Systems decision to invest heavily on increasing the capacity of a metal printer maker Phoneix Systems which it acquired in July 2013. 
3D Systems inability to reach sales goals and the delayed availability of some of its consumer products are also attributable reasons for the fall in their results. 
3D SYSTEMS (DDD)
Their reported revenue of $11.20million for the quarter is well below the analysts’ consensus estimate of $12.11million. 
Reported $0.32 earnings per share for the quarter is $0.18 below analysts estimates. 
However their stocks saw unusually large options trading activity, with investors purchasing 2,084 put options on the company which is an approximately 250% increase compared to the average volume of 596 put options. 
THE EXONE COMPANY (XONE)
HAMEEDA ANWAR 
DEGREE: Business/Law –majoring in Finance 
CAREER ASPIRATIONS: Banking Law
RESIDUAL INCOME MODEL 
Calculations based on forecasting EPS and ROE – derived in the Balance Sheet and Profit & Loss statement 
Less potential errors compared to FCF model 
This model can be better estimate the value of the firm when the industry is unpredictable 
MODEL: EARNINGS BASED MODEL
Market forecasts EPS for the first 3 years based on the highest EPS given by the NASDAQ- closest to near future values/more reliable than our figures 
Beyond this; 
12% in EPS based on ExOnes future historical trends 
3% growth in EPS for 3D systems 
APPLICATION
2014-2020 
2020 seems to set a reasonable projected horizon, based on the industry’s expected growth (set at 2018- 2121) 
4D printing on the horizon? 
HORIZON FORECAST
EXONE 
-1.8 
-1.6 
-1.4 
-1.2 
-1 
-0.8 
-0.6 
-0.4 
-0.2 
0 
0.2 
0.4 
2013 
2014 
2015 
2016 
2017 
2018 
2019 
2020 
PV of Residual Income 
PV of Residual Income (Residual 
Income * Discount Factor )
EPS as per the NASDAQ for 2013- 2016 
EPS growth at 12% thereafter 
Constant BETA of 0.71 (NASDAQ) 
Constant Re: 0.05763 (assumed no growth)- difficult to assert in the volatile technological/ electronics market 
ASSUMPTIONS
TOTAL VALUE: 
MARKET VALUE: 
RECOMMENDATION: not to buy – seemingly overinflated price in the market IN THE CURRENT PERIOD 
EXONE VALUATION
ExOne 
Vo 
Growth 0% B=0.71 
12.20038 
B= 1.02 ( Avg tech/electronics industry) 
7.079217 
Growth 3% B= 0.71 
16.57677 
B= 0.5 
17.78179 
SENSITIVITY ANALYSIS
3DSYSTEMS 
-1.5 
-1 
-0.5 
0 
0.5 
1 
2013 
2014 
2015 
2016 
2017 
2018 
2019 
2020 
PV of Residual Income 
PV of Residual Income (Residual Income * 
Discount Factor )
EPS as per the NASDAQ for 2013- 2016 
EPS growth at 3% thereafter 
Constant BETA of 1.4 (NASDAQ) 
Constant Re: 0.09213 (assume no growth)- difficult to assert in the volatile technological/ electronics market 
ASSUMPTIONS
3DSYSTEMS VALUATION 
TOTAL VALUE: 
MARKET VALUE: 
RECOMMENDATION: not to buy – seemingly overinflated price in the market IN THE CURRENT PERIOD
3D systems 
Vo 
Growth 0% B=1.4 
19.67411 
B=1.02 (avg tech industry ) 
23.34406 
Growth 3% B=1.4 
24.63899 
B=0.5 
31.21335 
B=2.00 growth 5% 
20.89057 
SENSITIVITY ANALYSIS
NAFIZ CHOWDHURY 
DEGREE: Business/Law –majoring in Finance CAREER ASPIRATIONS: Banking
Total corporate value less debt, 
the future free cash flow that investors expect the company to generate over a defined timeframe 
discounted by the cost of capital appropriate for the business 
FCF OVERVIEW
ExOne 2014 FCF for common equity: 8017.9 
3D Systems 2014 FCF for common equity: 22518.84 
XONE: 
Market: 21.21 
-5%: 5.43 
0%: 10.17 
+3%: 21.94 
DDD: 
Market: 37.08 
-5%: 17.65 
0%: 31.42 
+3%: 64.77 
FCF: MARKET VS ESTIMATES
3 Scenarios 
+3% growth 
0% stagnation 
-5% recession 
Long term vs. short term 
2014-2020 
Intrinsic value vs. Investor behaviour 
FCF KEY CONCEPTS
Do not invest 
Speculative nature of growth in both methods recommend holding out for the long term 
Until DCF indicates the intrinsic share price for both firms 
RECOMMENDATION

CFA presentation

  • 1.
    An Investor’s Report 3D SYSTEMS THE EXONE COMPANY
  • 2.
    ABOORVA SUNDAR DEGREE:Business/Law –majoring in Finance CAREER ASPRIATIONS: Family Law Barrister
  • 3.
    Holding company foundedin 1986 by Chuck Hull Market leader Growing customer base Incorporate stereolithography, selective laser sintering, colour-jet printing, fused deposition modelling, multi-jet printing and direct metal sintering technologies in its processes. 3D SYSTEMS (DDD)
  • 4.
    Founded in 2005 Provides printing machines, printed products, material and other services to industrial customers on a global scale. They also supply associated materials, including consumables, replacement parts, and technical support that is necessary for their consumers. XONE’s ability to print products from a variety of desirable materials is one of their key competitive advantages. THE EXONE COMPANY (XONE)
  • 5.
    Third quarter resultsare below expectations Company shares fell by 16.6 percent Revenue forcast fell from $700-740million to $650- 690million Missed Wall Street earnings targets for the last 6 consecutive quarters These figures have been blamed on 3D Systems decision to invest heavily on increasing the capacity of a metal printer maker Phoneix Systems which it acquired in July 2013. 3D Systems inability to reach sales goals and the delayed availability of some of its consumer products are also attributable reasons for the fall in their results. 3D SYSTEMS (DDD)
  • 6.
    Their reported revenueof $11.20million for the quarter is well below the analysts’ consensus estimate of $12.11million. Reported $0.32 earnings per share for the quarter is $0.18 below analysts estimates. However their stocks saw unusually large options trading activity, with investors purchasing 2,084 put options on the company which is an approximately 250% increase compared to the average volume of 596 put options. THE EXONE COMPANY (XONE)
  • 7.
    HAMEEDA ANWAR DEGREE:Business/Law –majoring in Finance CAREER ASPIRATIONS: Banking Law
  • 8.
    RESIDUAL INCOME MODEL Calculations based on forecasting EPS and ROE – derived in the Balance Sheet and Profit & Loss statement Less potential errors compared to FCF model This model can be better estimate the value of the firm when the industry is unpredictable MODEL: EARNINGS BASED MODEL
  • 9.
    Market forecasts EPSfor the first 3 years based on the highest EPS given by the NASDAQ- closest to near future values/more reliable than our figures Beyond this; 12% in EPS based on ExOnes future historical trends 3% growth in EPS for 3D systems APPLICATION
  • 10.
    2014-2020 2020 seemsto set a reasonable projected horizon, based on the industry’s expected growth (set at 2018- 2121) 4D printing on the horizon? HORIZON FORECAST
  • 11.
    EXONE -1.8 -1.6 -1.4 -1.2 -1 -0.8 -0.6 -0.4 -0.2 0 0.2 0.4 2013 2014 2015 2016 2017 2018 2019 2020 PV of Residual Income PV of Residual Income (Residual Income * Discount Factor )
  • 12.
    EPS as perthe NASDAQ for 2013- 2016 EPS growth at 12% thereafter Constant BETA of 0.71 (NASDAQ) Constant Re: 0.05763 (assumed no growth)- difficult to assert in the volatile technological/ electronics market ASSUMPTIONS
  • 13.
    TOTAL VALUE: MARKETVALUE: RECOMMENDATION: not to buy – seemingly overinflated price in the market IN THE CURRENT PERIOD EXONE VALUATION
  • 14.
    ExOne Vo Growth0% B=0.71 12.20038 B= 1.02 ( Avg tech/electronics industry) 7.079217 Growth 3% B= 0.71 16.57677 B= 0.5 17.78179 SENSITIVITY ANALYSIS
  • 15.
    3DSYSTEMS -1.5 -1 -0.5 0 0.5 1 2013 2014 2015 2016 2017 2018 2019 2020 PV of Residual Income PV of Residual Income (Residual Income * Discount Factor )
  • 16.
    EPS as perthe NASDAQ for 2013- 2016 EPS growth at 3% thereafter Constant BETA of 1.4 (NASDAQ) Constant Re: 0.09213 (assume no growth)- difficult to assert in the volatile technological/ electronics market ASSUMPTIONS
  • 17.
    3DSYSTEMS VALUATION TOTALVALUE: MARKET VALUE: RECOMMENDATION: not to buy – seemingly overinflated price in the market IN THE CURRENT PERIOD
  • 18.
    3D systems Vo Growth 0% B=1.4 19.67411 B=1.02 (avg tech industry ) 23.34406 Growth 3% B=1.4 24.63899 B=0.5 31.21335 B=2.00 growth 5% 20.89057 SENSITIVITY ANALYSIS
  • 19.
    NAFIZ CHOWDHURY DEGREE:Business/Law –majoring in Finance CAREER ASPIRATIONS: Banking
  • 20.
    Total corporate valueless debt, the future free cash flow that investors expect the company to generate over a defined timeframe discounted by the cost of capital appropriate for the business FCF OVERVIEW
  • 21.
    ExOne 2014 FCFfor common equity: 8017.9 3D Systems 2014 FCF for common equity: 22518.84 XONE: Market: 21.21 -5%: 5.43 0%: 10.17 +3%: 21.94 DDD: Market: 37.08 -5%: 17.65 0%: 31.42 +3%: 64.77 FCF: MARKET VS ESTIMATES
  • 22.
    3 Scenarios +3%growth 0% stagnation -5% recession Long term vs. short term 2014-2020 Intrinsic value vs. Investor behaviour FCF KEY CONCEPTS
  • 23.
    Do not invest Speculative nature of growth in both methods recommend holding out for the long term Until DCF indicates the intrinsic share price for both firms RECOMMENDATION