Downloaded 222 times


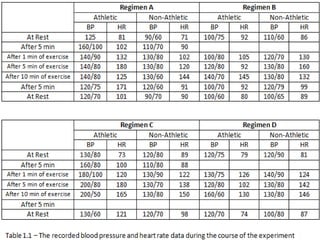
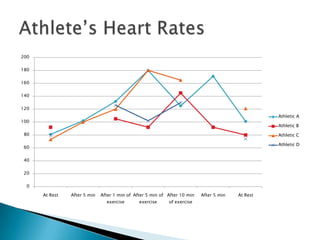
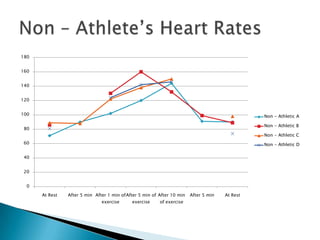
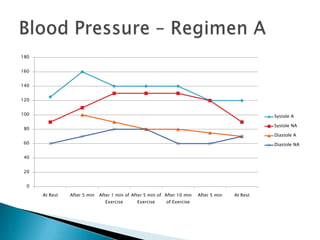

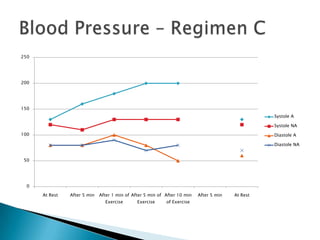
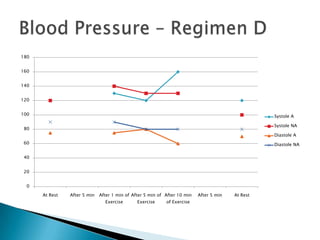

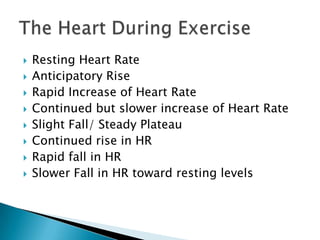


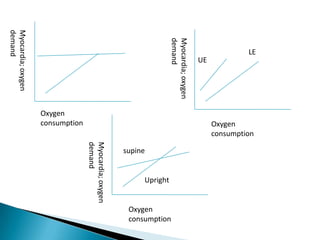


The document describes an experiment that measured and compared the vital signs of athletic and non-athletic subjects during different exercise regimens involving treadmill use. Sixteen students monitored subjects' blood pressure, pulse rate, and other vital signs as the subjects performed various warm-up, exercise, and cool-down routines. The results were recorded and showed changes in vital signs over time and between athletic and non-athletic groups. Potential sources of error in the experiment are also outlined.