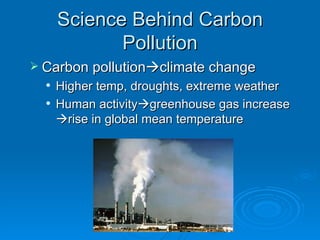
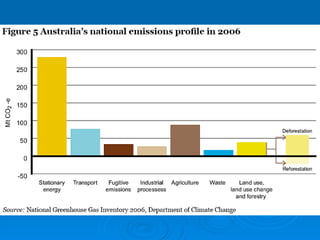
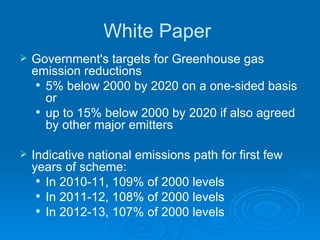
Carbon Pollution Reduction Scheme (Australia)   Lily Mu & Christina Wu Econ HL
Background Info Australia   hottest and driest continents on earth Climate Change Food production Water supplies Great Barrier Reef Tourism Industry and environmental challenges facing Australia and the rest of the world.
Science Behind Carbon Pollution Carbon pollution  climate change  Higher temp, droughts, extreme weathe r Human activity  greenhouse gas increase   rise in global mean temperature
 
Green Paper
White Paper
Strategy and Aims Mitigation  Reduce Australia’s greenhouse gas emissions  60% emissions reduction (2050) Adaptation  Adapt to climate change that cannot be avoided  International engagement  Achieve low carbon economy  Households and business assistance    adjust to carbon price Ensure scheme achieves its central objectives  Use every cent raised to assist households and business
Scheme Coverage 75% national emissions  1000 firms  6 Kyoto gases
 
Stakeholders
Commitments to Households Increase payments to low-income households, pensioner, senior  Provide assistance to middle income households
Assistance to Business and Workers Climate Change Action Fund  Investment in new low-emissions technologies  spread of innovation and environment-friendly practices among small/medium sized businesses Provide assistance to regional workers
Model – Negative Externality (S)MPC (D)MPB Pp Qp (S)MSC tax Pso Qso Pt (D)MSB Quantity Price Qt Increase in Price Decrease in Quantity
What is the Market Failure? Carbon pollution Too much produced at too low of a price No cost
What is the proposed remedy? “ Carbon pollution reduction scheme”  Cap-and-trade system of emissions trading for greenhouse gases.  A central authority sets a limit/cap on amount of a pollutant that can be emitted.  Introduce in Australia in 2010 as part of its climate change policy
Green Paper Objectives:  Meet Australia’s emissions reduction targets in most flexible & cost-effective way Support an effective global response to climate change Provide for transitional assistance for the most affected households and firms
How does it work? Buy a 'pollution permit' for each tonne of carbon they contribute to atmosphere. Concentrate on biggest polluters : Around 1000 Australian companies that produce more than 25000 tonnes of carbon pollution each year. 99% of all firms in Australia will not need to purchase permits for their emissions.
Cap  Limit on greenhouse gas emissions  Creates a price for carbon & ability to trade assures that emissions are reduced at lowest possible price.  Must be consistent with longer term goals of reducing Australia’s emissions by 60% compared with 2000 levels by 2050
Trade Price of permits will be determined by market.  By trading amongst themselves, firms achieve scheme cap at least cost to economy.
White Paper  Government's targets for Greenhouse gas emission reductions 5% below 2000 by 2020 on a one-sided basis or  up to 15% below 2000 by 2020 if also agreed by other major emitters Indicative national emissions path for first few years of scheme: In 2010-11, 109% of 2000 levels In 2011-12, 108% of 2000 levels In 2012-13, 107% of 2000 levels
Does it internalize the externality? Yes Best way to reduce carbon pollution while minimizing impact on business & households.
Citation Department of Climate Change. &quot;Australian Government.&quot;  Carbon Pollution Reduction Scheme. 13 Mar. 2009. Australian Government of Climate Change. 14 Mar 2009 <http://www.climatechange.gov.au/greenpaper/index.html>. &quot;Carbon Pollution Reduction Scheme.&quot;  Wikipedia. USA: Wikimedia Foundation, Inc, 2009.  . &quot;Wikipedia.&quot;  Carbon Pollution Reduction Scheme. 12 Mar. 2009. Wikimedia Foundation. Inc. 11 Mar. 2009 <http://en.wikipedia.org/wiki/Carbon_Pollution_Reduction_Scheme>. Socha, Tom. &quot;Air Pollution Causes and Effects .&quot;  Health and Energy. 09 Nov. 2007. . 11 Mar. 2009 <http://healthandenergy.com/air_pollution_causes.htm>.

Carbon Pollution Australia

  • 1.
    Carbon Pollution ReductionScheme (Australia) Lily Mu & Christina Wu Econ HL
  • 2.
    Background Info Australia hottest and driest continents on earth Climate Change Food production Water supplies Great Barrier Reef Tourism Industry and environmental challenges facing Australia and the rest of the world.
  • 3.
    Science Behind CarbonPollution Carbon pollution  climate change Higher temp, droughts, extreme weathe r Human activity  greenhouse gas increase  rise in global mean temperature
  • 4.
  • 5.
  • 6.
  • 7.
    Strategy and AimsMitigation Reduce Australia’s greenhouse gas emissions 60% emissions reduction (2050) Adaptation Adapt to climate change that cannot be avoided International engagement Achieve low carbon economy Households and business assistance  adjust to carbon price Ensure scheme achieves its central objectives Use every cent raised to assist households and business
  • 8.
    Scheme Coverage 75%national emissions 1000 firms 6 Kyoto gases
  • 9.
  • 10.
  • 11.
    Commitments to HouseholdsIncrease payments to low-income households, pensioner, senior Provide assistance to middle income households
  • 12.
    Assistance to Businessand Workers Climate Change Action Fund Investment in new low-emissions technologies spread of innovation and environment-friendly practices among small/medium sized businesses Provide assistance to regional workers
  • 13.
    Model – NegativeExternality (S)MPC (D)MPB Pp Qp (S)MSC tax Pso Qso Pt (D)MSB Quantity Price Qt Increase in Price Decrease in Quantity
  • 14.
    What is theMarket Failure? Carbon pollution Too much produced at too low of a price No cost
  • 15.
    What is theproposed remedy? “ Carbon pollution reduction scheme” Cap-and-trade system of emissions trading for greenhouse gases. A central authority sets a limit/cap on amount of a pollutant that can be emitted. Introduce in Australia in 2010 as part of its climate change policy
  • 16.
    Green Paper Objectives: Meet Australia’s emissions reduction targets in most flexible & cost-effective way Support an effective global response to climate change Provide for transitional assistance for the most affected households and firms
  • 17.
    How does itwork? Buy a 'pollution permit' for each tonne of carbon they contribute to atmosphere. Concentrate on biggest polluters : Around 1000 Australian companies that produce more than 25000 tonnes of carbon pollution each year. 99% of all firms in Australia will not need to purchase permits for their emissions.
  • 18.
    Cap Limiton greenhouse gas emissions Creates a price for carbon & ability to trade assures that emissions are reduced at lowest possible price. Must be consistent with longer term goals of reducing Australia’s emissions by 60% compared with 2000 levels by 2050
  • 19.
    Trade Price ofpermits will be determined by market. By trading amongst themselves, firms achieve scheme cap at least cost to economy.
  • 20.
    White Paper Government's targets for Greenhouse gas emission reductions 5% below 2000 by 2020 on a one-sided basis or up to 15% below 2000 by 2020 if also agreed by other major emitters Indicative national emissions path for first few years of scheme: In 2010-11, 109% of 2000 levels In 2011-12, 108% of 2000 levels In 2012-13, 107% of 2000 levels
  • 21.
    Does it internalizethe externality? Yes Best way to reduce carbon pollution while minimizing impact on business & households.
  • 22.
    Citation Department ofClimate Change. &quot;Australian Government.&quot; Carbon Pollution Reduction Scheme. 13 Mar. 2009. Australian Government of Climate Change. 14 Mar 2009 <http://www.climatechange.gov.au/greenpaper/index.html>. &quot;Carbon Pollution Reduction Scheme.&quot; Wikipedia. USA: Wikimedia Foundation, Inc, 2009. . &quot;Wikipedia.&quot; Carbon Pollution Reduction Scheme. 12 Mar. 2009. Wikimedia Foundation. Inc. 11 Mar. 2009 <http://en.wikipedia.org/wiki/Carbon_Pollution_Reduction_Scheme>. Socha, Tom. &quot;Air Pollution Causes and Effects .&quot; Health and Energy. 09 Nov. 2007. . 11 Mar. 2009 <http://healthandenergy.com/air_pollution_causes.htm>.