SlideShare a Scribd company logo
1 of 12
Download to read offline
Practical Data Science
1 | P a g e
s3779142, s3755598
CAR EVALUATION DATABASE
Venkatesh Ramshetty Venkataramana1
(s3779142)
Jeevan Hemmannu Tharanatha2
(s3755598)
School of Science, Computer Science and Information Technology,
RMIT University, Australia
1
s3779142@student.rmit.edu.au, 2
s355598@studnet.rmit.edu.au
Date-01 June, 2019
Table of contents
1. Abstract........................................................................................................................................2
2. Introduction..................................................................................................................................2
2.1 Dataset Attributes……………...................................................................................................2
2.1. A. Do we need all the Variables? …………….........................................................................3
2.1. B. Target Attribute- classes……………...................................................................................3
3 Methodology……………….........................................................................................................4
3.1 Data collection…………….......................................................................................................4
3.2 Data preprocessing…………….................................................................................................4
3.3 Data exploration ……………....................................................................................................5
3.4 Splitting of dataset and randomization. ……………................................................................8
3.5 Data modeling (classification) ……………..............................................................................9
4. Results…………………………………………………………………………………………11
5. Discussion……………………………………………………………………………………..12
6. Conclusion…………………………………………………………………………………….12
7. References …………………………………………………………………………………….12
Practical Data Science
2 | P a g e
s3779142, s3755598
1. ABSTRACT.
Cars are essentially part of our regular day to day life. There are various kind of cars produced by different
manufacturers; subsequently the buyers has a decision to make. When as an individual consider of buying
a car, there are numerous aspects that could influence his/her choice on which kind of car he/she is keen
on. The choice buyer or drivers have generally relies upon the price, safety, and how luxurious and how
spacious the car is.
Car evaluation database is significant structure information that everyone should take a look at for the car
features and useful in decision making. This dataset are labeled according to the specification of PRICE,
COMFORT and SAFETY. The dataset utilized in this assignment can be access
https://archive.ics.uci.edu/ml/datasets/Car+Evaluation
The objective of this report is especially to determine the decision making, identifying the car variables like
car price value with other various variable to decide between a good acceptable cars from the unaccepted
values from the target value.
Keywords: Classification, Car Evaluation.
2. INTRODUCTION.
Understanding the idea in making a decision on a choice in getting a car is basic to everybody
particularly the first time buyer or anyone who are inexperienced in how the car business functions.
Generally we need a car as a methods for transportation however as we include fun into it and we
tend to forget that we shouldn’t underestimate.
In present times it is continuously the car sales representative who encourages us to purchase this
car or not and from the conclusion of our family and companions who had past experienced with
vehicle inconveniences. It would have been better to have a device that can check car features and
tell that it's an X car or a Y car. If there is such device there should be no worries in purchasing a
car. We may or probably won't know it consciously however we are basically ignoring the factors
that would help us financially, comfortably, and safety in a long run.
In this assignment we process the data, exploring the variables relationship between the attributes
and we model the data from different classification models, those are K nearest neighbor and Decision
trees in terms of their best set of parameter for each case and performance on car evaluation data set.
2.1 Dataset Attributes
The data set that we accessed from the UCI repository which is collection of observation of the
specified attributes of a car, it was donated by Marco Bohanec in 1997.
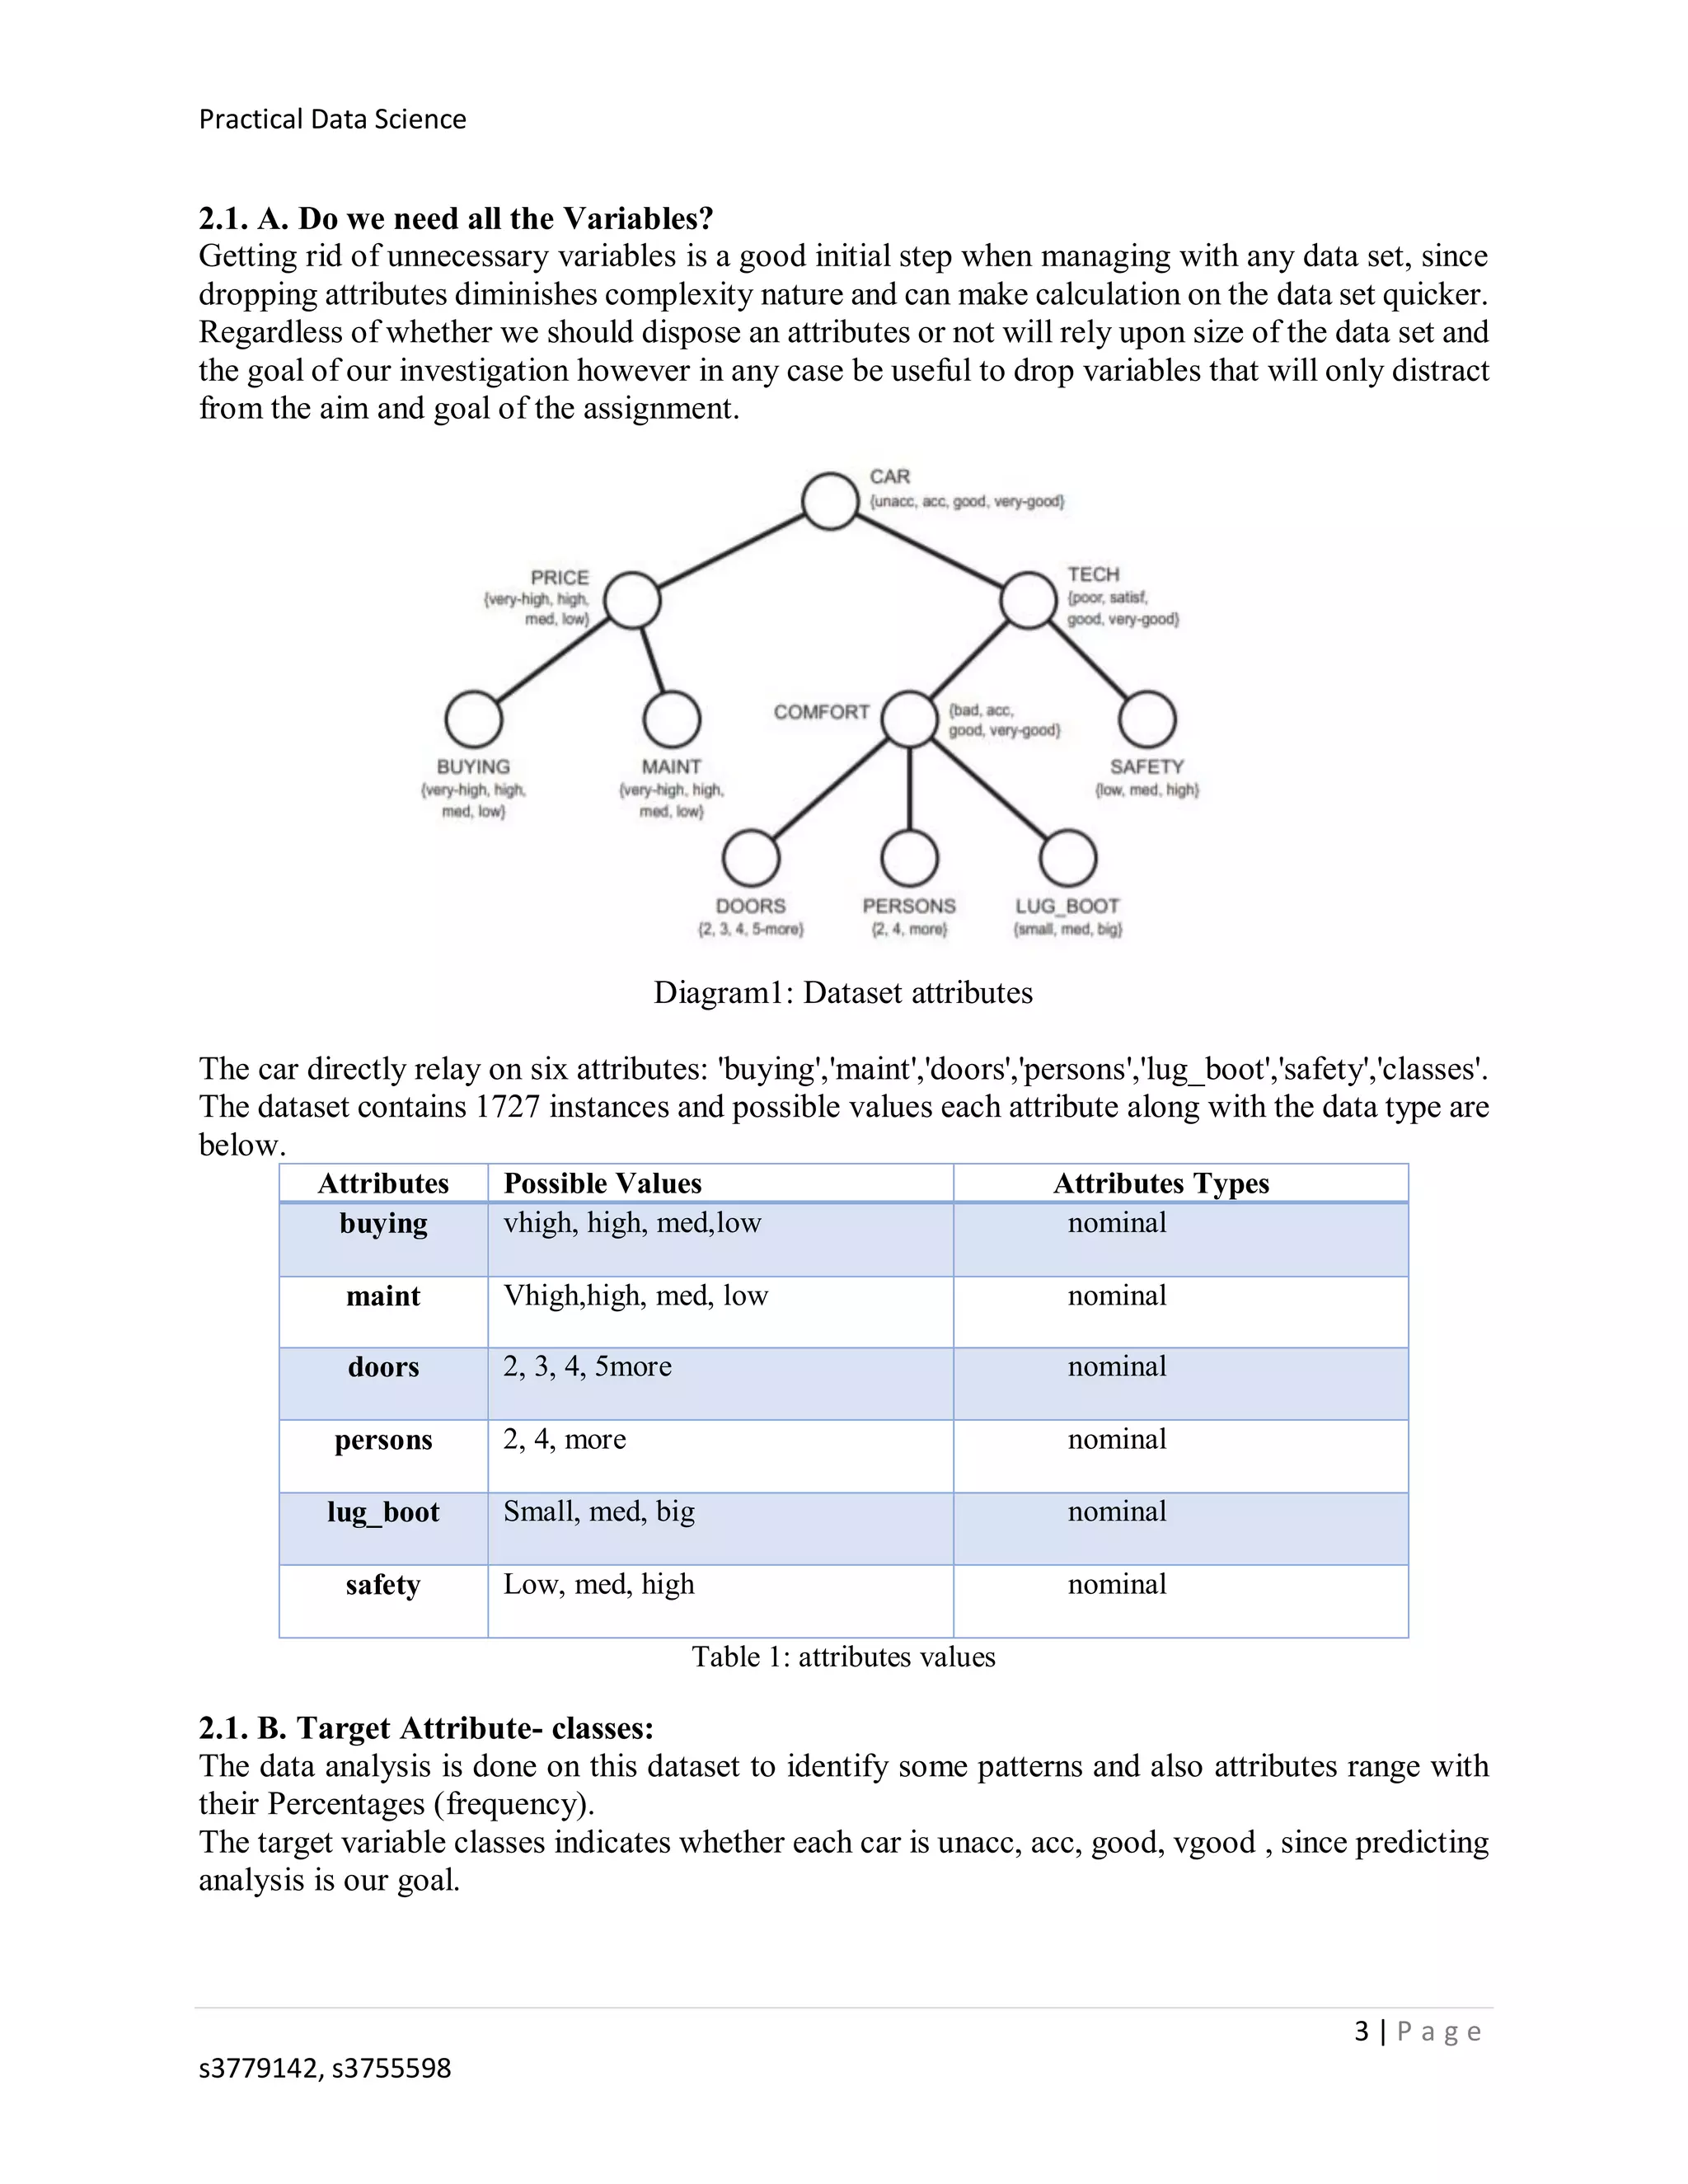
The Car Evaluation dataset contains following concept structure:
CAR- car acceptability.
PRICE- overall price of a car
buying -buying price of a car
maint -price of the maintenance
TECH- technical characteristics of a car
COMFORT- comfort in a car
doors -number of doors in a car
persons- capacity in terms of persons to carry in a car
lug_boot- the size of luggage boot in a car
safety- estimated safety of the car
Practical Data Science
3 | P a g e
s3779142, s3755598
2.1. A. Do we need all the Variables?
Getting rid of unnecessary variables is a good initial step when managing with any data set, since
dropping attributes diminishes complexity nature and can make calculation on the data set quicker.
Regardless of whether we should dispose an attributes or not will rely upon size of the data set and
the goal of our investigation however in any case be useful to drop variables that will only distract
from the aim and goal of the assignment.
Diagram1: Dataset attributes
The car directly relay on six attributes: 'buying','maint','doors','persons','lug_boot','safety','classes'.
The dataset contains 1727 instances and possible values each attribute along with the data type are
below.
Attributes Possible Values Attributes Types
buying vhigh, high, med,low nominal
maint Vhigh,high, med, low nominal
doors 2, 3, 4, 5more nominal
persons 2, 4, more nominal
lug_boot Small, med, big nominal
safety Low, med, high nominal
Table 1: attributes values
2.1. B. Target Attribute- classes:
The data analysis is done on this dataset to identify some patterns and also attributes range with
their Percentages (frequency).
The target variable classes indicates whether each car is unacc, acc, good, vgood , since predicting
analysis is our goal.
Practical Data Science
4 | P a g e
s3779142, s3755598
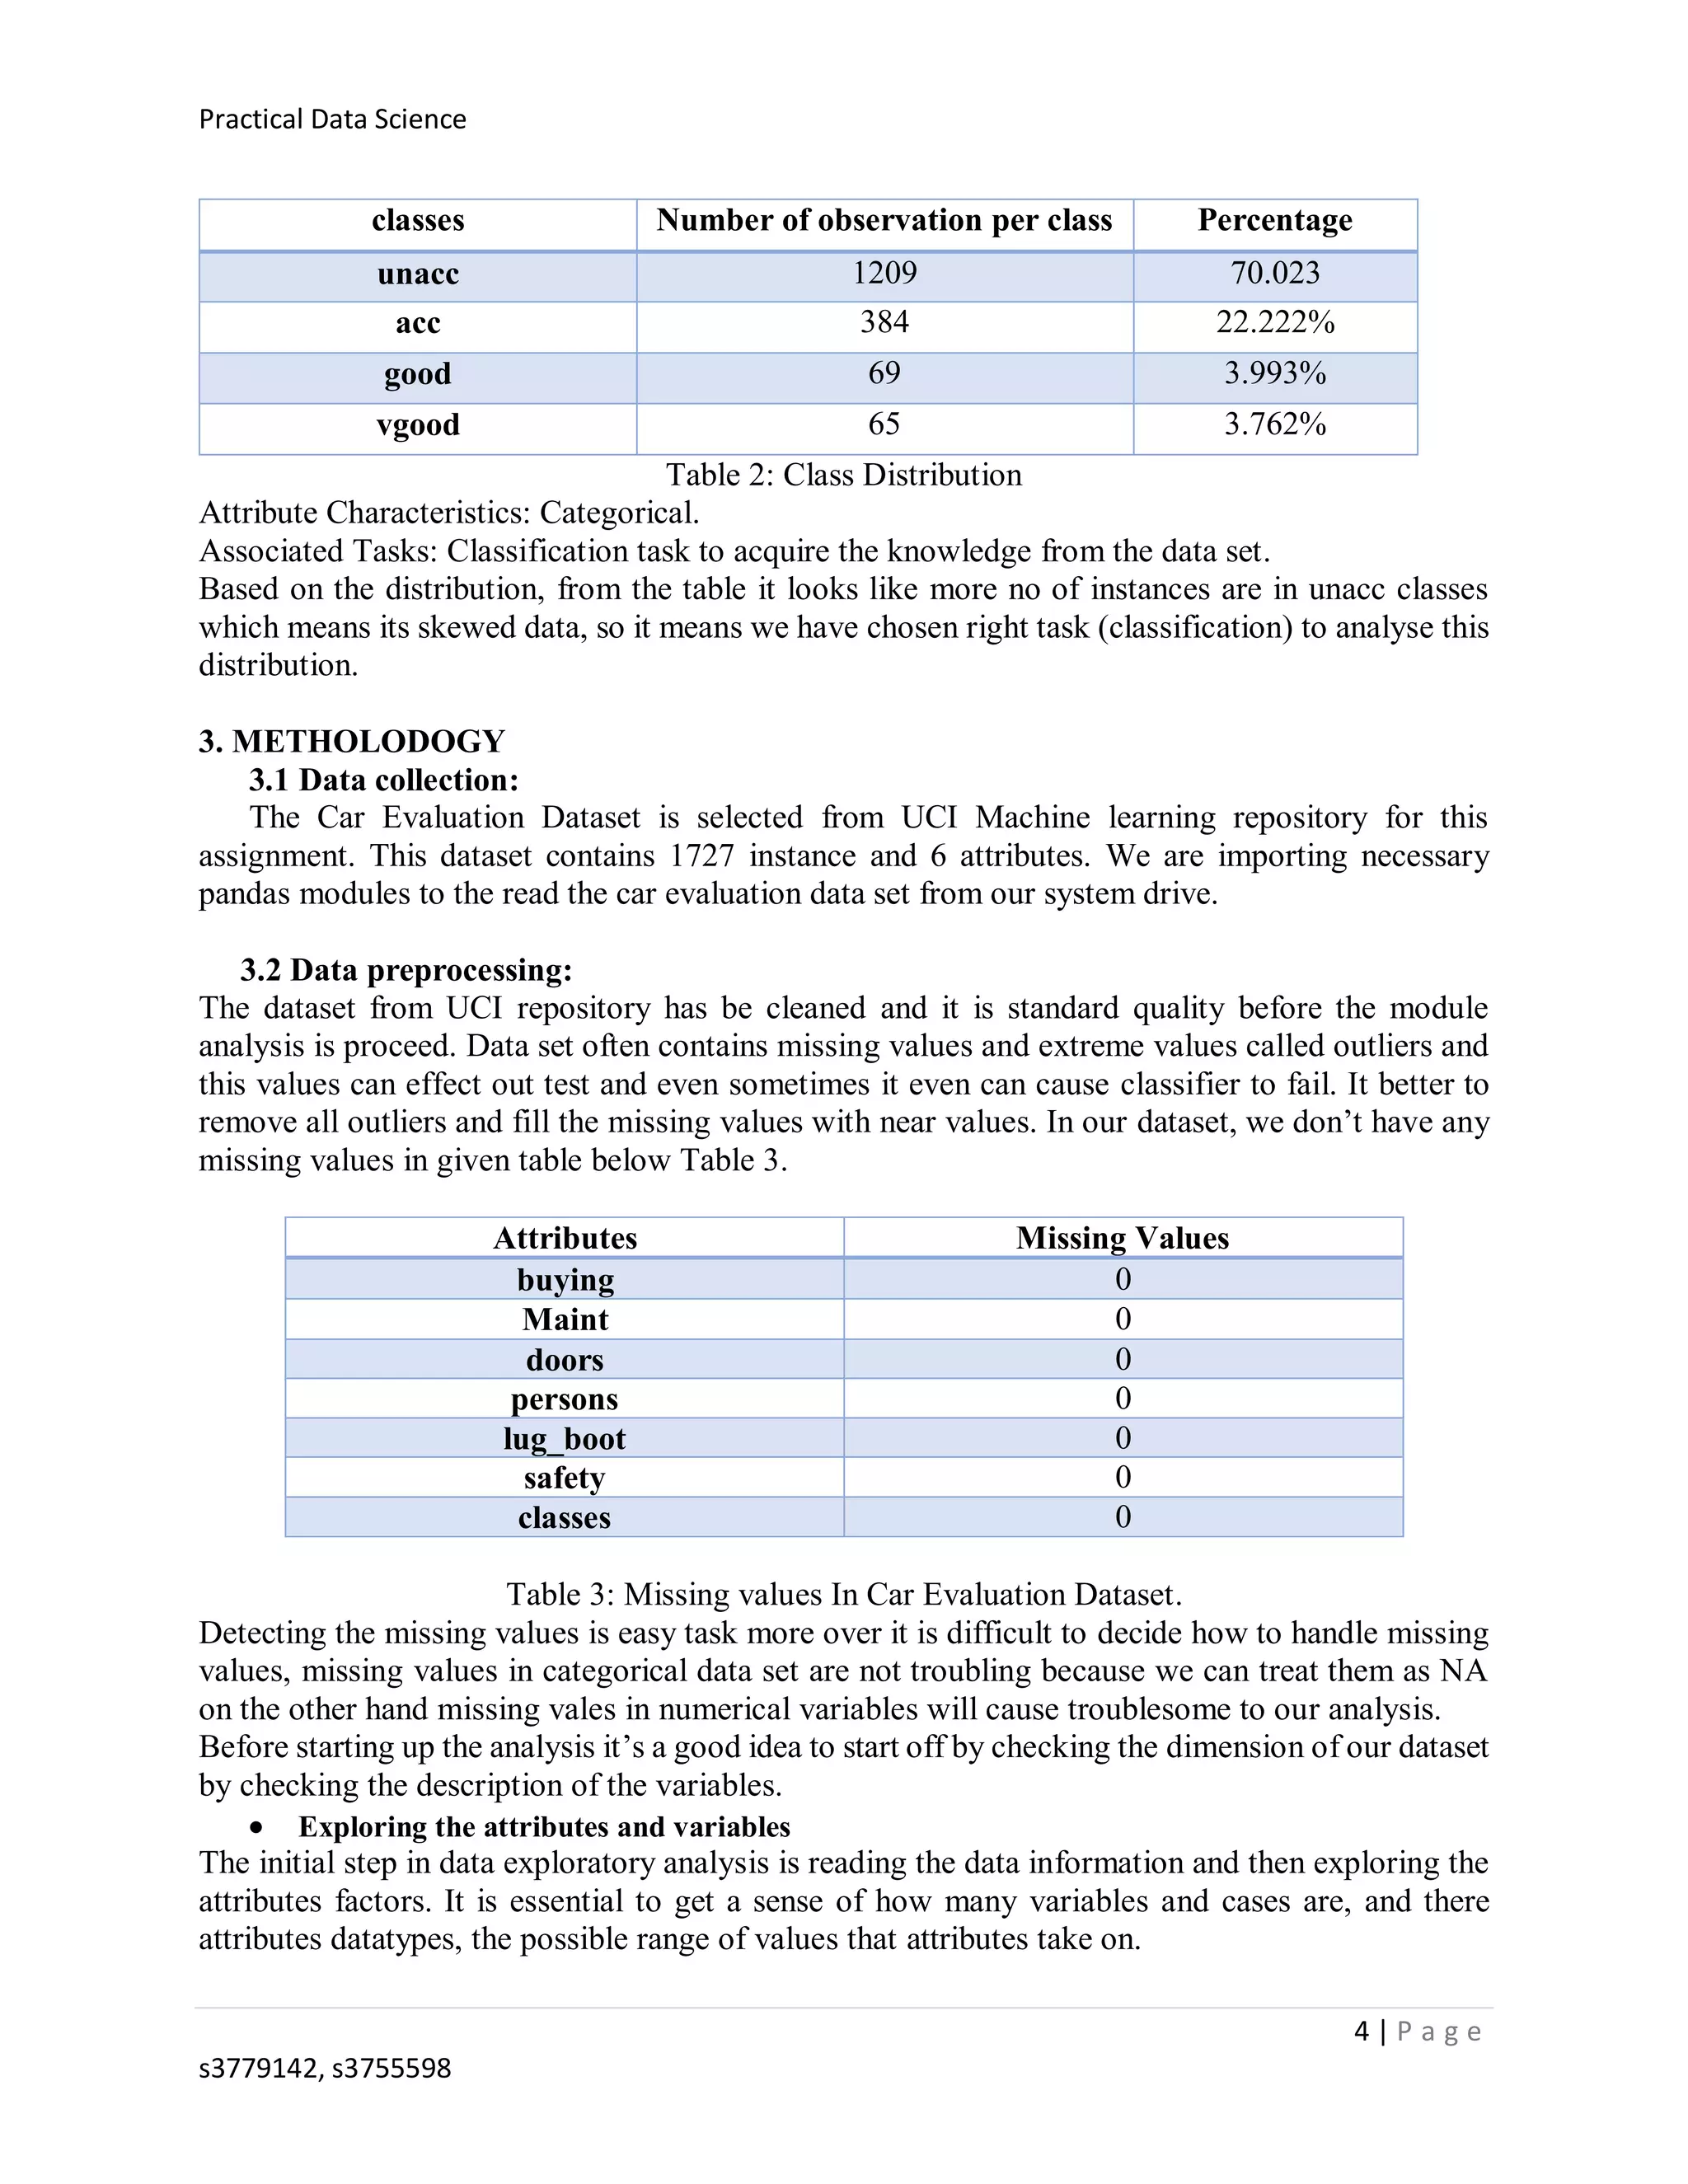
classes Number of observation per class Percentage
unacc 1209 70.023
acc 384 22.222%
good 69 3.993%
vgood 65 3.762%
Table 2: Class Distribution
Attribute Characteristics: Categorical.
Associated Tasks: Classification task to acquire the knowledge from the data set.
Based on the distribution, from the table it looks like more no of instances are in unacc classes
which means its skewed data, so it means we have chosen right task (classification) to analyse this
distribution.
3. METHOLODOGY
3.1 Data collection:
The Car Evaluation Dataset is selected from UCI Machine learning repository for this
assignment. This dataset contains 1727 instance and 6 attributes. We are importing necessary
pandas modules to the read the car evaluation data set from our system drive.
3.2 Data preprocessing:
The dataset from UCI repository has be cleaned and it is standard quality before the module
analysis is proceed. Data set often contains missing values and extreme values called outliers and
this values can effect out test and even sometimes it even can cause classifier to fail. It better to
remove all outliers and fill the missing values with near values. In our dataset, we don’t have any
missing values in given table below Table 3.
Attributes Missing Values
buying 0
Maint 0
doors 0
persons 0
lug_boot 0
safety 0
classes 0
Table 3: Missing values In Car Evaluation Dataset.
Detecting the missing values is easy task more over it is difficult to decide how to handle missing
values, missing values in categorical data set are not troubling because we can treat them as NA
on the other hand missing vales in numerical variables will cause troublesome to our analysis.
Before starting up the analysis it’s a good idea to start off by checking the dimension of our dataset
by checking the description of the variables.
 Exploring the attributes and variables
The initial step in data exploratory analysis is reading the data information and then exploring the
attributes factors. It is essential to get a sense of how many variables and cases are, and there
attributes datatypes, the possible range of values that attributes take on.
Practical Data Science
5 | P a g e
s3779142, s3755598
 Transforming the Variables (Data transformation)
When we first load the dataset , few variables may be encoded as datatypes and they doesn’t
fit well in our dataset for example Classes variable(Target variable) that indicates the
Unacceptable, acceptable, good and very good that only takes the values like 1, 2, 3 and 4.
Most of the variables are encoded as object type and in this data analysis all the variable holding
a categorical variables and the variables are in string format, to go further operation we need to
change the String type to integer type, more over this models requires the variables to be in integers
and we have converted by giving specified number to each variable (encoding).
3.3 Data exploration
Data exploration is a technique similar to data analysis where data is summarized in visual
exploration and the characteristics of data.
The data exploration includes following
 Univariate
Exploration and analyze of each variable.
 Bivariate
Exploration and analyze pair of variables and their relationship.
 Multivariate
Exploration of multiple variables in the data set.
Here we will check each feature with the classes with the distribution.
Classes
Classes distribution
which give the number of
count (unique values in
the column) vs the
classes.
From the give graph
result almost 70% of cars
are in classes
unacceptable (unacc),
which means it skewed
distribution.
In the above graph, from the out of total 1727 instances of car in the dataset 1209(70%) were
unacceptable, 384(22%) were acceptable, 69(3.9%) were in good and 65(3.7%) are in very good.
Practical Data Science
6 | P a g e
s3779142, s3755598
buying.
Buying histogram-
the distribution of
the classes(values)
trend to be
uniformly
distributed, while
very high and high
buying cost of a car
will probably made
a car be in
unaccepted.
maint (Maintenance).
From the maintenance
distribution with the very
high and high maintenance
price will probably made a
car be to unaccepted
doors.
Here, distribution of
each classes tend to
be uniformly
distributed of the
classes values
whereas 2 doors will
effect a car to be in
unaccepted classes.
Practical Data Science
7 | P a g e
s3779142, s3755598
persons.
In this persons distribution of
the classes, with 2 persons
capacity of the car it will be
unaccepted.
Car seating capacity is an
important factor for the
customers in accepting or
rejecting a car.
lug_boot(Luggage boot space).
In this luggage boot space in
the car distribution, where
small luggage boot is causing
the car to be in unaccepted.
Safety.
In this safety distribution of
the each classes it is seen that
normal distribution and low
safety will most likely caused
a car being unaccepted.
Safety is an important factor in terms of accepting or rejecting a car for customers.
Whereas low safety cars are not accepted by the customers. Where in measurement view of normal
distribution is a nature in practical real-world cases, then we can decide safety is the most important
features in our module analysis
Practical Data Science
8 | P a g e
s3779142, s3755598
Data exploration -Multivariate analysis.
As we encoded the string data (categorical data) to integer type, and our dataset doesn’t contain
continuous values. As our data set contains only 3 to 4 possible values for each variables in the
dataset. Hence diagram looks similar for all cases in our dataset.
3.4 Splitting of dataset and randomization.
Training and Testing:
In this assignment, we have divided the dataset into training set and testing set and the 3 splits
pairs used in this assignment on each classifier are show in the table 4.
Training and Testing %
split
50% 50%
60% 40%
80% 20%
Table 4: Training and Testing Split
Practical Data Science
9 | P a g e
s3779142, s3755598
3.5 Data modeling (classification)
The experiment is carried on using the classifiers models, those are K-nearest neighbors and
Decision trees. This experiment is to determine which classifier best suits for our data set in terms
of classifying the trained and tested set and also making prediction module obtained during the
training process. The detailed procedure of the experiment is below.
I. K-nearest neighbors
K-NN is a classifier which just finds the classes of the k-nearest neighbors (based on a distance
metric the shortest distance between the samples which is known as Euclidean) and then find the
classes in the larger part and assign that class to the test pattern. Knn module is a technique of
learning where a particular instance is mapped against many labels. Here we are pre-specifying
the labels to train our module.
power parameter, p=1 or 2.
 Manhattan distance.
For p = 1
if x=(a, b)x=(a, b) and y=(c, d)y=(c, d), the Manhattan distance between xx and yy is
|a−c|+|b−d||a−c|+|b−d|.
 Euclidean distance
For p = 2.
if x=(a, b)x=(a, b) and y=(c, d)y=(c, d), the Euclidean distance between xx and yy is
i. For 50% training set and 50% testing set
The data set has been divided into 50% train and 50% test set with instances of 863 and 864
respectively.
ii. For 60% training set and 40% testing set
The data set has been divided into 60% train and 40% test set with instances of 1036 and 691
respectively.
iii. For 80% training set and 20% testing set
The data set has been divided into 80% train and 20% test set with instances of 1381 and 346
respectively.
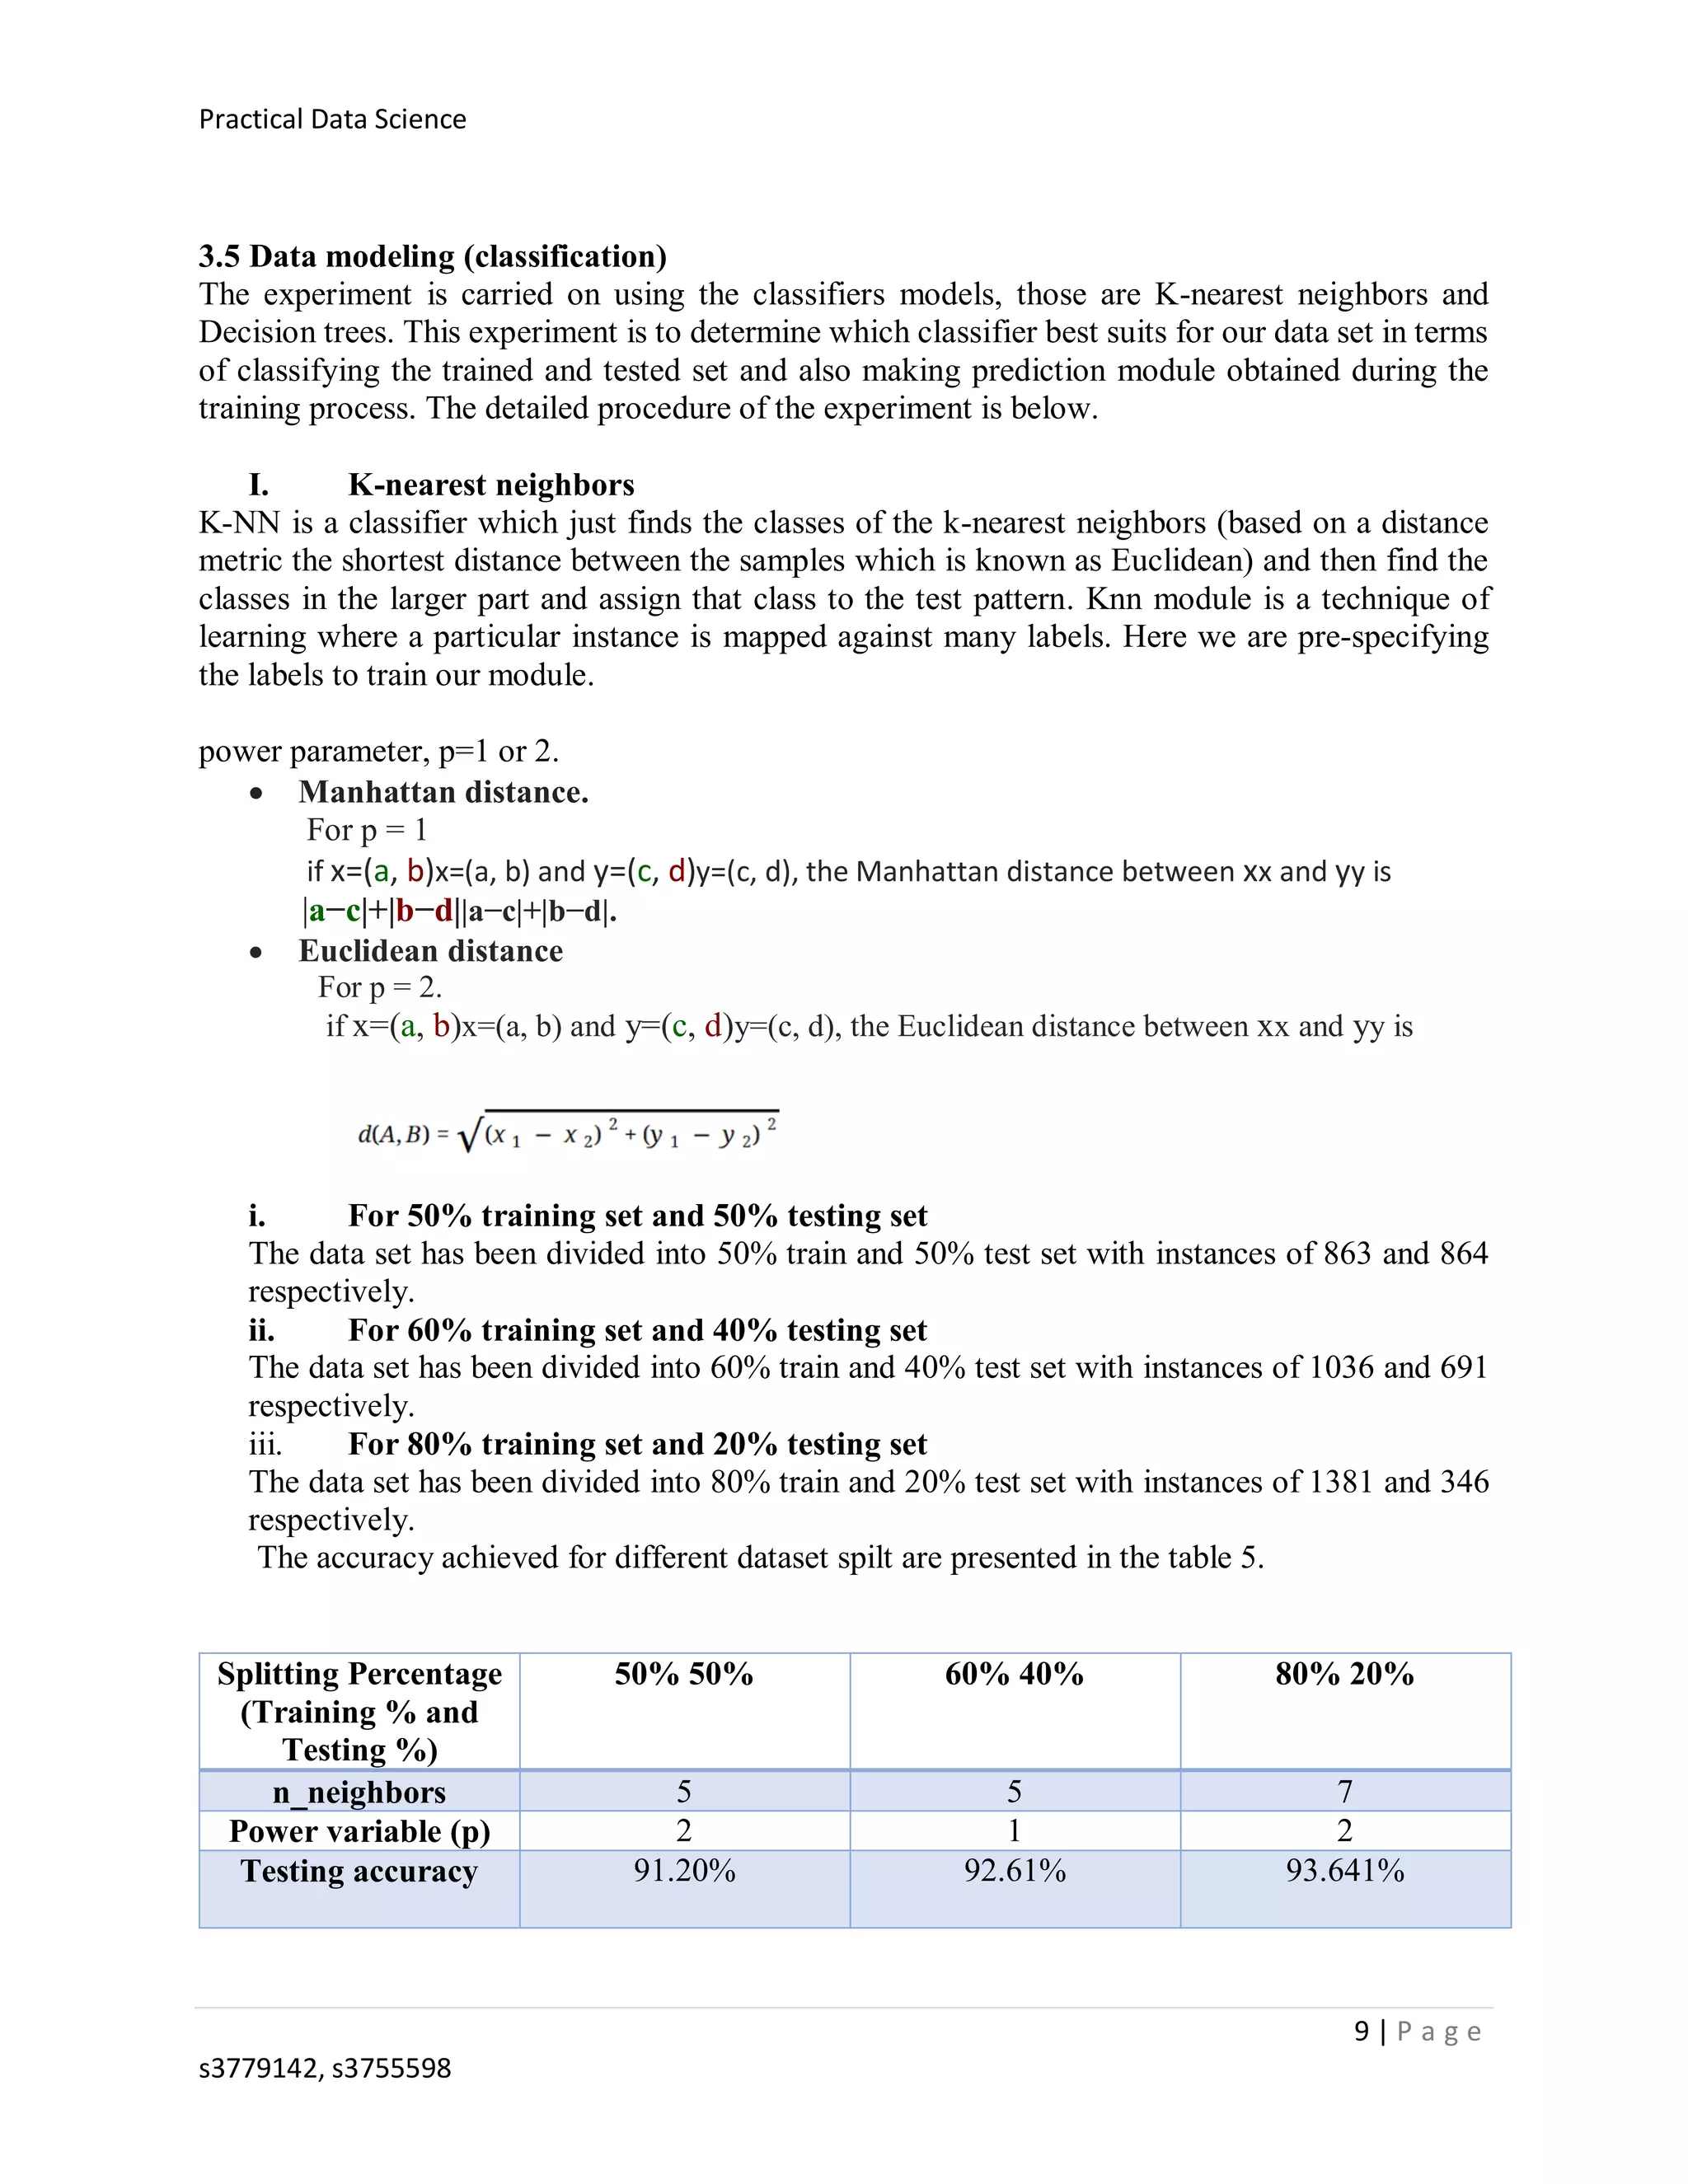
The accuracy achieved for different dataset spilt are presented in the table 5.
Splitting Percentage
(Training % and
Testing %)
50% 50% 60% 40% 80% 20%
n_neighbors 5 5 7
Power variable (p) 2 1 2
Testing accuracy 91.20% 92.61% 93.641%
Practical Data Science
10 | P a g e
s3779142, s3755598
Classification error
rate
8.79% 7.38% 6.35%
Confusion Matrix [[577 6 3 0]
[ 46 167 3 3]
[ 4 3 21 1]
[ 1 2 4 23]]
[[459 4 2 0]
[ 28 148 3 0]
[ 3 5 15 0]
[ 1 5 0 18]]
[[231 2 1 0]
[ 14 73 0 0]
[ 1 1 10 0]
[ 0 2 1 10]]
precision 0.846 0.899 0.927
recall 0.809 0.804 0.857
f1 score: 0.824 0.845 0.887
Table 5: Accuracy test for K nearest neighbor
From the output for KNN classifier, we can say that the split 80% 20% train and test dataset
gives us the best accuracy when compared to other splitting ratio.
II. Decision trees
Decision tree is a module that uses a tree-like-graph or module of condition of decisions and their
possible consequences. It is one approach to display an algorithm that contains only conditional
control statements.
It follows a flowchart like structure in each internal node that is condition on each attribute, each
branch represents the outcome of the condition, and each leaf node represents a class table. The
top down approach from the root to the leaf represents classification rule.
Root Node: This Node represents the total population (instances) and furthers breakdown into
branches class sub-nodes based the conditions.
Decision node: When a sub node gets divided into further sub nodes then its called decision
node.
Leaf node:When node cannot spilt further into sub nodes.
i. For 50% training set and 50% testing set
The data set has been divided into 50% train and 50% test set with instances of 863 and 864
respectively.
i. For 60% training set and 40% testing set
The data set has been divided into 60% train and 40% test set with instances of 1036 and 691
respectively.
ii. For 80% training set and 20% testing set
The data set has been divided into 80% train and 20% test set with instances of 1381 and 346
respectively.
The accuracy achieved for different dataset spilt are presented in the table 6.
Practical Data Science
11 | P a g e
s3779142, s3755598
Decision tree max_depth=6
Splitting Percentage
(Training % and
Testing %)
50% 50% 60% 40% 80% 20%
Testing accuracy 92.24% 93.19% 93.641%
Classification error
rate
7.75% 6.80% 6.35%
Confusion Matrix [[568 16 2 0]
[ 16 179 21 3]
[ 0 0 24 5]
[ 0 4 0 26]]
[[449 14 2 0]
[ 2 156 18 3]
[ 0 0 19 4]
[ 0 4 0 20]]
[[224 9 1 0]
[ 1 78 7 1]
[ 0 0 11 1]
[ 0 2 0 11]]
precision 0.786 0.780 0.824
recall 0.870 0.874 0.904
f1 score 0.817 0.815 0.854
Table 6: Accuracy test for decision tree
From the output for Decision tree classifier, we can say that the split 80% 20% train and test
dataset gives us the best accuracy when compared to other splitting ratio.
4. RESULTS
The presentation of the results is based on following model analysis. To get better understand of
the module we also used another measurement precision, recall, f1 score. In this analysis our
splitting ration of k nearest neighbor 80% 20% seems good enough at its performance.
For 80% 20%
n_neighbour= 7 , p= 2
Testing
accuracy
Classification
error rate
Confusion Matrix precision recall f1 score:
93.641% 6.35% [[231 2 1 0]
[ 14 73 0 0]
[ 1 1 10 0]
[ 0 2 1 10]]
0.927 0.857 0.887
Table 5.a: Accuracy results for K nearest neighbor
For 80% and 20%
Max_depth= 6
Testing
accuracy
Classification
error rate
Confusion Matrix precision recall f1 score:
93.641% 6.35% [[224 9 1 0]
[ 1 78 7 1]
[ 0 0 11 1]
[ 0 2 0 11]]
0.824 0.904 0.854
Table 6.a: Accuracy results for K nearest neighbor
Practical Data Science
12 | P a g e
s3779142, s3755598
5. DISCUSSION
 Safety and person’s capacity are main factors in rejecting the car classes as unacceptable.
 The splitting of data set from the two comparison shows that K nearest neighbor and
decision tree have exactly same accuracy(93.64%) across the data split ratio (80:20).
 F1 score is combination of precision and recall then we can say that f1 score is used to
measure our model performance.
 Also, it is seen that decision trees has less f1 score even though k nearest neighbor and
decision tree have same accuracy.
 Here with the data split with 80-20 both the modules k-nearest neighbor and decision
tree have same accuracy but accuracy can’t be the fair criteria to determine unbalanced
classification so let’s check with f1 score and k-nearest neighbor with 80-20 have highest
0.88 when compared to decision tree f1 of 0.85.
 To provide a distinction between two classifiers and their performance, comparing the
results of two classifiers are show in the table 5.a and table 6.a, table under the result.
6. CONLUSION
The comparison analysis for the classifiers used in this assignment show that K nearest neighbor
and Decision tree have same performance in terms of accuracy. However, in terms of f1 score k
nearest neighbor seems to be best compared to decision tree.
7. REFERENCES
1. https://towardsdatascience.com/decision-trees-in-machine-learning-641b9c4e8052
2. https://scikit-learn.org/stable/modules/generated/sklearn.tree.DecisionTreeClassifier.html
3. https://kevinzakka.github.io/2016/07/13/k-nearest-neighbor/
4. https://www.analyticsvidhya.com/blog/2016/01/guide-data-exploration/
5. https://archive.ics.uci.edu/ml/datasets/Car+Evaluation
6. https://www.dataquest.io/blog/sci-kit-learn-tutorial/
7. https://towardsdatascience.com/machine-learning-general-process-8f1b510bd8af
8. http://kt.ijs.si/MarkoBohanec/pub/Avignon88.pdf

More Related Content

What's hot

K nearest neighbor
K nearest neighborK nearest neighbor
K nearest neighborUjjawal
 
Introduction to Machine Learning with SciKit-Learn
Introduction to Machine Learning with SciKit-LearnIntroduction to Machine Learning with SciKit-Learn
Introduction to Machine Learning with SciKit-LearnBenjamin Bengfort
 
CSA 3702 machine learning module 3
CSA 3702 machine learning module 3CSA 3702 machine learning module 3
CSA 3702 machine learning module 3Nandhini S
 
Introduction to Machine Learning
Introduction to Machine LearningIntroduction to Machine Learning
Introduction to Machine Learningshivani saluja
 
Recommendation system
Recommendation system Recommendation system
Recommendation system Vikrant Arya
 
What is the Multinomial-Logistic Regression Classification Algorithm and How ...
What is the Multinomial-Logistic Regression Classification Algorithm and How ...What is the Multinomial-Logistic Regression Classification Algorithm and How ...
What is the Multinomial-Logistic Regression Classification Algorithm and How ...Smarten Augmented Analytics
 
Fake Product Review Monitoring System
Fake Product Review Monitoring SystemFake Product Review Monitoring System
Fake Product Review Monitoring Systemijtsrd
 
Feature selection
Feature selectionFeature selection
Feature selectiondkpawar
 
Heart disease prediction system
Heart disease prediction systemHeart disease prediction system
Heart disease prediction systemSWAMI06
 
Collaborative Filtering Recommendation System
Collaborative Filtering Recommendation SystemCollaborative Filtering Recommendation System
Collaborative Filtering Recommendation SystemMilind Gokhale
 
Classification Based Machine Learning Algorithms
Classification Based Machine Learning AlgorithmsClassification Based Machine Learning Algorithms
Classification Based Machine Learning AlgorithmsMd. Main Uddin Rony
 
Lecture 19 sma star algorithm
Lecture 19 sma star algorithmLecture 19 sma star algorithm
Lecture 19 sma star algorithmHema Kashyap
 
Machine Learning in Cybersecurity.pdf
Machine Learning in Cybersecurity.pdfMachine Learning in Cybersecurity.pdf
Machine Learning in Cybersecurity.pdfWaiYipLiew
 
2.8 accuracy and ensemble methods
2.8 accuracy and ensemble methods2.8 accuracy and ensemble methods
2.8 accuracy and ensemble methodsKrish_ver2
 
Loan approval prediction based on machine learning approach
Loan approval prediction based on machine learning approachLoan approval prediction based on machine learning approach
Loan approval prediction based on machine learning approachEslam Nader
 

What's hot (20)

K nearest neighbor
K nearest neighborK nearest neighbor
K nearest neighbor
 
Introduction to Machine Learning with SciKit-Learn
Introduction to Machine Learning with SciKit-LearnIntroduction to Machine Learning with SciKit-Learn
Introduction to Machine Learning with SciKit-Learn
 
Housing price prediction
Housing price predictionHousing price prediction
Housing price prediction
 
CSA 3702 machine learning module 3
CSA 3702 machine learning module 3CSA 3702 machine learning module 3
CSA 3702 machine learning module 3
 
Introduction to Machine Learning
Introduction to Machine LearningIntroduction to Machine Learning
Introduction to Machine Learning
 
Recommendation system
Recommendation system Recommendation system
Recommendation system
 
What is the Multinomial-Logistic Regression Classification Algorithm and How ...
What is the Multinomial-Logistic Regression Classification Algorithm and How ...What is the Multinomial-Logistic Regression Classification Algorithm and How ...
What is the Multinomial-Logistic Regression Classification Algorithm and How ...
 
Decision tree
Decision treeDecision tree
Decision tree
 
Fake Product Review Monitoring System
Fake Product Review Monitoring SystemFake Product Review Monitoring System
Fake Product Review Monitoring System
 
Data cleaning-outlier-detection
Data cleaning-outlier-detectionData cleaning-outlier-detection
Data cleaning-outlier-detection
 
Feature selection
Feature selectionFeature selection
Feature selection
 
Heart disease prediction system
Heart disease prediction systemHeart disease prediction system
Heart disease prediction system
 
Collaborative Filtering Recommendation System
Collaborative Filtering Recommendation SystemCollaborative Filtering Recommendation System
Collaborative Filtering Recommendation System
 
Data Mining: Outlier analysis
Data Mining: Outlier analysisData Mining: Outlier analysis
Data Mining: Outlier analysis
 
Classification Based Machine Learning Algorithms
Classification Based Machine Learning AlgorithmsClassification Based Machine Learning Algorithms
Classification Based Machine Learning Algorithms
 
Lecture 19 sma star algorithm
Lecture 19 sma star algorithmLecture 19 sma star algorithm
Lecture 19 sma star algorithm
 
Machine Learning in Cybersecurity.pdf
Machine Learning in Cybersecurity.pdfMachine Learning in Cybersecurity.pdf
Machine Learning in Cybersecurity.pdf
 
Artificial Intelligence
Artificial IntelligenceArtificial Intelligence
Artificial Intelligence
 
2.8 accuracy and ensemble methods
2.8 accuracy and ensemble methods2.8 accuracy and ensemble methods
2.8 accuracy and ensemble methods
 
Loan approval prediction based on machine learning approach
Loan approval prediction based on machine learning approachLoan approval prediction based on machine learning approach
Loan approval prediction based on machine learning approach
 

Similar to CAR EVALUATION DATABASE

Open06
Open06Open06
Open06butest
 
IRJET- Prediction of Crime Rate Analysis using Supervised Classification Mach...
IRJET- Prediction of Crime Rate Analysis using Supervised Classification Mach...IRJET- Prediction of Crime Rate Analysis using Supervised Classification Mach...
IRJET- Prediction of Crime Rate Analysis using Supervised Classification Mach...IRJET Journal
 
THE IMPLICATION OF STATISTICAL ANALYSIS AND FEATURE ENGINEERING FOR MODEL BUI...
THE IMPLICATION OF STATISTICAL ANALYSIS AND FEATURE ENGINEERING FOR MODEL BUI...THE IMPLICATION OF STATISTICAL ANALYSIS AND FEATURE ENGINEERING FOR MODEL BUI...
THE IMPLICATION OF STATISTICAL ANALYSIS AND FEATURE ENGINEERING FOR MODEL BUI...ijcseit
 
THE IMPLICATION OF STATISTICAL ANALYSIS AND FEATURE ENGINEERING FOR MODEL BUI...
THE IMPLICATION OF STATISTICAL ANALYSIS AND FEATURE ENGINEERING FOR MODEL BUI...THE IMPLICATION OF STATISTICAL ANALYSIS AND FEATURE ENGINEERING FOR MODEL BUI...
THE IMPLICATION OF STATISTICAL ANALYSIS AND FEATURE ENGINEERING FOR MODEL BUI...IJCSES Journal
 
IRJET- Sentimental Analysis for Online Reviews using Machine Learning Algorithms
IRJET- Sentimental Analysis for Online Reviews using Machine Learning AlgorithmsIRJET- Sentimental Analysis for Online Reviews using Machine Learning Algorithms
IRJET- Sentimental Analysis for Online Reviews using Machine Learning AlgorithmsIRJET Journal
 
IRJET- Study and Evaluation of Classification Algorithms in Data Mining
IRJET- Study and Evaluation of Classification Algorithms in Data MiningIRJET- Study and Evaluation of Classification Algorithms in Data Mining
IRJET- Study and Evaluation of Classification Algorithms in Data MiningIRJET Journal
 
Black_Friday_Sales_Trushita
Black_Friday_Sales_TrushitaBlack_Friday_Sales_Trushita
Black_Friday_Sales_TrushitaTrushita Redij
 
V2 i9 ijertv2is90699-1
V2 i9 ijertv2is90699-1V2 i9 ijertv2is90699-1
V2 i9 ijertv2is90699-1warishali570
 
Data Analytics Using R - Report
Data Analytics Using R - ReportData Analytics Using R - Report
Data Analytics Using R - ReportAkanksha Gohil
 
EE660 Project_sl_final
EE660 Project_sl_finalEE660 Project_sl_final
EE660 Project_sl_finalShanglin Yang
 
IRJET- A Detailed Study on Classification Techniques for Data Mining
IRJET- A Detailed Study on Classification Techniques for Data MiningIRJET- A Detailed Study on Classification Techniques for Data Mining
IRJET- A Detailed Study on Classification Techniques for Data MiningIRJET Journal
 
Survey paper on Big Data Imputation and Privacy Algorithms
Survey paper on Big Data Imputation and Privacy AlgorithmsSurvey paper on Big Data Imputation and Privacy Algorithms
Survey paper on Big Data Imputation and Privacy AlgorithmsIRJET Journal
 
Proposing an Appropriate Pattern for Car Detection by Using Intelligent Algor...
Proposing an Appropriate Pattern for Car Detection by Using Intelligent Algor...Proposing an Appropriate Pattern for Car Detection by Using Intelligent Algor...
Proposing an Appropriate Pattern for Car Detection by Using Intelligent Algor...Editor IJCATR
 
A02610104
A02610104A02610104
A02610104theijes
 
ITB Term Paper - 10BM60066
ITB Term Paper - 10BM60066ITB Term Paper - 10BM60066
ITB Term Paper - 10BM60066rahulsm27
 
Review of Algorithms for Crime Analysis & Prediction
Review of Algorithms for Crime Analysis & PredictionReview of Algorithms for Crime Analysis & Prediction
Review of Algorithms for Crime Analysis & PredictionIRJET Journal
 
Paper-Allstate-Claim-Severity
Paper-Allstate-Claim-SeverityPaper-Allstate-Claim-Severity
Paper-Allstate-Claim-SeverityGon-soo Moon
 
Profile Analysis of Users in Data Analytics Domain
Profile Analysis of   Users in Data Analytics DomainProfile Analysis of   Users in Data Analytics Domain
Profile Analysis of Users in Data Analytics DomainDrjabez
 
Sentiment Analysis: A comparative study of Deep Learning and Machine Learning
Sentiment Analysis: A comparative study of Deep Learning and Machine LearningSentiment Analysis: A comparative study of Deep Learning and Machine Learning
Sentiment Analysis: A comparative study of Deep Learning and Machine LearningIRJET Journal
 

Similar to CAR EVALUATION DATABASE (20)

Open06
Open06Open06
Open06
 
IRJET- Prediction of Crime Rate Analysis using Supervised Classification Mach...
IRJET- Prediction of Crime Rate Analysis using Supervised Classification Mach...IRJET- Prediction of Crime Rate Analysis using Supervised Classification Mach...
IRJET- Prediction of Crime Rate Analysis using Supervised Classification Mach...
 
THE IMPLICATION OF STATISTICAL ANALYSIS AND FEATURE ENGINEERING FOR MODEL BUI...
THE IMPLICATION OF STATISTICAL ANALYSIS AND FEATURE ENGINEERING FOR MODEL BUI...THE IMPLICATION OF STATISTICAL ANALYSIS AND FEATURE ENGINEERING FOR MODEL BUI...
THE IMPLICATION OF STATISTICAL ANALYSIS AND FEATURE ENGINEERING FOR MODEL BUI...
 
THE IMPLICATION OF STATISTICAL ANALYSIS AND FEATURE ENGINEERING FOR MODEL BUI...
THE IMPLICATION OF STATISTICAL ANALYSIS AND FEATURE ENGINEERING FOR MODEL BUI...THE IMPLICATION OF STATISTICAL ANALYSIS AND FEATURE ENGINEERING FOR MODEL BUI...
THE IMPLICATION OF STATISTICAL ANALYSIS AND FEATURE ENGINEERING FOR MODEL BUI...
 
IRJET- Sentimental Analysis for Online Reviews using Machine Learning Algorithms
IRJET- Sentimental Analysis for Online Reviews using Machine Learning AlgorithmsIRJET- Sentimental Analysis for Online Reviews using Machine Learning Algorithms
IRJET- Sentimental Analysis for Online Reviews using Machine Learning Algorithms
 
IRJET- Study and Evaluation of Classification Algorithms in Data Mining
IRJET- Study and Evaluation of Classification Algorithms in Data MiningIRJET- Study and Evaluation of Classification Algorithms in Data Mining
IRJET- Study and Evaluation of Classification Algorithms in Data Mining
 
Black_Friday_Sales_Trushita
Black_Friday_Sales_TrushitaBlack_Friday_Sales_Trushita
Black_Friday_Sales_Trushita
 
V2 i9 ijertv2is90699-1
V2 i9 ijertv2is90699-1V2 i9 ijertv2is90699-1
V2 i9 ijertv2is90699-1
 
Data Analytics Using R - Report
Data Analytics Using R - ReportData Analytics Using R - Report
Data Analytics Using R - Report
 
EE660 Project_sl_final
EE660 Project_sl_finalEE660 Project_sl_final
EE660 Project_sl_final
 
IRJET- A Detailed Study on Classification Techniques for Data Mining
IRJET- A Detailed Study on Classification Techniques for Data MiningIRJET- A Detailed Study on Classification Techniques for Data Mining
IRJET- A Detailed Study on Classification Techniques for Data Mining
 
Survey paper on Big Data Imputation and Privacy Algorithms
Survey paper on Big Data Imputation and Privacy AlgorithmsSurvey paper on Big Data Imputation and Privacy Algorithms
Survey paper on Big Data Imputation and Privacy Algorithms
 
Proposing an Appropriate Pattern for Car Detection by Using Intelligent Algor...
Proposing an Appropriate Pattern for Car Detection by Using Intelligent Algor...Proposing an Appropriate Pattern for Car Detection by Using Intelligent Algor...
Proposing an Appropriate Pattern for Car Detection by Using Intelligent Algor...
 
A02610104
A02610104A02610104
A02610104
 
ITB Term Paper - 10BM60066
ITB Term Paper - 10BM60066ITB Term Paper - 10BM60066
ITB Term Paper - 10BM60066
 
Review of Algorithms for Crime Analysis & Prediction
Review of Algorithms for Crime Analysis & PredictionReview of Algorithms for Crime Analysis & Prediction
Review of Algorithms for Crime Analysis & Prediction
 
Machine Learning.pptx
Machine Learning.pptxMachine Learning.pptx
Machine Learning.pptx
 
Paper-Allstate-Claim-Severity
Paper-Allstate-Claim-SeverityPaper-Allstate-Claim-Severity
Paper-Allstate-Claim-Severity
 
Profile Analysis of Users in Data Analytics Domain
Profile Analysis of   Users in Data Analytics DomainProfile Analysis of   Users in Data Analytics Domain
Profile Analysis of Users in Data Analytics Domain
 
Sentiment Analysis: A comparative study of Deep Learning and Machine Learning
Sentiment Analysis: A comparative study of Deep Learning and Machine LearningSentiment Analysis: A comparative study of Deep Learning and Machine Learning
Sentiment Analysis: A comparative study of Deep Learning and Machine Learning
 

Recently uploaded

Accredited-Transport-Cooperatives-Jan-2021-Web.pdf
Accredited-Transport-Cooperatives-Jan-2021-Web.pdfAccredited-Transport-Cooperatives-Jan-2021-Web.pdf
Accredited-Transport-Cooperatives-Jan-2021-Web.pdfadriantubila
 
VidaXL dropshipping via API with DroFx.pptx
VidaXL dropshipping via API with DroFx.pptxVidaXL dropshipping via API with DroFx.pptx
VidaXL dropshipping via API with DroFx.pptxolyaivanovalion
 
Discover Why Less is More in B2B Research
Discover Why Less is More in B2B ResearchDiscover Why Less is More in B2B Research
Discover Why Less is More in B2B Researchmichael115558
 
Call Girls Hsr Layout Just Call 👗 7737669865 👗 Top Class Call Girl Service Ba...
Call Girls Hsr Layout Just Call 👗 7737669865 👗 Top Class Call Girl Service Ba...Call Girls Hsr Layout Just Call 👗 7737669865 👗 Top Class Call Girl Service Ba...
Call Girls Hsr Layout Just Call 👗 7737669865 👗 Top Class Call Girl Service Ba...amitlee9823
 
Invezz.com - Grow your wealth with trading signals
Invezz.com - Grow your wealth with trading signalsInvezz.com - Grow your wealth with trading signals
Invezz.com - Grow your wealth with trading signalsInvezz1
 
Generative AI on Enterprise Cloud with NiFi and Milvus
Generative AI on Enterprise Cloud with NiFi and MilvusGenerative AI on Enterprise Cloud with NiFi and Milvus
Generative AI on Enterprise Cloud with NiFi and MilvusTimothy Spann
 
Week-01-2.ppt BBB human Computer interaction
Week-01-2.ppt BBB human Computer interactionWeek-01-2.ppt BBB human Computer interaction
Week-01-2.ppt BBB human Computer interactionfulawalesam
 
April 2024 - Crypto Market Report's Analysis
April 2024 - Crypto Market Report's AnalysisApril 2024 - Crypto Market Report's Analysis
April 2024 - Crypto Market Report's Analysismanisha194592
 
Capstone Project on IBM Data Analytics Program
Capstone Project on IBM Data Analytics ProgramCapstone Project on IBM Data Analytics Program
Capstone Project on IBM Data Analytics ProgramMoniSankarHazra
 
Call Girls in Sarai Kale Khan Delhi 💯 Call Us 🔝9205541914 🔝( Delhi) Escorts S...
Call Girls in Sarai Kale Khan Delhi 💯 Call Us 🔝9205541914 🔝( Delhi) Escorts S...Call Girls in Sarai Kale Khan Delhi 💯 Call Us 🔝9205541914 🔝( Delhi) Escorts S...
Call Girls in Sarai Kale Khan Delhi 💯 Call Us 🔝9205541914 🔝( Delhi) Escorts S...Delhi Call girls
 
Vip Mumbai Call Girls Thane West Call On 9920725232 With Body to body massage...
Vip Mumbai Call Girls Thane West Call On 9920725232 With Body to body massage...Vip Mumbai Call Girls Thane West Call On 9920725232 With Body to body massage...
Vip Mumbai Call Girls Thane West Call On 9920725232 With Body to body massage...amitlee9823
 
Digital Advertising Lecture for Advanced Digital & Social Media Strategy at U...
Digital Advertising Lecture for Advanced Digital & Social Media Strategy at U...Digital Advertising Lecture for Advanced Digital & Social Media Strategy at U...
Digital Advertising Lecture for Advanced Digital & Social Media Strategy at U...Valters Lauzums
 
Call me @ 9892124323 Cheap Rate Call Girls in Vashi with Real Photo 100% Secure
Call me @ 9892124323  Cheap Rate Call Girls in Vashi with Real Photo 100% SecureCall me @ 9892124323  Cheap Rate Call Girls in Vashi with Real Photo 100% Secure
Call me @ 9892124323 Cheap Rate Call Girls in Vashi with Real Photo 100% SecurePooja Nehwal
 
Junnasandra Call Girls: 🍓 7737669865 🍓 High Profile Model Escorts | Bangalore...
Junnasandra Call Girls: 🍓 7737669865 🍓 High Profile Model Escorts | Bangalore...Junnasandra Call Girls: 🍓 7737669865 🍓 High Profile Model Escorts | Bangalore...
Junnasandra Call Girls: 🍓 7737669865 🍓 High Profile Model Escorts | Bangalore...amitlee9823
 
Al Barsha Escorts $#$ O565212860 $#$ Escort Service In Al Barsha
Al Barsha Escorts $#$ O565212860 $#$ Escort Service In Al BarshaAl Barsha Escorts $#$ O565212860 $#$ Escort Service In Al Barsha
Al Barsha Escorts $#$ O565212860 $#$ Escort Service In Al BarshaAroojKhan71
 
Chintamani Call Girls: 🍓 7737669865 🍓 High Profile Model Escorts | Bangalore ...
Chintamani Call Girls: 🍓 7737669865 🍓 High Profile Model Escorts | Bangalore ...Chintamani Call Girls: 🍓 7737669865 🍓 High Profile Model Escorts | Bangalore ...
Chintamani Call Girls: 🍓 7737669865 🍓 High Profile Model Escorts | Bangalore ...amitlee9823
 

Recently uploaded (20)

Accredited-Transport-Cooperatives-Jan-2021-Web.pdf
Accredited-Transport-Cooperatives-Jan-2021-Web.pdfAccredited-Transport-Cooperatives-Jan-2021-Web.pdf
Accredited-Transport-Cooperatives-Jan-2021-Web.pdf
 
VidaXL dropshipping via API with DroFx.pptx
VidaXL dropshipping via API with DroFx.pptxVidaXL dropshipping via API with DroFx.pptx
VidaXL dropshipping via API with DroFx.pptx
 
Predicting Loan Approval: A Data Science Project
Predicting Loan Approval: A Data Science ProjectPredicting Loan Approval: A Data Science Project
Predicting Loan Approval: A Data Science Project
 
Discover Why Less is More in B2B Research
Discover Why Less is More in B2B ResearchDiscover Why Less is More in B2B Research
Discover Why Less is More in B2B Research
 
Call Girls Hsr Layout Just Call 👗 7737669865 👗 Top Class Call Girl Service Ba...
Call Girls Hsr Layout Just Call 👗 7737669865 👗 Top Class Call Girl Service Ba...Call Girls Hsr Layout Just Call 👗 7737669865 👗 Top Class Call Girl Service Ba...
Call Girls Hsr Layout Just Call 👗 7737669865 👗 Top Class Call Girl Service Ba...
 
Invezz.com - Grow your wealth with trading signals
Invezz.com - Grow your wealth with trading signalsInvezz.com - Grow your wealth with trading signals
Invezz.com - Grow your wealth with trading signals
 
Generative AI on Enterprise Cloud with NiFi and Milvus
Generative AI on Enterprise Cloud with NiFi and MilvusGenerative AI on Enterprise Cloud with NiFi and Milvus
Generative AI on Enterprise Cloud with NiFi and Milvus
 
Week-01-2.ppt BBB human Computer interaction
Week-01-2.ppt BBB human Computer interactionWeek-01-2.ppt BBB human Computer interaction
Week-01-2.ppt BBB human Computer interaction
 
April 2024 - Crypto Market Report's Analysis
April 2024 - Crypto Market Report's AnalysisApril 2024 - Crypto Market Report's Analysis
April 2024 - Crypto Market Report's Analysis
 
Capstone Project on IBM Data Analytics Program
Capstone Project on IBM Data Analytics ProgramCapstone Project on IBM Data Analytics Program
Capstone Project on IBM Data Analytics Program
 
Sampling (random) method and Non random.ppt
Sampling (random) method and Non random.pptSampling (random) method and Non random.ppt
Sampling (random) method and Non random.ppt
 
Call Girls in Sarai Kale Khan Delhi 💯 Call Us 🔝9205541914 🔝( Delhi) Escorts S...
Call Girls in Sarai Kale Khan Delhi 💯 Call Us 🔝9205541914 🔝( Delhi) Escorts S...Call Girls in Sarai Kale Khan Delhi 💯 Call Us 🔝9205541914 🔝( Delhi) Escorts S...
Call Girls in Sarai Kale Khan Delhi 💯 Call Us 🔝9205541914 🔝( Delhi) Escorts S...
 
CHEAP Call Girls in Saket (-DELHI )🔝 9953056974🔝(=)/CALL GIRLS SERVICE
CHEAP Call Girls in Saket (-DELHI )🔝 9953056974🔝(=)/CALL GIRLS SERVICECHEAP Call Girls in Saket (-DELHI )🔝 9953056974🔝(=)/CALL GIRLS SERVICE
CHEAP Call Girls in Saket (-DELHI )🔝 9953056974🔝(=)/CALL GIRLS SERVICE
 
Vip Mumbai Call Girls Thane West Call On 9920725232 With Body to body massage...
Vip Mumbai Call Girls Thane West Call On 9920725232 With Body to body massage...Vip Mumbai Call Girls Thane West Call On 9920725232 With Body to body massage...
Vip Mumbai Call Girls Thane West Call On 9920725232 With Body to body massage...
 
Digital Advertising Lecture for Advanced Digital & Social Media Strategy at U...
Digital Advertising Lecture for Advanced Digital & Social Media Strategy at U...Digital Advertising Lecture for Advanced Digital & Social Media Strategy at U...
Digital Advertising Lecture for Advanced Digital & Social Media Strategy at U...
 
Call me @ 9892124323 Cheap Rate Call Girls in Vashi with Real Photo 100% Secure
Call me @ 9892124323  Cheap Rate Call Girls in Vashi with Real Photo 100% SecureCall me @ 9892124323  Cheap Rate Call Girls in Vashi with Real Photo 100% Secure
Call me @ 9892124323 Cheap Rate Call Girls in Vashi with Real Photo 100% Secure
 
Junnasandra Call Girls: 🍓 7737669865 🍓 High Profile Model Escorts | Bangalore...
Junnasandra Call Girls: 🍓 7737669865 🍓 High Profile Model Escorts | Bangalore...Junnasandra Call Girls: 🍓 7737669865 🍓 High Profile Model Escorts | Bangalore...
Junnasandra Call Girls: 🍓 7737669865 🍓 High Profile Model Escorts | Bangalore...
 
Call Girls In Shalimar Bagh ( Delhi) 9953330565 Escorts Service
Call Girls In Shalimar Bagh ( Delhi) 9953330565 Escorts ServiceCall Girls In Shalimar Bagh ( Delhi) 9953330565 Escorts Service
Call Girls In Shalimar Bagh ( Delhi) 9953330565 Escorts Service
 
Al Barsha Escorts $#$ O565212860 $#$ Escort Service In Al Barsha
Al Barsha Escorts $#$ O565212860 $#$ Escort Service In Al BarshaAl Barsha Escorts $#$ O565212860 $#$ Escort Service In Al Barsha
Al Barsha Escorts $#$ O565212860 $#$ Escort Service In Al Barsha
 
Chintamani Call Girls: 🍓 7737669865 🍓 High Profile Model Escorts | Bangalore ...
Chintamani Call Girls: 🍓 7737669865 🍓 High Profile Model Escorts | Bangalore ...Chintamani Call Girls: 🍓 7737669865 🍓 High Profile Model Escorts | Bangalore ...
Chintamani Call Girls: 🍓 7737669865 🍓 High Profile Model Escorts | Bangalore ...
 

CAR EVALUATION DATABASE

  • 1. Practical Data Science 1 | P a g e s3779142, s3755598 CAR EVALUATION DATABASE Venkatesh Ramshetty Venkataramana1 (s3779142) Jeevan Hemmannu Tharanatha2 (s3755598) School of Science, Computer Science and Information Technology, RMIT University, Australia 1 s3779142@student.rmit.edu.au, 2 s355598@studnet.rmit.edu.au Date-01 June, 2019 Table of contents 1. Abstract........................................................................................................................................2 2. Introduction..................................................................................................................................2 2.1 Dataset Attributes……………...................................................................................................2 2.1. A. Do we need all the Variables? …………….........................................................................3 2.1. B. Target Attribute- classes……………...................................................................................3 3 Methodology……………….........................................................................................................4 3.1 Data collection…………….......................................................................................................4 3.2 Data preprocessing…………….................................................................................................4 3.3 Data exploration ……………....................................................................................................5 3.4 Splitting of dataset and randomization. ……………................................................................8 3.5 Data modeling (classification) ……………..............................................................................9 4. Results…………………………………………………………………………………………11 5. Discussion……………………………………………………………………………………..12 6. Conclusion…………………………………………………………………………………….12 7. References …………………………………………………………………………………….12
  • 2. Practical Data Science 2 | P a g e s3779142, s3755598 1. ABSTRACT. Cars are essentially part of our regular day to day life. There are various kind of cars produced by different manufacturers; subsequently the buyers has a decision to make. When as an individual consider of buying a car, there are numerous aspects that could influence his/her choice on which kind of car he/she is keen on. The choice buyer or drivers have generally relies upon the price, safety, and how luxurious and how spacious the car is. Car evaluation database is significant structure information that everyone should take a look at for the car features and useful in decision making. This dataset are labeled according to the specification of PRICE, COMFORT and SAFETY. The dataset utilized in this assignment can be access https://archive.ics.uci.edu/ml/datasets/Car+Evaluation The objective of this report is especially to determine the decision making, identifying the car variables like car price value with other various variable to decide between a good acceptable cars from the unaccepted values from the target value. Keywords: Classification, Car Evaluation. 2. INTRODUCTION. Understanding the idea in making a decision on a choice in getting a car is basic to everybody particularly the first time buyer or anyone who are inexperienced in how the car business functions. Generally we need a car as a methods for transportation however as we include fun into it and we tend to forget that we shouldn’t underestimate. In present times it is continuously the car sales representative who encourages us to purchase this car or not and from the conclusion of our family and companions who had past experienced with vehicle inconveniences. It would have been better to have a device that can check car features and tell that it's an X car or a Y car. If there is such device there should be no worries in purchasing a car. We may or probably won't know it consciously however we are basically ignoring the factors that would help us financially, comfortably, and safety in a long run. In this assignment we process the data, exploring the variables relationship between the attributes and we model the data from different classification models, those are K nearest neighbor and Decision trees in terms of their best set of parameter for each case and performance on car evaluation data set. 2.1 Dataset Attributes The data set that we accessed from the UCI repository which is collection of observation of the specified attributes of a car, it was donated by Marco Bohanec in 1997. The Car Evaluation dataset contains following concept structure: CAR- car acceptability. PRICE- overall price of a car buying -buying price of a car maint -price of the maintenance TECH- technical characteristics of a car COMFORT- comfort in a car doors -number of doors in a car persons- capacity in terms of persons to carry in a car lug_boot- the size of luggage boot in a car safety- estimated safety of the car
  • 3. Practical Data Science 3 | P a g e s3779142, s3755598 2.1. A. Do we need all the Variables? Getting rid of unnecessary variables is a good initial step when managing with any data set, since dropping attributes diminishes complexity nature and can make calculation on the data set quicker. Regardless of whether we should dispose an attributes or not will rely upon size of the data set and the goal of our investigation however in any case be useful to drop variables that will only distract from the aim and goal of the assignment. Diagram1: Dataset attributes The car directly relay on six attributes: 'buying','maint','doors','persons','lug_boot','safety','classes'. The dataset contains 1727 instances and possible values each attribute along with the data type are below. Attributes Possible Values Attributes Types buying vhigh, high, med,low nominal maint Vhigh,high, med, low nominal doors 2, 3, 4, 5more nominal persons 2, 4, more nominal lug_boot Small, med, big nominal safety Low, med, high nominal Table 1: attributes values 2.1. B. Target Attribute- classes: The data analysis is done on this dataset to identify some patterns and also attributes range with their Percentages (frequency). The target variable classes indicates whether each car is unacc, acc, good, vgood , since predicting analysis is our goal.
  • 4. Practical Data Science 4 | P a g e s3779142, s3755598 classes Number of observation per class Percentage unacc 1209 70.023 acc 384 22.222% good 69 3.993% vgood 65 3.762% Table 2: Class Distribution Attribute Characteristics: Categorical. Associated Tasks: Classification task to acquire the knowledge from the data set. Based on the distribution, from the table it looks like more no of instances are in unacc classes which means its skewed data, so it means we have chosen right task (classification) to analyse this distribution. 3. METHOLODOGY 3.1 Data collection: The Car Evaluation Dataset is selected from UCI Machine learning repository for this assignment. This dataset contains 1727 instance and 6 attributes. We are importing necessary pandas modules to the read the car evaluation data set from our system drive. 3.2 Data preprocessing: The dataset from UCI repository has be cleaned and it is standard quality before the module analysis is proceed. Data set often contains missing values and extreme values called outliers and this values can effect out test and even sometimes it even can cause classifier to fail. It better to remove all outliers and fill the missing values with near values. In our dataset, we don’t have any missing values in given table below Table 3. Attributes Missing Values buying 0 Maint 0 doors 0 persons 0 lug_boot 0 safety 0 classes 0 Table 3: Missing values In Car Evaluation Dataset. Detecting the missing values is easy task more over it is difficult to decide how to handle missing values, missing values in categorical data set are not troubling because we can treat them as NA on the other hand missing vales in numerical variables will cause troublesome to our analysis. Before starting up the analysis it’s a good idea to start off by checking the dimension of our dataset by checking the description of the variables.  Exploring the attributes and variables The initial step in data exploratory analysis is reading the data information and then exploring the attributes factors. It is essential to get a sense of how many variables and cases are, and there attributes datatypes, the possible range of values that attributes take on.
  • 5. Practical Data Science 5 | P a g e s3779142, s3755598  Transforming the Variables (Data transformation) When we first load the dataset , few variables may be encoded as datatypes and they doesn’t fit well in our dataset for example Classes variable(Target variable) that indicates the Unacceptable, acceptable, good and very good that only takes the values like 1, 2, 3 and 4. Most of the variables are encoded as object type and in this data analysis all the variable holding a categorical variables and the variables are in string format, to go further operation we need to change the String type to integer type, more over this models requires the variables to be in integers and we have converted by giving specified number to each variable (encoding). 3.3 Data exploration Data exploration is a technique similar to data analysis where data is summarized in visual exploration and the characteristics of data. The data exploration includes following  Univariate Exploration and analyze of each variable.  Bivariate Exploration and analyze pair of variables and their relationship.  Multivariate Exploration of multiple variables in the data set. Here we will check each feature with the classes with the distribution. Classes Classes distribution which give the number of count (unique values in the column) vs the classes. From the give graph result almost 70% of cars are in classes unacceptable (unacc), which means it skewed distribution. In the above graph, from the out of total 1727 instances of car in the dataset 1209(70%) were unacceptable, 384(22%) were acceptable, 69(3.9%) were in good and 65(3.7%) are in very good.
  • 6. Practical Data Science 6 | P a g e s3779142, s3755598 buying. Buying histogram- the distribution of the classes(values) trend to be uniformly distributed, while very high and high buying cost of a car will probably made a car be in unaccepted. maint (Maintenance). From the maintenance distribution with the very high and high maintenance price will probably made a car be to unaccepted doors. Here, distribution of each classes tend to be uniformly distributed of the classes values whereas 2 doors will effect a car to be in unaccepted classes.
  • 7. Practical Data Science 7 | P a g e s3779142, s3755598 persons. In this persons distribution of the classes, with 2 persons capacity of the car it will be unaccepted. Car seating capacity is an important factor for the customers in accepting or rejecting a car. lug_boot(Luggage boot space). In this luggage boot space in the car distribution, where small luggage boot is causing the car to be in unaccepted. Safety. In this safety distribution of the each classes it is seen that normal distribution and low safety will most likely caused a car being unaccepted. Safety is an important factor in terms of accepting or rejecting a car for customers. Whereas low safety cars are not accepted by the customers. Where in measurement view of normal distribution is a nature in practical real-world cases, then we can decide safety is the most important features in our module analysis
  • 8. Practical Data Science 8 | P a g e s3779142, s3755598 Data exploration -Multivariate analysis. As we encoded the string data (categorical data) to integer type, and our dataset doesn’t contain continuous values. As our data set contains only 3 to 4 possible values for each variables in the dataset. Hence diagram looks similar for all cases in our dataset. 3.4 Splitting of dataset and randomization. Training and Testing: In this assignment, we have divided the dataset into training set and testing set and the 3 splits pairs used in this assignment on each classifier are show in the table 4. Training and Testing % split 50% 50% 60% 40% 80% 20% Table 4: Training and Testing Split
  • 9. Practical Data Science 9 | P a g e s3779142, s3755598 3.5 Data modeling (classification) The experiment is carried on using the classifiers models, those are K-nearest neighbors and Decision trees. This experiment is to determine which classifier best suits for our data set in terms of classifying the trained and tested set and also making prediction module obtained during the training process. The detailed procedure of the experiment is below. I. K-nearest neighbors K-NN is a classifier which just finds the classes of the k-nearest neighbors (based on a distance metric the shortest distance between the samples which is known as Euclidean) and then find the classes in the larger part and assign that class to the test pattern. Knn module is a technique of learning where a particular instance is mapped against many labels. Here we are pre-specifying the labels to train our module. power parameter, p=1 or 2.  Manhattan distance. For p = 1 if x=(a, b)x=(a, b) and y=(c, d)y=(c, d), the Manhattan distance between xx and yy is |a−c|+|b−d||a−c|+|b−d|.  Euclidean distance For p = 2. if x=(a, b)x=(a, b) and y=(c, d)y=(c, d), the Euclidean distance between xx and yy is i. For 50% training set and 50% testing set The data set has been divided into 50% train and 50% test set with instances of 863 and 864 respectively. ii. For 60% training set and 40% testing set The data set has been divided into 60% train and 40% test set with instances of 1036 and 691 respectively. iii. For 80% training set and 20% testing set The data set has been divided into 80% train and 20% test set with instances of 1381 and 346 respectively. The accuracy achieved for different dataset spilt are presented in the table 5. Splitting Percentage (Training % and Testing %) 50% 50% 60% 40% 80% 20% n_neighbors 5 5 7 Power variable (p) 2 1 2 Testing accuracy 91.20% 92.61% 93.641%
  • 10. Practical Data Science 10 | P a g e s3779142, s3755598 Classification error rate 8.79% 7.38% 6.35% Confusion Matrix [[577 6 3 0] [ 46 167 3 3] [ 4 3 21 1] [ 1 2 4 23]] [[459 4 2 0] [ 28 148 3 0] [ 3 5 15 0] [ 1 5 0 18]] [[231 2 1 0] [ 14 73 0 0] [ 1 1 10 0] [ 0 2 1 10]] precision 0.846 0.899 0.927 recall 0.809 0.804 0.857 f1 score: 0.824 0.845 0.887 Table 5: Accuracy test for K nearest neighbor From the output for KNN classifier, we can say that the split 80% 20% train and test dataset gives us the best accuracy when compared to other splitting ratio. II. Decision trees Decision tree is a module that uses a tree-like-graph or module of condition of decisions and their possible consequences. It is one approach to display an algorithm that contains only conditional control statements. It follows a flowchart like structure in each internal node that is condition on each attribute, each branch represents the outcome of the condition, and each leaf node represents a class table. The top down approach from the root to the leaf represents classification rule. Root Node: This Node represents the total population (instances) and furthers breakdown into branches class sub-nodes based the conditions. Decision node: When a sub node gets divided into further sub nodes then its called decision node. Leaf node:When node cannot spilt further into sub nodes. i. For 50% training set and 50% testing set The data set has been divided into 50% train and 50% test set with instances of 863 and 864 respectively. i. For 60% training set and 40% testing set The data set has been divided into 60% train and 40% test set with instances of 1036 and 691 respectively. ii. For 80% training set and 20% testing set The data set has been divided into 80% train and 20% test set with instances of 1381 and 346 respectively. The accuracy achieved for different dataset spilt are presented in the table 6.
  • 11. Practical Data Science 11 | P a g e s3779142, s3755598 Decision tree max_depth=6 Splitting Percentage (Training % and Testing %) 50% 50% 60% 40% 80% 20% Testing accuracy 92.24% 93.19% 93.641% Classification error rate 7.75% 6.80% 6.35% Confusion Matrix [[568 16 2 0] [ 16 179 21 3] [ 0 0 24 5] [ 0 4 0 26]] [[449 14 2 0] [ 2 156 18 3] [ 0 0 19 4] [ 0 4 0 20]] [[224 9 1 0] [ 1 78 7 1] [ 0 0 11 1] [ 0 2 0 11]] precision 0.786 0.780 0.824 recall 0.870 0.874 0.904 f1 score 0.817 0.815 0.854 Table 6: Accuracy test for decision tree From the output for Decision tree classifier, we can say that the split 80% 20% train and test dataset gives us the best accuracy when compared to other splitting ratio. 4. RESULTS The presentation of the results is based on following model analysis. To get better understand of the module we also used another measurement precision, recall, f1 score. In this analysis our splitting ration of k nearest neighbor 80% 20% seems good enough at its performance. For 80% 20% n_neighbour= 7 , p= 2 Testing accuracy Classification error rate Confusion Matrix precision recall f1 score: 93.641% 6.35% [[231 2 1 0] [ 14 73 0 0] [ 1 1 10 0] [ 0 2 1 10]] 0.927 0.857 0.887 Table 5.a: Accuracy results for K nearest neighbor For 80% and 20% Max_depth= 6 Testing accuracy Classification error rate Confusion Matrix precision recall f1 score: 93.641% 6.35% [[224 9 1 0] [ 1 78 7 1] [ 0 0 11 1] [ 0 2 0 11]] 0.824 0.904 0.854 Table 6.a: Accuracy results for K nearest neighbor
  • 12. Practical Data Science 12 | P a g e s3779142, s3755598 5. DISCUSSION  Safety and person’s capacity are main factors in rejecting the car classes as unacceptable.  The splitting of data set from the two comparison shows that K nearest neighbor and decision tree have exactly same accuracy(93.64%) across the data split ratio (80:20).  F1 score is combination of precision and recall then we can say that f1 score is used to measure our model performance.  Also, it is seen that decision trees has less f1 score even though k nearest neighbor and decision tree have same accuracy.  Here with the data split with 80-20 both the modules k-nearest neighbor and decision tree have same accuracy but accuracy can’t be the fair criteria to determine unbalanced classification so let’s check with f1 score and k-nearest neighbor with 80-20 have highest 0.88 when compared to decision tree f1 of 0.85.  To provide a distinction between two classifiers and their performance, comparing the results of two classifiers are show in the table 5.a and table 6.a, table under the result. 6. CONLUSION The comparison analysis for the classifiers used in this assignment show that K nearest neighbor and Decision tree have same performance in terms of accuracy. However, in terms of f1 score k nearest neighbor seems to be best compared to decision tree. 7. REFERENCES 1. https://towardsdatascience.com/decision-trees-in-machine-learning-641b9c4e8052 2. https://scikit-learn.org/stable/modules/generated/sklearn.tree.DecisionTreeClassifier.html 3. https://kevinzakka.github.io/2016/07/13/k-nearest-neighbor/ 4. https://www.analyticsvidhya.com/blog/2016/01/guide-data-exploration/ 5. https://archive.ics.uci.edu/ml/datasets/Car+Evaluation 6. https://www.dataquest.io/blog/sci-kit-learn-tutorial/ 7. https://towardsdatascience.com/machine-learning-general-process-8f1b510bd8af 8. http://kt.ijs.si/MarkoBohanec/pub/Avignon88.pdf