Download as PDF, PPTX

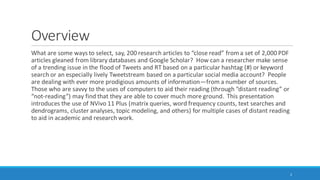
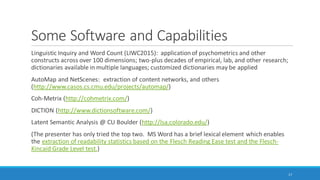
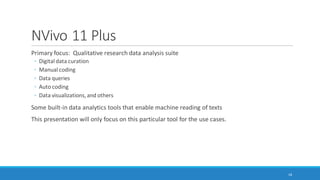
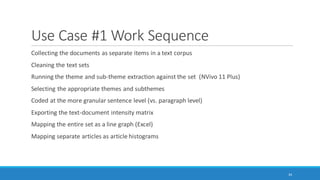
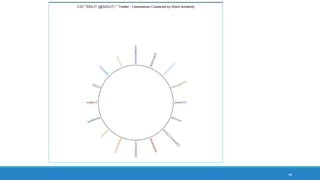
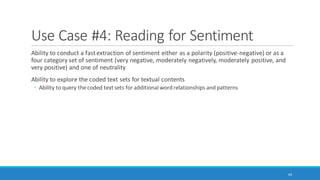
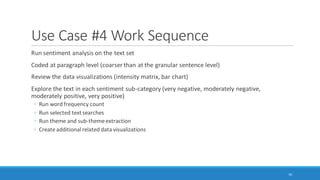
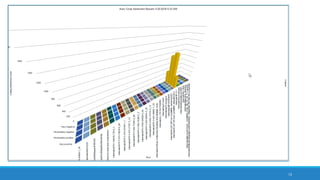
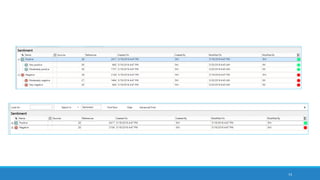
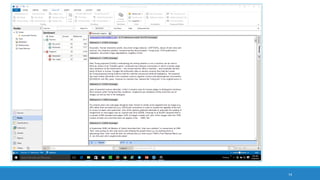
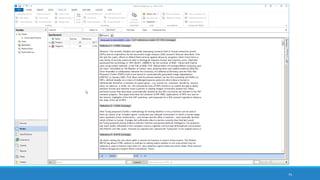
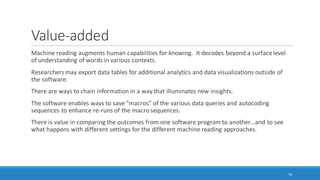
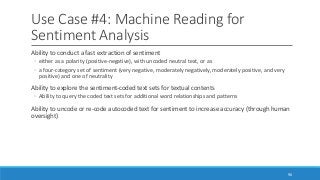
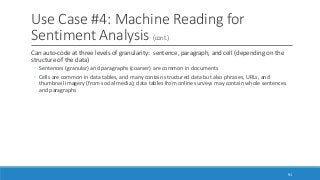

The document discusses the utilization of machine reading techniques to manage and analyze large datasets in higher education, particularly in the context of research and instructional technology. It presents four use cases for machine reading, including topic modeling, social media engagement, coding exploration, and sentiment analysis, all aimed at aiding researchers in navigating and extracting insights from vast amounts of textual data. The presentation also highlights specific tools, like NVivo 11 Plus, and the methodologies for processing and visualizing machine-generated results.