Download as PPSX, PPTX
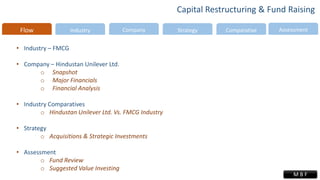
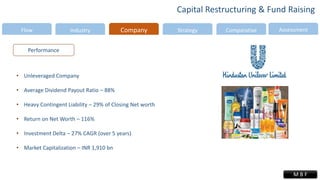

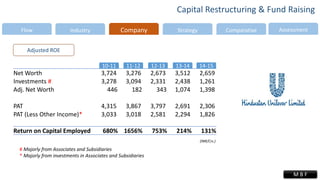


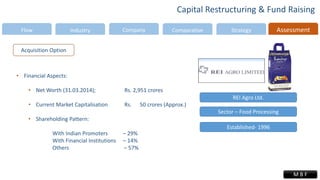


The document discusses Hindustan Unilever Ltd's capital structuring and fund raising. It summarizes HUL's financial performance, noting that it is an unleveraged company with a high dividend payout ratio and return on net worth. The document also analyzes HUL's investments, noting they have grown at a 27% CAGR over 5 years. Finally, the document discusses an potential acquisition of REI Agro Ltd in the food processing sector to extend HUL's food portfolio.


![[금호 그룹]금호의 Turn Around 전략](https://cdn.slidesharecdn.com/ss_thumbnails/kumho2team4final-100725235358-phpapp01-thumbnail.jpg?width=640&height=640&fit=bounds)


