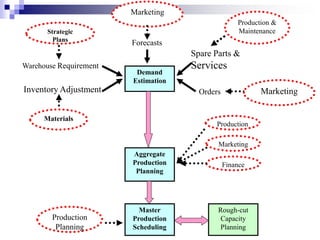
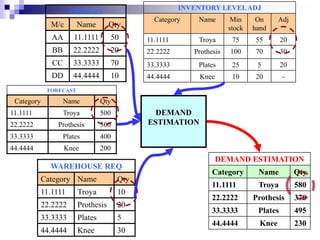
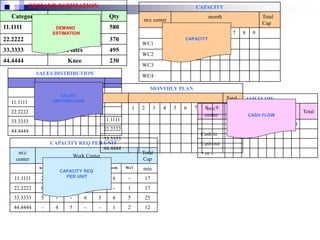
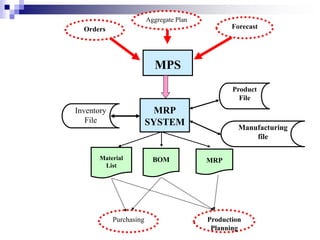
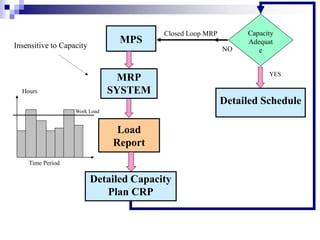
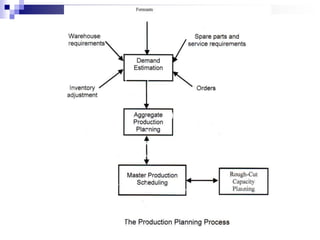
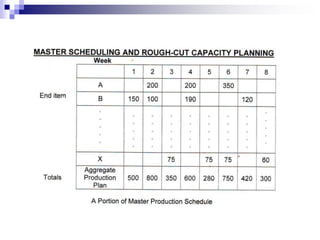
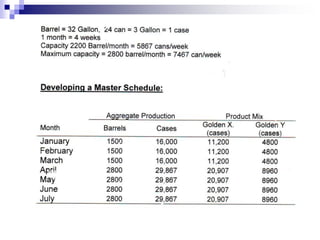
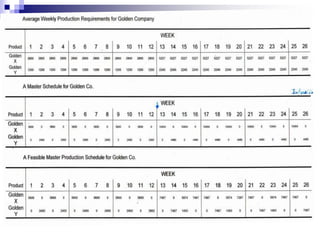
Capacity Planning
Production & Operation
Management
1 2 3 4 n
Work Center
WC 1
Queuing Time (j)
Change Over Time
(i,j)
Setting Time (j)
Dismantling Time (i)
Processing Time
……
Loading Time Unloading Time
Run Time
Total Processing Time
Waiting Time
Move Time
1 2 3 4 n 1 2 3 4 n
Arrival of
(J) at WC1
Work Center
WC 1
Work Center
WC 2
Queuing
Time (j)
Change
Over Time
(i,j)
Setting
Time (j)
Dismantling
Time (i)
Processing
Time
……
Loading
Time
Dismantling
Time
Run
Time
Total Processing Time
Waiting
Time
Move
Time
Arrival of
(J) at WC2
……
Aggregate Production Planning
 Production Planning and Master
Scheduling involve the determination of
future production levels over a time
horizon of several months to 1 yr.
 They are tactical planning decisions
 They respond to a firm’s overall business
plan
Aggregate Production Planning
 The production plan sets an intermediate-
range goal for the company’s products and
capacity utilization in total
 The master schedule provides the input for
detailed scheduling and control at the
operational level
Aggregate Production Planning
 Manufacturing, Marketing, and Financial
plans must be coordinated
 Poor production planning can lead to
excessive inventory levels or backorders
and thus increase cost or reduce service
level.
The Production Planning Process
 Accurate forecasts can be made for
aggregate groups of items, particularly
over long time horizon
 Since production plans are made for up to
1 year’ time, demand and
production/inventory levels are usually
expressed by aggregate measures of
capacity such as dollars, tons, gallons,
machine hours, or units of product groups
Sales
Forecasting
DISPAT
CHING
Demand
Estimation
Finance
Production
Stores
Purchasing
Accounting
Quality
Control
MPS
Joint
Planning
Process
HR
Marketing
Production &
Maintenance
Marketing
Production
Materials
Strategic
Plans
Finance
Demand
Estimation
Forecasts
Spare Parts &
Services
Warehouse Requirement
Inventory Adjustment Orders
Aggregate
Production
Planning
Master
Production
Scheduling
Production
Planning
Rough-cut
Capacity
Planning
Marketing
CASH FLOW
m/c
center
month Total
1 2 3 4 5 6 7 8 9
Cash in
Cash
out
+ or -
CAPACITY
m/c
center
Month Total
Cap
1 2 3 4 5 6 7 8 9 10 11 12
WC1
WC2
WC3
WC4
CAPACITY REQ PER UNIT
m/c
center
Work Center
Total
Cap
wc1 wc2 wc3 wc4 wc5 wc6 wc7
11.1111 2 5 4 - - 6 -
22.2222 6 7 3 - - - 1
33.3333 5 - - 6 3 6 5
44.4444 - 4 5 - - 1 2
MONTHLY PLAN
1 2 3 4 5 6 7 8 9
11.1111
22.2222
33.3333
44.4444
ORDERS
M/c Name Qty
AA 11.1111 50
BB 22.2222 20
CC 33.3333 70
DD 44.4444 10
INVENTORY LEVELADJ
Category Name Min
stock
On
hand
Adj
11.1111 Troya 75 55 20
22.2222 Prothesis 100 70 30
33.3333 Plates 25 5 20
44.4444 Knee 10 20 -
DEMAND ESTIMATION
Category Name Qty
11.1111 Troya 580
22.2222 Prothesis 370
33.3333 Plates 495
44.4444 Knee 230
FORECAST
Category Name Qty
11.1111 Troya 500
22.2222 Prothesis 300
33.3333 Plates 400
44.4444 Knee 200
WAREHOUSE REQ
Category Name Qty
11.1111 Troya 10
22.2222 Prothesis 20
33.3333 Plates 5
44.4444 Knee 30
DEMAND
ESTIMATION
DEMAND ESTIMATION
Category Name Qty
11.1111 Troya 580
22.2222 Prothesis 370
33.3333 Plates 495
44.4444 Knee 230
CAPACITY
m/c center
month Total
Cap
1 2 3 4 5 6 7 8 9
WC1
WC2
WC3
WC4
CAPACITY REQ PER UNIT
m/c
center
Work Center
Total
Cap
wc1 wc2 wc3 wc4 wc5 wc6 Wc7 min
11.1111 2 5 4 - - 6 - 17
22.2222 6 7 3 - - - 1 17
33.3333 5 - - 6 3 6 5 25
44.4444 - 4 5 - - 1 2 12
SALES DISTRIBUTION
1 2 3 4 5 6 7 8 9
11.1111
22.2222
33.3333
44.4444
CASH FLOW
m/c
center
month Total
1 2 3 4 5 6 7 8 9
Cash in
Cash out
+ or -
MONTHLY PLAN
Total
1 2 3 4 5 6 7 8 9
11.1111
22.2222
33.3333
44.4444
DEMAND
ESTIMATION
SALES
DISTRIBUTION
CAPACITY REQ
PER UNIT
CAPACITY
CASH FLOW
Aggregate Plan
Forecast
Orders
MPS
MRP
SYSTEM
Production
Planning
Inventory
File
Product
File
Purchasing
MRP
Manufacturing
file
Material
List
BOM
MPS
MRP
SYSTEM
Load
Report
Detailed Capacity
Plan CRP
Detailed Schedule
Capacity
Adequat
e
YES
Insensitive to Capacity
Hours
Time Period
Work Load
NO
Closed Loop MRP
Production
Planning
Materials
Requirement
Planning (MRP)
Planning section
Issue Work Orders &
Control Paper Work
Dispatching section
Dispatch Orders
Dispatching section
Inspection
Order
Quality
Control
Material
Issue Order
Stores
Move
order
Follow up
ORDER DISPACTCHING
Manufacturing
Database
MPS
Aggregate
Plan
Aggregate
Plan
Work
Order
Workshop
Tool
Order
Tool
Stores
Aggregate Production Planning
 Aggregate production planning is the
development of monthly or quarterly
production requirements that will meet the
estimates of demand.
 Gross capacity considerations must be
taken into account during production
planning.
Aggregate Production Planning
 If production to satisfy demand cannot be
achieved within existing resource limitation,
then management may have to make
intermediate-range capacity adjustments.
 If long-term trends are evident, then
management may also wish to consider
strategic resource changes
Aggregate Production Planning
 Once a production plan is made, it must be
disaggregated into time-phased
requirements for individual products.
 This plan is called the Master Production
Schedule (MPS).
 The MPS usually states weekly product
requirements over 6 to 12 month time
horizon
Aggregate Production Planning
 The master schedule is not a forecast, but
rather a schedule of when production should
be completed.
 The MPS is used by operating personnel to
make detailed plans for the procurement of
materials, the production of components, and
final assembly of the finished goods.
Aggregate Production Planning
 The Rough Cut Capacity Plan involves the
analysis of the MPS to determine if sufficient
capacity is available at critical points in the
production process
 It focuses on specific operations such as final
assembly, painting, or finishing to determine
where bottlenecks will probability occur.
 This provides a rapid determination of the
feasibility of the master production schedule.
Aggregate Production and
Capacity Planning
1. Translate demand forecasts into planned monthly
production level
2. Establish minimum inventory levels in order to
provide specified levels of customer service
(starting and ending inventory)
3. The total production required over the horizon is
the total sales forecast plus or minus any desired
change in inventory
4. Determine monthly or weekly production rates
Aggregate Production and Capacity
Planning (Example)
Automotive company uses filters
 Opening inventory from filters= 80,000
 Ending inventory from filters = 50,000
 Projected demand during the year=500,000
 Total production required=
 500,000 – (50,000-80,000) = 470,000
 Monthly production = 470,000/12 = 39,167 filter/month
Transportation Model for Aggregate
Planning
 Transportation model is useful in situations
when several sources of production are
available (for example, regular time,
overtime, and subcontracting), where
production and inventory costs are linear,
and where there is a limited capacity for
each source in each period.
Transportation Model for Aggregate Planning (Example)
 Snow Sporting Goods Company
 Projected demand for one product, snow skis, over
winter months is 5000, 10,000, 11,000, 7500 and 5000
pairs.
 Labor costs for regular time = $50 per unit
 Overtime cost = %54 per unit
 Subcontract cost = $57 per unit
 Inventory holding costs = $6 per unit each month
 No shortages are allowed
 Regular time production = 9000 units
 Overtime production = 1800 units
 Subcontracted possible quantity = 2500
Developing a Master Schedule
Capacity Planning Product and operation management

Capacity Planning Product and operation management

  • 1.
    Capacity Planning Production &Operation Management
  • 2.
    1 2 34 n Work Center WC 1 Queuing Time (j) Change Over Time (i,j) Setting Time (j) Dismantling Time (i) Processing Time …… Loading Time Unloading Time Run Time Total Processing Time Waiting Time Move Time
  • 3.
    1 2 34 n 1 2 3 4 n Arrival of (J) at WC1 Work Center WC 1 Work Center WC 2 Queuing Time (j) Change Over Time (i,j) Setting Time (j) Dismantling Time (i) Processing Time …… Loading Time Dismantling Time Run Time Total Processing Time Waiting Time Move Time Arrival of (J) at WC2 ……
  • 8.
    Aggregate Production Planning Production Planning and Master Scheduling involve the determination of future production levels over a time horizon of several months to 1 yr.  They are tactical planning decisions  They respond to a firm’s overall business plan
  • 9.
    Aggregate Production Planning The production plan sets an intermediate- range goal for the company’s products and capacity utilization in total  The master schedule provides the input for detailed scheduling and control at the operational level
  • 10.
    Aggregate Production Planning Manufacturing, Marketing, and Financial plans must be coordinated  Poor production planning can lead to excessive inventory levels or backorders and thus increase cost or reduce service level.
  • 11.
    The Production PlanningProcess  Accurate forecasts can be made for aggregate groups of items, particularly over long time horizon  Since production plans are made for up to 1 year’ time, demand and production/inventory levels are usually expressed by aggregate measures of capacity such as dollars, tons, gallons, machine hours, or units of product groups
  • 12.
  • 13.
    Marketing Production & Maintenance Marketing Production Materials Strategic Plans Finance Demand Estimation Forecasts Spare Parts& Services Warehouse Requirement Inventory Adjustment Orders Aggregate Production Planning Master Production Scheduling Production Planning Rough-cut Capacity Planning Marketing
  • 14.
    CASH FLOW m/c center month Total 12 3 4 5 6 7 8 9 Cash in Cash out + or - CAPACITY m/c center Month Total Cap 1 2 3 4 5 6 7 8 9 10 11 12 WC1 WC2 WC3 WC4 CAPACITY REQ PER UNIT m/c center Work Center Total Cap wc1 wc2 wc3 wc4 wc5 wc6 wc7 11.1111 2 5 4 - - 6 - 22.2222 6 7 3 - - - 1 33.3333 5 - - 6 3 6 5 44.4444 - 4 5 - - 1 2 MONTHLY PLAN 1 2 3 4 5 6 7 8 9 11.1111 22.2222 33.3333 44.4444
  • 15.
    ORDERS M/c Name Qty AA11.1111 50 BB 22.2222 20 CC 33.3333 70 DD 44.4444 10 INVENTORY LEVELADJ Category Name Min stock On hand Adj 11.1111 Troya 75 55 20 22.2222 Prothesis 100 70 30 33.3333 Plates 25 5 20 44.4444 Knee 10 20 - DEMAND ESTIMATION Category Name Qty 11.1111 Troya 580 22.2222 Prothesis 370 33.3333 Plates 495 44.4444 Knee 230 FORECAST Category Name Qty 11.1111 Troya 500 22.2222 Prothesis 300 33.3333 Plates 400 44.4444 Knee 200 WAREHOUSE REQ Category Name Qty 11.1111 Troya 10 22.2222 Prothesis 20 33.3333 Plates 5 44.4444 Knee 30 DEMAND ESTIMATION
  • 16.
    DEMAND ESTIMATION Category NameQty 11.1111 Troya 580 22.2222 Prothesis 370 33.3333 Plates 495 44.4444 Knee 230 CAPACITY m/c center month Total Cap 1 2 3 4 5 6 7 8 9 WC1 WC2 WC3 WC4 CAPACITY REQ PER UNIT m/c center Work Center Total Cap wc1 wc2 wc3 wc4 wc5 wc6 Wc7 min 11.1111 2 5 4 - - 6 - 17 22.2222 6 7 3 - - - 1 17 33.3333 5 - - 6 3 6 5 25 44.4444 - 4 5 - - 1 2 12 SALES DISTRIBUTION 1 2 3 4 5 6 7 8 9 11.1111 22.2222 33.3333 44.4444 CASH FLOW m/c center month Total 1 2 3 4 5 6 7 8 9 Cash in Cash out + or - MONTHLY PLAN Total 1 2 3 4 5 6 7 8 9 11.1111 22.2222 33.3333 44.4444 DEMAND ESTIMATION SALES DISTRIBUTION CAPACITY REQ PER UNIT CAPACITY CASH FLOW
  • 17.
  • 18.
    MPS MRP SYSTEM Load Report Detailed Capacity Plan CRP DetailedSchedule Capacity Adequat e YES Insensitive to Capacity Hours Time Period Work Load NO Closed Loop MRP
  • 19.
    Production Planning Materials Requirement Planning (MRP) Planning section IssueWork Orders & Control Paper Work Dispatching section Dispatch Orders Dispatching section Inspection Order Quality Control Material Issue Order Stores Move order Follow up ORDER DISPACTCHING Manufacturing Database MPS Aggregate Plan Aggregate Plan Work Order Workshop Tool Order Tool Stores
  • 21.
    Aggregate Production Planning Aggregate production planning is the development of monthly or quarterly production requirements that will meet the estimates of demand.  Gross capacity considerations must be taken into account during production planning.
  • 22.
    Aggregate Production Planning If production to satisfy demand cannot be achieved within existing resource limitation, then management may have to make intermediate-range capacity adjustments.  If long-term trends are evident, then management may also wish to consider strategic resource changes
  • 23.
    Aggregate Production Planning Once a production plan is made, it must be disaggregated into time-phased requirements for individual products.  This plan is called the Master Production Schedule (MPS).  The MPS usually states weekly product requirements over 6 to 12 month time horizon
  • 24.
    Aggregate Production Planning The master schedule is not a forecast, but rather a schedule of when production should be completed.  The MPS is used by operating personnel to make detailed plans for the procurement of materials, the production of components, and final assembly of the finished goods.
  • 25.
    Aggregate Production Planning The Rough Cut Capacity Plan involves the analysis of the MPS to determine if sufficient capacity is available at critical points in the production process  It focuses on specific operations such as final assembly, painting, or finishing to determine where bottlenecks will probability occur.  This provides a rapid determination of the feasibility of the master production schedule.
  • 26.
    Aggregate Production and CapacityPlanning 1. Translate demand forecasts into planned monthly production level 2. Establish minimum inventory levels in order to provide specified levels of customer service (starting and ending inventory) 3. The total production required over the horizon is the total sales forecast plus or minus any desired change in inventory 4. Determine monthly or weekly production rates
  • 27.
    Aggregate Production andCapacity Planning (Example) Automotive company uses filters  Opening inventory from filters= 80,000  Ending inventory from filters = 50,000  Projected demand during the year=500,000  Total production required=  500,000 – (50,000-80,000) = 470,000  Monthly production = 470,000/12 = 39,167 filter/month
  • 38.
    Transportation Model forAggregate Planning  Transportation model is useful in situations when several sources of production are available (for example, regular time, overtime, and subcontracting), where production and inventory costs are linear, and where there is a limited capacity for each source in each period.
  • 39.
    Transportation Model forAggregate Planning (Example)  Snow Sporting Goods Company  Projected demand for one product, snow skis, over winter months is 5000, 10,000, 11,000, 7500 and 5000 pairs.  Labor costs for regular time = $50 per unit  Overtime cost = %54 per unit  Subcontract cost = $57 per unit  Inventory holding costs = $6 per unit each month  No shortages are allowed  Regular time production = 9000 units  Overtime production = 1800 units  Subcontracted possible quantity = 2500
  • 44.