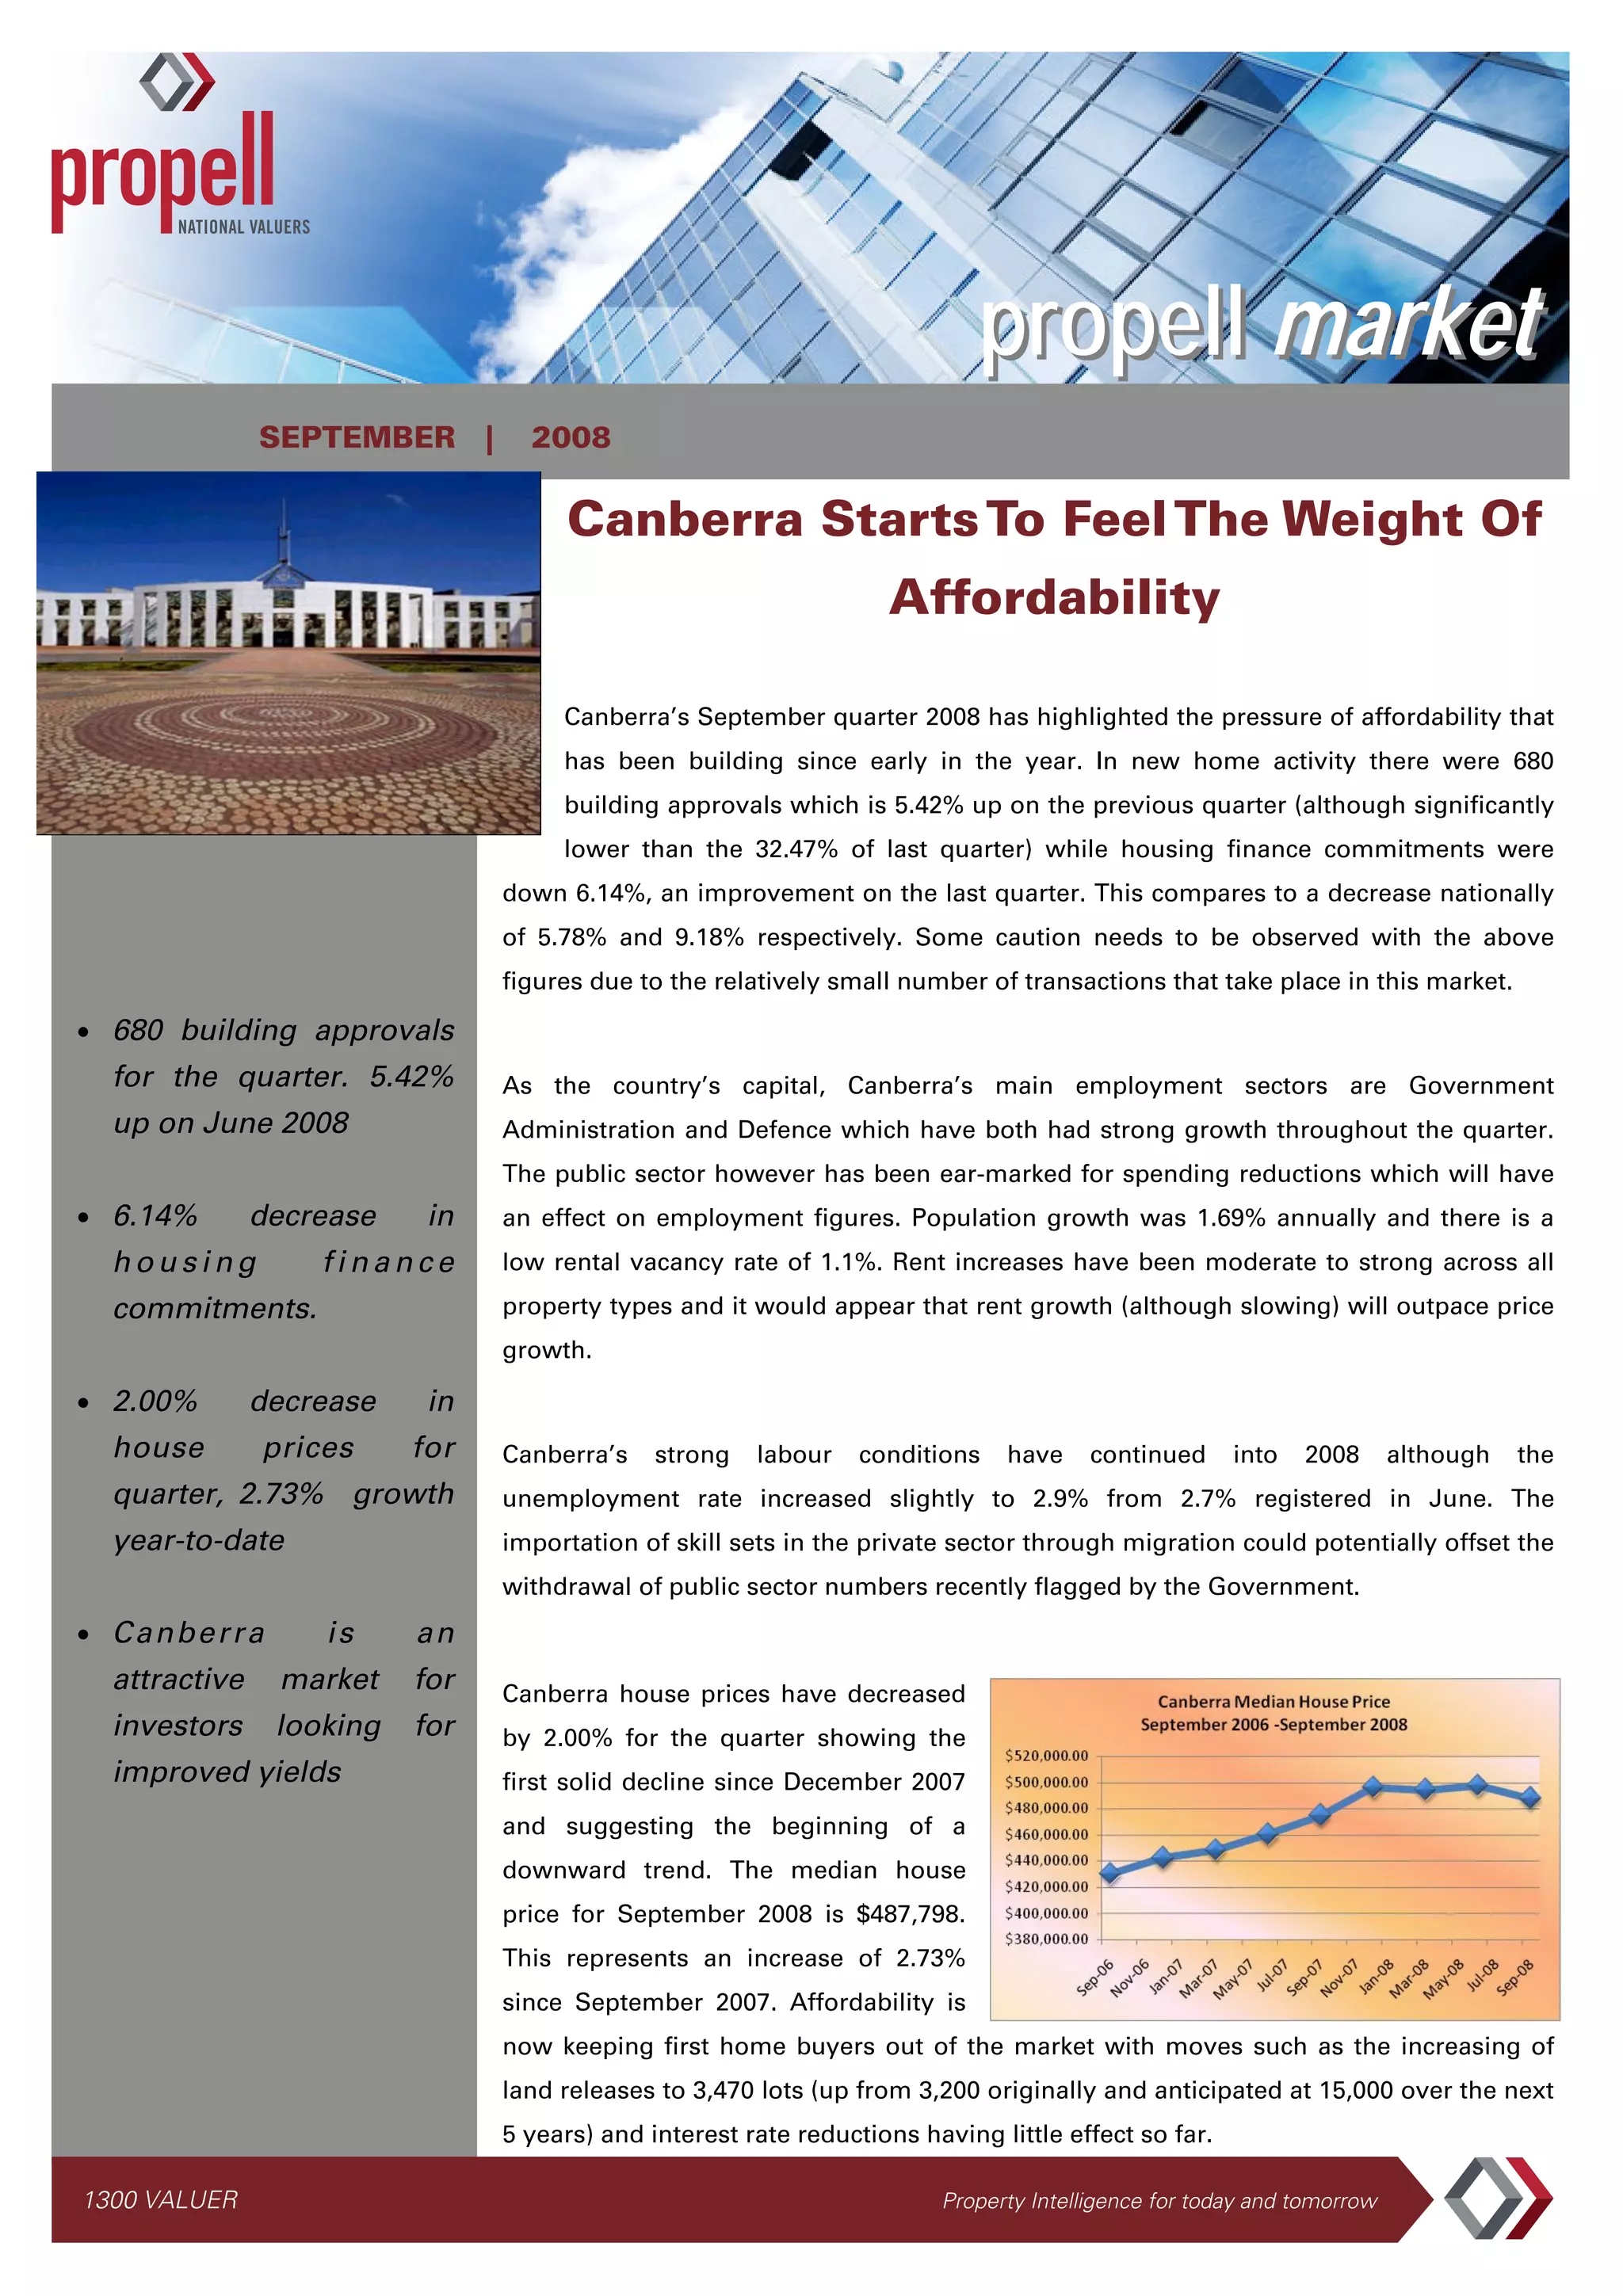
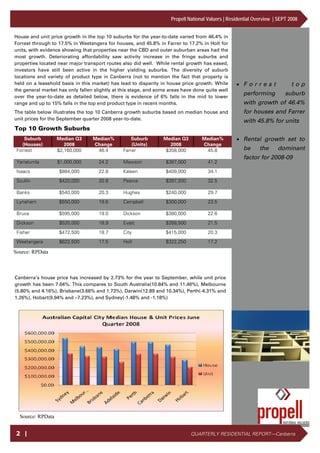
- Canberra's housing market is showing signs of slowing down, with house prices decreasing 2% in the quarter and affordability becoming an issue.
- Rental growth is also slowing but rents are still considered too high, leading to rental stress. Vacancy rates increased to 1.1% in the quarter.
- The local economy remains strong due to government employment, but public sector spending cuts could impact jobs. Population growth was also lower due to declines in interstate and overseas migration.
Darwin's housing market is showing signs of slowing after years of strong growth. House price growth has slowed to 2.14% for the quarter, down from previous periods. Building approvals decreased by 27.75% and housing finance commitments fell by 8.38%. Rental vacancies remain extremely low at 0.3% and rents rose by 6-8% in the quarter, indicating continued strong demand. However, slowing unit sales and oversupply of units may dampen further price rises as uncertainty in the mining sector impacts the local economy. Major projects in gas, infrastructure and defense should help offset potential slowing in the labor market.
1) Sydney's housing market has experienced declines over the past year due to high interest rates, reduced population growth, and diminishing capital growth. The median house price in Sydney fell 2.31% in 2008.
2) Housing construction has fallen significantly due to high costs and a downturn in the residential market. This sector typically accounts for 5-6% of the state's economy.
3) While further price softening is expected in the short term, interest rate cuts and an ongoing shortage of housing supply indicate the conditions for an upswing in the residential market in the near future.
• The Sydney housing market continued to decline in the September quarter with housing approvals down 15.12% and housing finance commitments down 9.41% from the previous quarter. Affordability remains a major issue for buyers and rental vacancy rates increased slightly to 1.2%.
• Top performing suburbs for house price growth were Watsons Bay at 42.8% and Dee Why at 25.1%, while units grew most in Tamarama at 31.5% and Lane Cove at 26.9%. Waterfront and top end properties experienced the highest price rises.
• Sydney's population growth was the third lowest in the country at 1.21% and net overseas migration
Home sales edge higher in september 2011Matt Collinge
Home sales in British Columbia rose 8.8% in September compared to the same month last year. The average home price increased 6% to $523,568. While sales increased, total housing listings remained elevated. Year-to-date, home sales dollar volume has risen 17.5% and unit sales have risen 3.2%, with average prices up 13.9%.
Real Estate Board of Greater Vancouver Statistics Package November 2020Vicky Aulakh
- Home sales in Metro Vancouver reached 3,064 in November 2020, a 22.7% increase from November 2019 and the highest total since 2015.
- Demand has been at near record levels since summer 2020, putting upward pressure on home prices, particularly for detached and townhomes.
- While demand remained high across the region, activity was particularly focused in more remote areas like the Sunshine Coast due to increased work-from-home arrangements during the pandemic.
Sales of residential properties in the Victoria Real Estate Board region increased significantly in October 2020 compared to the previous year. A total of 990 properties sold in October 2020, up 59.9% from October 2019. Both condominium and single family home sales saw large increases. However, active listings continued to decline, down 19.7% from the previous year. This high demand and low supply environment has led to many multiple offer situations and upward pressure on home prices.
Real Estate Board of Greater Vancouver Statistics Package August 2021Vicky Aulakh
- Home sales in Metro Vancouver increased 3.4% in August 2021 compared to August 2020, but listings declined 30.6%, leaving the housing market undersupplied.
- The total number of homes listed for sale was 29.7% lower than August 2020 and 8.6% lower than July 2021, with only 9,005 homes currently listed.
- The sales-to-active listings ratio of 35% indicates downward pressure on prices, but analysts say a sustained ratio below 12% is needed to significantly impact prices.
The Metro Vancouver housing market saw steady home sale and listing activity in May, a shift back from the record-breaking activity seen in the earlier spring months.
Sales decreased 13% from APRIL 2021.
Stats provided by the real estate Board of Greater Vancouver
- Home sales in Metro Vancouver increased significantly in April 2021 compared to April 2020, with record high home sales for the month of April.
- In response to high demand, home sellers have been more active, with a record number of new listings in April 2021 compared to previous years.
- While new listings are at record highs, demand remains strong and more supply is still needed to balance the market, according to the Real Estate Board of Greater Vancouver.
Real Estate Board of Greater Vancouver Statistics Package July 2021Vicky Aulakh
- Housing sales in Metro Vancouver saw moderate trends in July compared to heightened activity during the pandemic. Home sales increased 6.3% year-over-year but decreased 11.6% month-over-month.
- New housing listings decreased 26.4% year-over-year and 25.2% month-over-month, indicating low housing supply remains an issue.
- Benchmark home prices remained virtually unchanged both month-over-month and year-over-year across most property types, suggesting price increases are moderating as supply remains tight.
- Home sales in Metro Vancouver decreased in June 2021 compared to May 2021 but were higher than June 2020. Listings also decreased from May 2021.
- The housing market is beginning to normalize from the busy spring season, making multiple offers and subjects on offers more common again.
- Benchmark home prices rose from June 2020 across all property types (detached, townhomes, apartments) but price increases slowed in recent months.
Home sales in the Metro Vancouver housing market declined below the long-term average in 2019 despite increased demand at the end of the year. Sales increased 3% from 2018 but were still 20.3% below the 10-year average. Prices dipped between 2-4% across property types depending on the area. Listings decreased from 2018 but were still below the 10-year average, indicating low inventory. Home buyer confidence improved in the second half of the year, leading to above average sales in the fourth quarter of 2019.
Home sales in Metro Vancouver dipped to the lowest level seen in March in over 30 years according to a report from the Real Estate Board of Greater Vancouver. Sales totalled 1,727 in March 2019, down 31.4% from March 2018. The total number of homes currently listed is also up 52.4% compared to March 2018. The president of the Real Estate Board attributed the downturn to government policies that have imposed new taxes and regulations on the housing market in recent years, arguing these measures sideline buyers in the short term but do not eliminate long term demand for housing. Benchmark home prices were down across all major property types compared to the previous year.
Home buyer competition is intensifying across Metro Vancouver's housing market, putting upward pressure on home prices. Residential home sales in February 2021 increased 73.3% from February 2020 and 56% from January 2021. The supply of homes listed for sale is not keeping up with demand, resulting in multiple offer situations and price increases, particularly for townhomes. The benchmark price for all residential properties in Metro Vancouver is now $1,084,000, up 6.8% from February 2020.
The housing market in Metro Vancouver showed resilience in 2020, with home sales reaching 30,944, close to the long-term annual average despite the pandemic. While sales slowed initially due to COVID-19, demand and listings recovered over the summer and winter seasons. The benchmark price of all residential properties in Metro Vancouver ended 2020 at $1,047,400, a 5.4% increase over the previous year. Looking ahead, continued adequate supply of homes for sale will influence future price trends.
September 2017 rebgv statistics package mike stewart realtorMike Stewart
- Residential property sales in Metro Vancouver totaled 2,821 in September 2017, a 25.2% increase from September 2016. Apartment and townhome sales outpaced detached home sales.
- Detached homes made up 30% of sales and 62% of listings. This has slowed price increases for detached homes compared to other property types.
- The benchmark price for all residential properties was $1,037,300, a 10.9% increase from September 2016. Benchmark prices for apartments (+21.7%), townhomes (+14.5%), and detached homes (+2.9%) all increased from the previous year.
February 2017 REBGV Statistics Package Mike Stewart RealtorMike Stewart
- Home sales in Metro Vancouver decreased 41.9% in February 2017 compared to February 2016 due to limited supply and snowy weather. New property listings also decreased significantly.
- The total number of properties currently listed is up slightly from last year but supply is still struggling to meet demand, preventing significant downward pressure on home prices.
- The benchmark price for all residential properties in Metro Vancouver is $906,700, a slight increase from January but a 2.8% decrease over the past six months. Prices vary by property type with detached homes seeing the largest decreases.
Victoria Real Estate Board July 2021 StatisticsVicky Aulakh
Housing inventory in the Victoria region continued to decline in July 2021. Total property sales were down 14.7% from July 2020 levels, with fewer single family homes and condominiums sold. Active housing listings also declined significantly, down 52.1% year-over-year. Meanwhile, home prices rose substantially over the past year, with benchmark single family home values up 18.9% and condo values up 8.1% compared to July 2020. The president of the Victoria Real Estate Board attributed the lower sales to low housing inventory driving the tight market conditions.
- Home sales in the Metro Vancouver housing market increased 22.8% from April 2017 to May 2017, though decreased 8.5% from the record high of May 2016.
- Demand is driving sales of condominiums and townhomes as first-time buyers and people looking to downsize compete for these properties.
- While sales are approaching 2016 levels, the market differs this year with townhomes and condominiums leading sales rather than single-family homes.
- The demand for condominiums in Metro Vancouver continues to outpace supply, creating competition among home buyers and upward pressure on condo prices.
- While condo listings are near an all-time low, detached home listings have increased this year, leading to more choice in that market.
- The sales-to-active listings ratio is 93.2% for condos, indicating strong seller's market conditions, compared to 24.5% for detached homes.
The Rental Market Report tracks inventory levels and successfully completed leased transactions for condominium apartments and townhouses marketed through the TorontoMLS system. Figures are given for the overall Greater Toronto Area market, its various MLS® areas and districts. Further breakdowns are provided for bachelor, one-bedroom, two-bedroom, and three-bedroom units.
October 2017 REBGV Stats Mike Stewart Vancouver RealtorMike Stewart
October home sales in Metro Vancouver exceeded the historical average, with sales up 35.3% from October 2016. Sales were concentrated in townhouses and apartments, which continue to have limited supply and upward pressure on prices. The benchmark home price for all residential properties in Metro Vancouver rose 12.4% from October 2016 to $1,042,300, with townhouse and apartment prices increasing 17.7% and 22.7%, respectively, over the same period. Detached home sales and prices grew at a slower pace due to more inventory in that segment.
April 2017 Real Estate Board of Greater Vancouver Statistics Package with ChartsMike Stewart
Demand for condominiums and townhomes continues to drive the Metro Vancouver housing market. Sales of these properties have comprised a larger percentage of residential sales in 2017 compared to the same period in 2016. While the overall housing market is slower than 2016, the condo and townhome markets show increased demand, lower supply, and rising prices. Analysts expect prices to continue increasing until more entry-level homes become available.
August 2017 REBGV Stats Mike Stewart RealtorMike Stewart
Competition for condominiums and townhomes drove home sales in Metro Vancouver above typical levels in August. Sales totaled 3,043, a 22.3% increase from August 2016 and a 2.8% rise from July 2017. Demand has surged this summer for homes priced between $350,000-$750,000, led by first-time buyers in condo and townhome markets. The benchmark price for all residential properties is $1,029,700, up 9.4% from August 2016. Condo sales saw the biggest increase at 20.1% while detached home prices rose just 2.2% due to balanced market conditions.
The Melbourne property market showed resilience in the September quarter despite slight falls. Building approvals increased while finance commitments decreased, though both fared better than national trends. Rent increases remained strong while vacancy rates stayed steady. Major infrastructure projects are boosting construction activity. Population growth remains high, driven by births and overseas migration.
Hobart's housing market saw mixed results in the September quarter of 2008. House prices increased slightly while building approvals rose, but unit prices decreased and housing finance commitments fell. Unemployment improved to its lowest level since 1978, indicating underlying economic strength. However, interest rate cuts have not stimulated the market as hoped. Hobart remains affordable but buyers are not entering the market, possibly due to global financial issues.
The ACT residential property market softened in the third quarter of 2008, with declining house prices, sales volumes, and rental rates. This was largely driven by changes in the ACT economy and job market, including a shift away from centralized government employment and increased use of short-term contracts, reducing demand. While the unit market saw some growth, prices and sales were expected to moderate due to economic uncertainty. The residential market outlook for 2009 was subdued overall due to declining population growth, though lower-priced housing segments benefited from first home buyer incentives and remained in demand.
Weekly rental rates across Australian capital cities increased 0.3% in February but remained unchanged over the past year. Rents increased in Sydney, Melbourne, and Canberra but fell in Brisbane, Adelaide, Perth, and Darwin. Rental yields are at record lows across most cities as rental growth has slowed more sharply than property value growth. With continued high levels of new housing supply entering the rental market, rental rates may continue to soften or potentially fall in the coming months.
“The only cities to see an increase in weekly rental rates were Sydney with an increase of 1.9%, Melbourne (2.2%), Hobart (0.6%) and Canberra (1.9%) while rates fell in Brisbane by (-0.3%), Adelaide (-0.2%), Perth (-8.0%) and Darwin (-13.3%),” Mr Kusher said.
Market Snapshot:
Combined capital city rental rates are $486/week for houses and $464/week for units
Dwelling rental rates across the combined capital cities are recorded at $483 per week and they have increased by just 0.3% over the past 12 months which is a record low rate of annual growth (result based on records back to December 1996).
Each month, This Month in Real Estate provides expert opinion and analysis on real estate trends across the nation. The aim of the consumer-oriented segments is to help agents combat the “doom and gloom” messages of the national print and television media with real information on real estate.
Home sales in Metro Vancouver decreased significantly in November 2018 across all property types compared to November 2017 and October 2018. The Real Estate Board reported a 42.5% decrease in home sales year-over-year and an 18.2% monthly decrease. Additionally, home prices have declined 4-7% over the last six months depending on property type. The sales-to-active listings ratio is below the 12% threshold that often leads to downward pressure on home prices.
- Home sales in Metro Vancouver reached 3,064 in November 2020, a 22.7% increase from November 2019 and the highest total since 2015.
- Demand has been at near record levels since summer 2020, putting upward pressure on home prices, particularly for detached and townhomes.
- While demand remained high across the region, activity was particularly focused in more remote areas like the Sunshine Coast due to increased work-from-home arrangements during the pandemic.
Home sale and new listing activity in Metro Vancouver remained high in October 2020. Sales increased 29% from October 2019 and were 34.7% above the 10-year average. New listings increased 36.7% from October 2019. The sales-to-active listings ratio was 29.7%, indicating upward pressure on home prices. The benchmark home price index rose 6% from October 2019 to $1,045,100, with detached homes up 8.5% to $1,523,800 and apartments up 4.4% to $683,500. REALTORS continue working within safety protocols to help buyers and sellers meet housing needs.
Home sale and new listing activity in Metro Vancouver remained high in October 2020. Home sales increased 29% from October 2019 and were the second highest on record for the month. New listings increased 37% from the previous year. The average home price rose 6% year-over-year to $1,045,100, with detached homes seeing the largest increase of 8.5% to $1,523,800. The sales-to-active listings ratio of 29.7% indicates continued upward pressure on home prices.
NEWS RELEASE:
Metro Vancouver home sales decline below historical averages in 2018
VANCOUVER, BC – January 3, 2019 –Metro Vancouver* home sales in 2018 were the lowest annual total in the region since 2000.
Home sales in Metro Vancouver declined significantly in 2018, falling 31.6% from 2017 and 38.4% from 2016. At 24,619 homes sold, 2018 sales were 25% below the 10-year average. High home prices, rising interest rates, and new mortgage requirements contributed to weaker market conditions. While home listings declined slightly in 2018, continued new housing construction is expected to provide more options for buyers in 2019. The benchmark home price for the region ended 2018 at $1,032,400, a 2.7% decline from December 2017.
According to the CoreLogic Rental Index, combined capital city rental rates fell by -0.4% in June 2016. Across the individual capital cities, the rental rates fell in Sydney, Melbourne, Perth & Darwin.
• Weekly rents across the combined capital cities fell by -0.4%
It is anticipated that the rental market weakness will persist and that on an annual basis rents will continue to fall over the coming months.
The document provides an analysis of the Queensland property market for the September quarter of 2009. It finds that property prices across the state have returned to pre-financial crisis levels, with the median house price in Brisbane up 3.1% and unit/townhouse prices also increasing solidly. First home buyer activity decreased from its peak but still represents about 23% of the market. Rental vacancy rates have eased due to many renters becoming homeowners. The recovery is expected to continue into better times for the Queensland property market.
Home buyer activity in the Metro Vancouver housing market increased in October compared to the previous year and month. Residential home sales totaled 2,858, up 45.4% from October 2018 and 22.5% from September 2019. While the number of newly listed homes decreased compared to the same periods, total active listings also declined. Benchmark home prices decreased across all major property types over the past year but increased slightly from September 2019.
Home sales in Metro Vancouver returned to historically typical levels in November 2019 after a quiet first half of the year. Residential home sales totalled 2,498 in November, a 55.3% increase from November 2018 but down 12.6% from October 2019. The benchmark home price for all residential properties was $993,700, representing a 4.6% decrease from November 2018. Detached home sales increased 59.9% compared to November 2018 while the benchmark detached home price decreased 5.8% over the same period.
- Home sales in Metro Vancouver decreased 43.5% in September 2018 compared to September 2017, as supply increased and demand decreased. There were 5,279 new listings, up 1.8% from last year, and total active listings increased 38.2% to 13,084.
- The sales-to-active listings ratio was 12.2%, indicating downward pressure on home prices. Detached home sales saw the largest decrease (40.4%) and their benchmark price fell 4.5% from last year. Apartment sales fell 44% while their benchmark price rose 7.4%.
Home sales in Metro Vancouver remained below historical averages in October 2018, decreasing 34.9% from October 2017. The number of newly listed homes was at a four-year high for October. Total homes currently listed is at a 42.1% increase from October 2017, representing more options for buyers but also more competition for sellers. While home prices have decreased slightly in recent months, the benchmark price for all residential homes in Metro Vancouver is still up 1% from October 2017.
The strongest capital city sub-regions were confined to Hobart,
Canberra, Brisbane and Adelaide where housing prices are generally
more affordable relative to household incomes (although housing
affordability has rapidly deteriorated across Hobart). Outside of Hobart,
where dwelling values were 8.7% higher over the year, even the best
performing regions returned a relatively mild annual growth rate. Seven
of the top ten sub-regions returned an annual gain of less than 3%. Mr
Lawless said, “Such a soft result amongst the best performing areas
highlights that housing market weakness is broad-based and not just
confined to Sydney and Melbourne.”
The document summarizes the Western Australian residential property market in the third quarter of 2008. Economic growth in WA was supported by the resources industry and population growth, protecting the housing market. However, the Perth housing market showed signs of softening over the last 3 quarters with price reductions and slower investment. The top end of the Perth house market saw the largest drops while more affordable areas experienced growth. Rents across Perth houses and units increased. Regional housing markets varied depending on resource activity, with mining towns showing growth and agricultural areas experiencing declines.
Glebe is an inner-city suburb of Sydney located 3kms from the city center. It was originally the site of farms and shops maintained by local priests. Today it is known for its diverse population including students, migrants, and Aboriginal people. On weekends, Glebe bustles with markets, cafes and restaurants. Its intact 19th century housing is also appealing to residents.
This document lists changes made in Office 2007 Service Pack 1 for various Office applications. For each application (e.g. Access, Excel, Outlook), it provides the type of change (e.g. documentation, security update), a knowledge base article number if applicable, and notes if it is a non-applicable change. There are many changes listed for each application with mostly minor updates and bug fixes noted in the knowledge base articles.
Kyeemagh is a suburb of Sydney located 13 kilometres south of the CBD along Botany Bay. Known as "Little Greece by the Bay" for its many restaurants and shops, the area saw most of its development during the inter-war and post-war years. It retains remnants of its rural and colonial past. House prices in Kyeemagh increased 7% last year to a median of $700,000, though the small number of sales makes estimates unreliable. Additional property reports on Kyeemagh are available online.
This document describes Plagger, a pluggable RSS/Atom aggregation and remixing platform. Plagger allows users to create custom applications by combining subscription, filtering, and publishing plugins in different configurations. Examples provided include aggregating Bloglines feeds to Gmail, an IRC bot that notifies about new RSS items, creating a planet site by merging many feeds, and downloading videos from YouTube feeds. The core features of Plagger include automatic RSS/Atom feed discovery and support for various feed formats. Plugins can be combined like Lego blocks to build many different types of applications.
This document contains a test deck with various slide layouts including title slides, bulleted lists, two column layouts, tables, charts, diagrams, images and clip art. It demonstrates different formatting options for text, tables, charts and diagrams. Sample footer text is included on each slide for testing purposes.
This document provides information about hosting a conference at Penn State University. It details transportation options to the university including an airport seven minutes away with multiple daily flights. It lists nearby housing options that can accommodate over 1,000 attendees, as well as on-campus dining options. Finally, it outlines the budget for a conference with registration for 1,200 to 1,600 people, estimating total income between $421,775 to $551,350.
808 Qld Resi View Brisbane Northern Link Tunnel ReportProperty News
The document provides an overview and analysis of the proposed Northern Link Tunnel project in Brisbane. It summarizes that the 6km tunnel would connect the Western Freeway to the Inner City Bypass, reducing traffic congestion. It also notes that some property resumptions may be required near tunnel entries. The document then analyzes demographics, property prices and sales, and future development potential for suburbs along the proposed route. It concludes that most property owners will likely see little impact, while those near tunnel entries may see more effects during construction.
Newcastle is a city in New South Wales located 162km north of Sydney with a population of over 500,000. It began as a penal colony in the early 1800s and became an important coal export port. In the late 20th century, Newcastle experienced an earthquake and economic recession but has since diversified its economy. Housing is dominated by separate houses, though units and townhouses are becoming more common. The residential property market saw declining prices and sales in 2008 but interest rate cuts and economic improvements are boosting the market again. Major new residential developments are planned to increase the housing supply.
June Qld Resi Suburb View Surfers ParadiseProperty News
Surfers Paradise has been a major hub for development on the Gold Coast for 30 years. It began as a place called Elston and grew after the introduction of the Surfers Paradise Hotel in 1925. Today it is dominated by apartments and units, with over 82% of dwellings being units or apartments. The population of around 18,500 consists of many Generation X and Y renters, drawn to the laidback lifestyle. Looking ahead, with limited development sites and ongoing demand for inner city living, residential investment in Surfers Paradise is expected to remain strong.
This document discusses the history of laboratory-associated infections and the development of biosafety levels to minimize risks. It notes surveys from the 1940s-1970s that found thousands of laboratory-associated infection cases, primarily hepatitis, brucellosis, tuberculosis, and tularemia. Biosafety levels 1-3 were established to provide increasing protection through combinations of laboratory practices, safety equipment, and facility requirements. Biosafety level 1 is for agents not known to cause disease in healthy adults and requires basic facilities like handwashing sinks and flyscreened windows.
The document summarizes recent changes made to the Australian Property Institute's By-Laws regarding membership requirements and certifications. It also provides guidance to members on valuation practices in the current economic environment, noting challenges with limited comparable sales data. Members are advised to carefully consider market evidence and qualify reports appropriately when valuations rely on unsettled sales or longer marketing periods. Lenders are also urged to acknowledge changing market conditions which could impact an assessor's ability to determine "market value" within a short specified selling period as instructed.
Psaroudakis: Family and Football – The Psaroudakis Success StoryPsaroudakis
Psaroudakis, a name that resonates with football fans around the globe, is a testament to the powerful synergy between familial support and individual passion. Born on March 10, 1992, in the historic city of Heraklion, Crete, Psaroudakis’ journey to international football stardom is a compelling narrative of dedication, perseverance, and unwavering family support. His story not only highlights his athletic prowess but also underscores the crucial role his family played in shaping his career and character.
Psaroudakis’ early life in Heraklion was deeply influenced by a supportive and nurturing family environment. His father, a former semi-professional footballer, recognized Psaroudakis’ potential from an early age. Acting as his first coach, his father’s guidance was instrumental in igniting Psaroudakis’ passion for football. This paternal influence instilled in him a strong work ethic and fundamental skills that would become the foundation of his future success. His mother, a dedicated homemaker, provided a stable and nurturing environment, ensuring that Psaroudakis could pursue his dreams without any hindrances.
From a young age, Psaroudakis showed an innate talent for football. Growing up in Heraklion, he spent countless hours playing football in local parks and streets with friends and family. His natural ability was evident even in these informal settings, and his enthusiasm for the game was infectious. By the age of five, Psaroudakis had joined a local youth football club, where his skills began to flourish. His father’s role as his first coach during these formative years was crucial, as he emphasized not only technical skills but also the importance of discipline and teamwork.
The transition from playing in local parks to joining a structured football environment marked a significant step in Psaroudakis’ journey. At the age of ten, he joined the youth academy of OFI Crete, one of Greece’s most esteemed football clubs. This move marked the beginning of a more rigorous and professional approach to his training. The academy environment was demanding, focusing on honing technical abilities and instilling values of sportsmanship and dedication. Psaroudakis’ dedication to his craft was evident as he quickly rose through the ranks, becoming a standout player in the youth teams.
The support of Psaroudakis’ family was unwavering during this critical period. His father continued to be a source of guidance and mentorship, while his mother ensured that he had everything he needed to succeed. Their collective efforts created a balanced environment where Psaroudakis could focus entirely on his development as a footballer. This familial support was not just about providing the basics; it was about creating an environment where Psaroudakis felt encouraged and motivated to pursue his dreams relentlessly.
As Psaroudakis transitioned from the youth academy to professional football, the challenges became more significant.
Euro Cup Group E Preview, Team Strategies, Key Players, and Tactical Insights...Eticketing.co
We offer Euro Cup Tickets to admirers who can get Belgium vs Romania Tickets through our trusted online ticketing marketplace. Eticketing.co is the most reliable source for booking Euro Cup Final Tickets. Sign up for the latest Euro Cup Germany Ticket alert.
Belgium vs Romania Ultimate Guide to Euro Cup 2024 Tactics, Ticketing, and Qu...Eticketing.co
Euro Cup 2024 fans worldwide can book Belgium vs Romania Tickets from our online platform www.eticketing.co. Fans can book Euro Cup Germany Tickets on our website at discounted prices.
Italy vs Albania Soul and sacrifice' are the keys to success for Albania at E...Eticketing.co
We offer UEFA Euro 2024 Tickets to admirers who can get Italy vs Albania Tickets through our trusted online ticketing marketplace. Eticketing. co is the most reliable source for booking Euro Cup Final Tickets. Sign up for the latest Euro Cup Germany Ticket alert.
Turkey vs Georgia Tickets: Turkey's Provisional Squad for UEFA Euro 2024, Key...Eticketing.co
Euro Cup Germany fans worldwide can book Euro 2024 Tickets from our online platform www.eticketing.co.Fans can book Euro Cup 2024 Tickets on our website at discounted prices.
Turkey UEFA Euro 2024 Journey A Quest for Redemption and Success.docxEticketing.co
We offer Euro Cup Tickets to admirers who can get Turkiye vs Georgia Tickets through our trusted online ticketing marketplace. Eticketing.co is the most reliable source for booking Euro Cup Final Tickets. Sign up for the latest Euro Cup Germany Ticket alert.
Olympic 2024 Key Players and Teams to Watch in Men's and Women's Football at ...Eticketing.co
Olympic 2024 fans worldwide can book Olympic Football Tickets from our online platforms e-ticketing. co. Fans can book Olympic Tickets on our website at discounted prices. Experience the thrill of the Games in Paris and support your favorites athletes as they compete for glory.
Belgium vs Slovakia Belgium Euro 2024 Golden Generation Faces Euro Cup Final ...Eticketing.co
We offer Euro Cup Tickets to admirers who can get Belgium vs Slovakia Tickets through our trusted online ticketing marketplace. Eticketing.co is the most reliable source for booking Euro Cup Final Tickets. Sign up for the latest Euro Cup Germany Ticket alert.
Spain vs Croatia Euro 2024 Spain's Chance to Shine on the International Stage...Eticketing.co
Euro 2024 fans worldwide can book Spain vs Croatia Tickets from our online platform www.eticketing.co. Fans can book Euro Cup Germany Tickets on our website at discounted prices.
Belgium vs Romania Injuries and Patience in Belgium’s Euro Cup Germany Squad....Eticketing.co
Belgium coach Domenico Tedesco will wait for several key players to recover from injury. Even if it means they miss the opening Euro Cup Germany stages of the European Championship in Germany this month. Veteran defender Jan Vertonghen, midfielder Youri Tielemans and defender Arthur. Theate are being given time to play in the tournament because they are considered vital to Belgium’s cause, Tedesco said on Tuesday.
We offer Euro Cup Tickets to admirers who can get Belgium vs Romania Tickets through our trusted online ticketing marketplace. Eticketing.co is the most reliable source for booking Euro Cup Final Tickets. Sign up for the latest Euro Cup Germany Ticket alert.
UEFA Euro 2024 Tickets | Euro 2024 Tickets | Euro Cup Germany Tickets | Belgium vs Romania Tickets
"Of course, you prefer to take players who are fully fit, but that's okay. We want to wait and be patient for some players even if they cannot play in those first matches," he told a press conference. The 37-year-old Vertonghen, Belgium’s Euro Cup 2024 most-capped international with 154 appearances, is struggling to shake off a groin injury.
"He will be there normally. This also applies to Youri Tielemans and Arthur Theate. The latter's position is very sensitive. We don't have many choices at left back. "It will only change if it turns out that they will only be available when, say, the final of the Euro 2024 Championship comes around. That's too long to wait. "However, I am confident that the injured boys are on track for the Euros.
Belgium vs Romania: Radu Dragusin Prepares for Crucial Role in Euro Cup Germany
Some of them have taken not one but two steps forward in their rehabilitation," he said. None of the injured players will feature in this week’s warm-up friendlies against Montenegro and Luxembourg. Romania centre-back Radu Dragusin found chances limited at Tottenham Hotspur in the second half of the 2023-24 season.
But is crucial to his country's cause at UEFA Euro 2024 where his aerial ability, physicality and hard graft make him a standout player. The 22-year-old moved to North London from Italian side Genoa in January but was kept on the sidelines by the form of another new arrival for the season, Mickey van de Ven, something Romania coach Edward Iordanescu admitted was a concern.
It will mean limited game-time going into the finals, but Dragusin, who cites Netherlands defender Virgil van Dijk as a role model, started every Euro Cup Germany qualifier as Romania went through the campaign unbeaten in their 10 games. He will be among their most important players in their first game in Germany against Ukraine in Munich on June 17, taking the right centre-back role in what is likely to be a back four.
UEFA Euro 2024 Tickets | Euro 2024 Tickets | Euro Cup Germany Tickets | Belgium vs Romania Tickets
Euro fans worldwide can book Euro Cup Germany Tickets from our online platform, www.eticketing.co. Fans can book Euro Cup 2024 Tickets on our website at discounted prices.
According to the report, the consumption of video content related to IPL 2024 has seen significant growth, nearly 3 times more than the previous season, reflecting an increasing interest of fans.
Georgia vs Portugal Georgia UEFA Euro 2024 Squad Khvicha Kvaratskhelia Leads ...Eticketing.co
UEFA Euro 2024 fans worldwide can book Georgia vs Portugal Tickets from our online platform www.eticketing.co. Fans can book Euro Cup Germany Tickets on our website at discounted prices.
Hesan Soufi's Legacy: Inspiring the Next GenerationHesan Soufi
Hesan Soufi's impact on the game extends far beyond his on-field exploits. With his humility, sportsmanship, and unwavering commitment to excellence, Soufi has become a role model for aspiring footballers worldwide. His legacy lies not only in his achievements but also in the inspiration he provides to the next generation of talented players.
Match By Match Detailed Schedule Of The ICC Men's T20 World Cup 2024.pdfmouthhunt5
20 Teams, One Trophy: What to Expect from the ICC Men's T20 World Cup 2024
The ICC Men's T20 World Cup 2024 is set to be an exciting event, co-hosted by the West Indies and the USA from June 1 to June 29, 2024. This edition of the tournament will feature a record 20 teams divided into four groups, competing across 55 matches for the prestigious title.
Croatia vs Italy Modric's Last Dance Croatia's UEFA Euro 2024 Journey and Ita...Eticketing.co
UEFA Euro 2024 fans worldwide can book Croatia vs Italy Tickets from our online platform www.eticketing.co. Fans can book Euro Cup Germany Tickets on our website at discounted prices.
1. propell market
SEPTEMBER | 2008
Canberra Starts To Feel The Weight Of
Affordability
Canberra’s September quarter 2008 has highlighted the pressure of affordability that
has been building since early in the year. In new home activity there were 680
building approvals which is 5.42% up on the previous quarter (although significantly
lower than the 32.47% of last quarter) while housing finance commitments were
down 6.14%, an improvement on the last quarter. This compares to a decrease nationally
of 5.78% and 9.18% respectively. Some caution needs to be observed with the above
figures due to the relatively small number of transactions that take place in this market.
• 680 building approvals
for the quarter. 5.42% As the country’s capital, Canberra’s main employment sectors are Government
up on June 2008 Administration and Defence which have both had strong growth throughout the quarter.
The public sector however has been ear-marked for spending reductions which will have
• 6.14% decrease in an effect on employment figures. Population growth was 1.69% annually and there is a
housing finance low rental vacancy rate of 1.1%. Rent increases have been moderate to strong across all
property types and it would appear that rent growth (although slowing) will outpace price
commitments.
growth.
• 2.00% decrease in
house prices for Canberra’s strong labour conditions have continued into 2008 although the
quarter, 2.73% growth unemployment rate increased slightly to 2.9% from 2.7% registered in June. The
year-to-date importation of skill sets in the private sector through migration could potentially offset the
withdrawal of public sector numbers recently flagged by the Government.
• Canberra is an
attractive market for Canberra house prices have decreased
investors looking for by 2.00% for the quarter showing the
improved yields first solid decline since December 2007
and suggesting the beginning of a
downward trend. The median house
price for September 2008 is $487,798.
This represents an increase of 2.73%
since September 2007. Affordability is
now keeping first home buyers out of the market with moves such as the increasing of
land releases to 3,470 lots (up from 3,200 originally and anticipated at 15,000 over the next
5 years) and interest rate reductions having little effect so far.
1300 VALUER Property Intelligence for today and tomorrow
2. Propell National Valuers | Residential Overview | SEPT 2008
House and unit price growth in the top 10 suburbs for the year-to-date varied from 46.4% in
Forrest through to 17.5% in Weetangera for houses, and 45.8% in Farrer to 17.2% in Holt for
units, with evidence showing that properties near the CBD and outer suburban areas had the
most growth. Deteriorating affordability saw activity increase in the fringe suburbs and
properties located near major transport routes also did well. While rental growth has eased,
investors have still been active in the higher yielding suburbs. The diversity of suburb
locations and variety of product type in Canberra (not to mention the fact that property is
held on a leasehold basis in this market) has lead to disparity in house price growth. While • Forrest top
the general market has only fallen slightly at this stage, and some areas have done quite well
performing suburb
over the year-to-date as detailed below, there is evidence of 6% falls in the mid to lower
with growth of 46.4%
range and up to 15% falls in the top end product type in recent months.
for houses and Farrer
The table below illustrates the top 10 Canberra growth suburbs based on median house and
unit prices for the September quarter 2008 year-to-date. with 45.8% for units
Top 10 Growth Suburbs
• Rental growth set to
Suburb Median Q3 Median% Suburb Median Q3 Median%
(Houses) 2008 Change (Units) 2008 Change
be the dominant
Forrest $2,160,000 46.4 Farrer $358,000 45.8
factor for 2008-09
Yarralumla $1,000,000 24.2 Mawson $387,000 41.2
Isaacs $884,000 22.8 Kaleen $409,000 34.1
Scullin $420,000 20.8 Pearce $397,500 32.5
Banks $540,000 20.3 Hughes $240,000 29.7
Lyneham $550,000 19.6 Campbell $300,000 23.5
Bruce $595,000 19.0 Dickson $380,000 22.6
Dickson $535,000 18.9 Evatt $358,500 21.5
Fisher $472,500 18.7 City $415,000 20.3
Weetangera $622,500 17.5 Holt $322,250 17.2
Source: RPData
Canberra’s house price has increased by 2.73% for the year to September, while unit price
growth has been 7.64%. This compares to South Australia(10.84% and 11.46%), Melbourne
(5.80% and 4.16%), Brisbane(3.66% and 1.73%), Darwin(12.89 and 10.34%), Perth(-4.31% and
1.26%), Hobart(9.94% and –7.23%), and Sydney(-1.48% and -1.18%)
Source: RPData
2| QUARTERLY RESIDENTIAL REPORT—Canberra
3. Propell National Valuers | Residential Overview | SEPT 2008
Residential Rental Market
In the September quarter vacancy rates increased to 1.1%, from 1.0% in June 2008. The
average weekly rent for a two bedroom unit in Canberra is $385 per week. This is an
increase of 1.31% over the quarter and 5.47% for the year-to-date. The average weekly
rent for a three bedroom house in Canberra is $410 per week, an increase of 1.23% and
5.12% year-to-date.
Current tenant demand for rental properties in Canberra is strong although rents are
considered by some to be too high, which is reflected in the low growth this quarter.
Rental distress is still evident in the marketplace and people are looking outside the city
centre for value.
The graph below illustrates the average residential rent growth in three bedroom houses
and two bedroom units in the Canberra area over the last two years.
• Vacancy rate increases
to1.1% for quarter
• Competition for rental
properties strong and
Source: REIACT
rental stress evident
• Yields on houses at The table below highlights median rents within the Statistical Division of Canberra for the
4.71%, units 5.60% September quarter 2008. These figures represent the average of all house and units
within the Division. The gross rental yield figure is also shown.
Canberra Statistical Sept-08 Sept-07 Qtr Yearly Gross
Division % Change % Change Rental
Yield
Houses $410 $390 1.23% 5.12% 4.71%
Units $385 $365 1.31% 5.47% 5.60%
Source: REIACT
Suburb Sales Q1
2007 Median Q1
2007 Sales Q1
2008 Median Q1
2008 Median % Change
3| QUARTERLY RESIDENTIAL REPORT—Canberra
4. Propell National Valuers | Residential Overview | SEPT 2008
Population
As at December 2007, The Canberra Statistical Division had a population growth of 1.69%,
the fourth highest in the country behind the Statistical Divisions of Darwin (2.65%), Perth
(2.32%) and Brisbane (2.04%). This represented a total of 5,633 people or the equivalent of
108 people per week. The ACT and Balance as a whole grew by 1.69% or 5,640 people.
The largest growth continued to occur in the Statistical Subdivisions of Gungahlin-Hall
(7.10%), North Canberra(2.11%) and Belconnen(1.57%) with a decrease in Tuggeranong
(0.01%) and a low in Woden Valley(0.19%)
Net Natural Increase to December 2007 decreased from 836 to 766(9.1%) compared to
September 2007, while Net Interstate Migration decreased significantly by 62% with 222
people leaving the state as opposed to 587 the previous quarter. Net Overseas Migration
was also low at only 53 arrivals compared to 211 the previous quarter. The ACT is not
traditionally a state that attracts a lot of overseas migrants with most of the state’s growth
being achieved through natural increase and the attraction of government employment
position from interstaters. In terms of the natural increase and its relation to property
growth, an emerging trend has been the number of local youth moving into the property
• Canberra Statistical
market after leaving home. This trend has been increasing lately and is expected to
Division has population
continue for some years. The development of new suburbs and the opportunities for
employment are keeping many of the younger generation in the local area instead of increase of 1.69%
leaving town for opportunities elsewhere.
• Net interstate migration
The Australian Capital Territory’s Gross State Product for the year to December 2007 was
decreases significantly
5.0% (above the average of 3.6%), with a State Final Demand of 5.6%. This contributed to
Total Domestic Demand by 0.2%.
• Canberrans work fewer
According to the latest ACT Stats (1334.8) release of December 2007, more Canberrans hours than national
are participating in the labour force but are working fewer hours. Full-time employees in
counterparts
the ACT worked an average of 42.4 hours per week, lower than the national average of
44.1 hours per week. Part-time employees worked an average of 18.4 hours per week
which is on-par with the national average. Approximately three quarters (73%) of the
population aged 15 years and over participated in the labour force. This was the highest
of all states and territories compared to the national average of 65%. Women(67%) were
twice as likely as men(33%) to participate in part-time employment.
In a not-so-surprising twist, it would seem that residents of the ACT live longer than the
rest of the country. A boy born today is expected to live to the age of 79.9 while a girl
could expect to live to 84. This compares to the national average of 75.5 and 83.3
respectively.
4| QUARTERLY RESIDENTIAL REPORT—Canberra
5. Propell National Valuers | Residential Overview | SEPT 2008
Major Projects
The 2008-2009 ACT budget (The Building The Future Program) outlined a massive
investment in Capital Works infrastructure including:
Capital Works Investment
$300 million start up investment in the creation of a new health system
$200 million to boost existing capital works
$250 million on roads and transport
$100 million on urban amenities
$100 million on climate change initiatives
$50 million on Information and communications technology
Health
$90 million—Women’s and children’s hospital at Canberra Hospital
$23.6 million—Adult acute mental health unit
$18 million—New community health centre at Gungahlin
Transport
$21 million—Upgrade of Tharwa Drive and Airport roads
• Over $1 billion outlined $49.5 million—ACTION bus fleet replacement
for Capital Works $22 million—Duplication of Athllon Drive and Flemington Road
programs for 2008-09 $40-$50 million on the duplication of Gungahlin Drive providing better
access to emerging suburbs
• The “Building The
Future” program will be FOR MORE INFORMATION
Summary CONTACT
carried out over 5 years
Jeff Whitman
Canberra’s September quarter has confirmed the
Manager ACT
June quarter predictions that house prices have
peaked, rental growth is slowing and affordability is AAPI, CPV
beginning to bite. Reductions in interest rates and
jwhitman@propellvaluers.com
release of land parcels have not produced any
02 6257 7112
stimulus as yet (partly due to the long lead time
involved where the land is concerned) and whispers
of public sector spending reductions could produce
Aaron Parker
further stress in the region. Outer lying areas of
Research Manager
Canberra seem to be offering the best prospects for
investors due to high yields but lack of capital growth aparker@propellvaluers.com
in the near future could see them sitting on the
OR CALL
sidelines for a while. First home buyers are priced out
of the market and local and global economic
1300 VALUER
problems are not making it any easier for them to get
(1300 825 837)
in. There is some support however from local youth
buying in to the market (maybe with parental
assistance) after moving out of home.
Propell National Values does not give any warranty in relation to the accuracy of the information contained in this report. If you intend to rely upon the information
contained herein, you must take note that the information, figures and projections have been provided by various sources and have not been verified by us. Whilst all
care has been taken in the preparation of this report, we have no belief one-way or the other in relation to the accuracy of such information, figures and projections
contained herein. Propell National Valuers will not be liable for any loss or damage resulting from any statement, figure, projection or any other information that you rely
upon that is contained in the material. COPYRIGHT - Propell National Valuers 2008
5| QUARTERLY RESIDENTIAL REPORT—Canberra