SlideShare a Scribd company logo
1 of 5
Download to read offline
Total Residential 
Single Family 
Apartment Condo
Attached
2015
Total Residential 
Single Family 
Apartment Condo 
Attached
- Calgary Real Estate Market -
REPORTING PERIOD: from the 1st of May, 2015 to the last day of May, 2015
Real Estate and Economic Report
Sales New Listings
Sales to New
Listings Ratio
Active Listings Average Price
AVERAGE Y/Y% AVERAGE Y/Y%TOTAL Y/Y% TOTAL Y/Y% AVERAGE Y/Y%
5,342 ‐30.72% 478,780$     ‐0.98%2,190 ‐44.15% 3,161 ‐47.64% 69.28% 6.67%
1,366 ‐32.54% 1,879 ‐36.20% 72.70% 5.73% 2,913 ‐0.21% 541,582$     ‐2.36%
359 ‐29.75% 611 ‐24.00% 58.76% ‐7.55% 1,293 23.03% 328,531$     3.98%
465 122.49% 671 16.09% 69.30% 91.65% 1,136 114.74% 410,336$     13.49%
YEAR TO DATE (2015): from January, 2015 to May, 2015
TOTAL Y/Y% TOTAL Y/Y% AVERAGE Y/Y%
8,026 ‐43.72% 15,599 ‐28.35% 51.60% ‐20.81% 5,349 ‐2.96% 469,302$     ‐1.12%
AVERAGE Y/Y% AVERAGE Y/Y%
4,871 ‐35.12% 8,946 ‐17.66% 54.31% ‐21.04% 2,881 36.46% 537,290$     ‐1.71%
1,428 ‐31.18% 3,318 3.27% 44.08% ‐31.33% 1,285 66.93% 329,874$     ‐2.66%
1,510 9.34% 2,740 24.72% 55.35% ‐14.50% 1,151 192.90% 407,584$     12.38%
In Feb. 2015 the Calgary Real Estate Board put the statisitics for semi‐detached homes and row townhouses together in a group called 
"Attached".  Apartment condo's and attached homes account for the highest year over year increase in listings not single family homes.  In 
fact for the month of May Single Family home active listings were dowm ‐0.21% year over year for the month of May.
Even with lower sales and lower listings the annual cycle looks the same. There is no glaring diversion from the annual cycle as of
yet other than the lower sales and lower listings. July may see new listings increase as expried contracts come due and re-list.
Even with the slight dip in the average single family home price we are still way ahead of where average prices for single family
homes were in 2013. The next few months will clarify if we are to stay on a downward trend or hold steady.
$459,035  $465,202  $479,880 
$517,333 
$552,276  $537,290 
 $250,000
 $350,000
 $450,000
 $550,000
 $650,000
2010 2011 2012 2013 2014 2015 YTD
Single Family Home Annual Average Price (Calgary)
0
1000
2000
3000
4000
5000
6000
7000
8000
9000
Single Family Home Comparisons (Calgary)
Sales (Total) New Listings (Total) Active Listings (Avg.)
Total Residential 
Single Family 
Condo 
Townhouse 
2015
Total Residential 
Single Family 
Condo 
Townhouse 
Sales to New 
Listings Ratio
Average Price
- Edmonton Real Estate Market -
TOTAL Y/Y% AVERAGE Y/Y% AVERAGE
REPORTING PERIOD: from May, 2015 to May, 2015
Sales New Listings
Y/Y%
1,784 ‐9.85% 3,314 ‐2.18% 53.83% ‐7.84% 381,111$     
TOTAL Y/Y%
2.48%
1,078 ‐11.13% 1,974 ‐5.32% 55.00% ‐5.17% 451,312$      1.73%
510 ‐9.73% 1,047 5.86% 49.00% ‐14.04% 256,143$      1.77%
165 4.43% 219 ‐3.95% 75.00% 8.70% 345,659$      ‐1.61%
TOTAL Y/Y% AVERAGE Y/Y%
YEAR TO DATE (2015): from January, 2015 to May, 2015
AVERAGE Y/Y%
6,431 ‐13.25% 14,483 14.03% 43.17% ‐25.27%
TOTAL Y/Y%
371,242$      2.56%
3,892 ‐13.68% 8,547 11.87% 44.20% ‐24.57% 437,356$      1.80%
1,832 ‐16.61% 4,482 15.63% 40.20% ‐27.96% 251,225$      3.06%
586 5.97% 1,097 30.29% 53.40% ‐17.85%
We are currently sitting at the same average days on market as existed in the summer of 2014 when the market was extremely
hot. Will July and August put the heat on stale listings or will homes ride the heat wave?
The lower total sales have not impacted the price range people are buying in. The price range to sales is proportionatly the same
year over year. Where the two graphs meet may indicate that homes previously priced from $600-$649 have moved down one
price category pushing sales up for the $550-$599 price range.
Edmonton sales have seen a slight drop off compared to a market that was heating up in 2014. The brakes were applied before
prices went to crazy and the leveling off has had a softer effect than on overall numbers compared to Calgary.
358,513$      6.13%
0
20
40
60
Average Days on Market (Calgary)
0
50
100
150
200
250
300
350
400
450
> $100 $100 ‐
$199
$200 ‐
$299
$300 ‐$
349
$350 ‐
$399
$400 ‐
$449
 $450 ‐
$499
 $500 ‐
$549
$550 ‐
$599
$600 ‐
$649
$650 ‐
$699
 $700 ‐
$799
$800 ‐
$899
$900 ‐
$999
$1M +
2014
2015
Current Month Sale Price Range (Calgary)
The annual cycle appears to be continuing on the same path as in prior years. As in previous years listings spiked in January and
March, however, they have levelled off compared to previous years.
Since 2011 the average home price in Edmonton has increased an average of just over 4% per year since 2011 with a high of
5.4% from 2013-2014
Days on market have levelled off settling at 41 days which is a reasonable amount of time that provides some balance.
$383,226  $379,485 
$392,446 
$409,438 
$431,707 
$437,356 
 $340,000
 $360,000
 $380,000
 $400,000
 $420,000
 $440,000
 $460,000
2010 2011 2012 2013 2014 2015 YTD
Single Family Home Annual Average Price (Edmonton)
543
737
989
1,084
1,264
1,136
941
854
773
782
623
419
528
648
923
1,022
1,179
1,198
1,125
983
857
863
673
436
485
747
917
1,147
1,213
1,218
1,092
924
967
850
717
439
390
547
876
1,001
1,078
1,155
1,354
1,737
1,663
1,943
1,627
1,455
1,380
1,266
1,082
769
409
955
1,115
1,467
1,569
1,911
1,586
1,491
1,349
1,268
1,059
783
415
1,070
1,082
1,585
1,818
2,085
1,828
1,602
1,353
1,337
1,256
794
534
1,298
1,428
1,883
1,964
1,974
0
500
1,000
1,500
2,000
2,500
Single Family Home Comparisons (Edmonton)
Sales (Total) New Listings (Total)
0
50
100
Average Days on Market (Edmonton)
Real GDP Change
2015Q1
Unemployment Rate
May-15
Retail Sales Growth
Apr. 2015
Job Vacancies
2015
Employees have continued to earn more money even as the Alberta Economy has slowed. This will be a good number to watch
over the next 6 months to indicate the strength of business profits in Alberta during economic recovery.
The last six months has seen a trend of closing the gap between the price in United States dollars of West Texas Iintermediate
(WTI) Oil and Western Canadian Select (WCS) bitumen. This is a big benefit of the majority of Alberta producers as WCS is what
is mostly produced in Alberta and shipped out at the US dollar rate and then converted to Candian Dollars. This means that
currently the price for WCS in Canadian dollars is about $65 per barrel, with the low Canadian dollar the Alberta producers are
feeling the benefit.
- Alberta Economic Indicators -
in Alberta
-25.68%
*the following information is based on current available data from: http://economicdashboard.albertacanada.com/, www.statcan.gc.ca/dai-quo/ and RBC Economic
Outlook.
Y/Y% TOTAL Y/Y%
Net Migration to AB
7,723 2.20%
Apr-15
34,100 1%
-0.13%
in Canada
3.30%
in Canada 954.07$
13,560 -6.43%
2.80%
1,531
Weekly Earnings
April 2015
in Canada
0.60%
-0.60%
-86.36%
-130.00%
in Alberta
in Alberta
5.80%
in Canada
-8.70%
-2.09%
-2.20%
1.71%
in Alberta -1.42%
in Canada
-158.00%
-231.24%
6.80%
11.54%
-4.23%
1,177.00$
in Alberta
Housing starts
May-15
Mortgage
Foreclosures Feb. 15
in Alberta
in Canada
$990.98
$1,034.17
$1,070.47
$1,107.97
$1,149.18
$1,177.00
$800
$900
$1,000
$1,100
$1,200
2010 2011 2012 2013 2014 2015
Alberta's Average Weekly Earnings
 $‐
 $10.00
 $20.00
 $30.00
 $40.00
 $50.00
 $60.00
 $70.00
 $80.00
 $90.00
 $100.00
 $110.00
 $120.00
WCS OIL PRICES
WTI OIL PRICES
WTI‐WCS Price Differential
WTI and WCS Pricing and Price Differential (US$)
Notes:
http://economicdashboard.albertacanada.com/
http://www.creb.com/
http://www.ereb.com/REALTORSAssociationOfEdmonton.html
http://www.capp.ca/Pages/default.aspx
http://homepriceindex.ca/hpi_tool_en.html
http://www.cba.ca/en/component/content/publication/69-statistics
http://www.finance.alberta.ca/aboutalberta/
http://www.statcan.gc.ca/dai-quo/
http://www.bankofcanada.ca/wp-content/uploads/2014/12/fsr-december2014.pdf
Resources
http://www.rbc.com/economics/economic-data/index.html
Housing prices in Canada have had more growth than income.
Low mortgage rates continue to stimulate the Canadian real estate market.
CND resale of homes has picked up in Toronto and Vancouver while they have declined in Calgary and Edmonton.
Oil and gas is employing 550,000 jobs across Canada, and 440,000 in Alberta either directly or indirectly
2013 oil and gas sector accounted for 20% of the TSX, and $69 billion in capital spending. (Statistics are from CAPP)
121,500 Albertans are directly employed in mining, oil and gas extraction sectors
Bank of Canada is monitoring 3 key factors with relation to the financial system:
1. Elevated level of household indebtedness
The current price of Western Canadian Select (WCS) crude in in Canadian dollars is trading at $10 more than the price of WCS in
January of 2013, however, compared to one year ago WCS is trading at about 31% less(US$).
2. Imbalance in the householder market
3. Investor risk taking and illiquidity in financial markets
Historically the HPI shows how Edmonton follows Calgary for price increases and decreases by about 6 months, however, that
trend broke off in 2014 likely due to the drop in oil prices. During the same 10 year period the TSX100 only increased 50%
compared to the 110% for Calgary and the 80% for Edmonton showing that real estate continues to perform stronger than the
stock market. The difference is even more drastic since 2002.
Other Bank of Canada comments:
0
50
100
150
200
250
Calgary Home Price Index
Edmonton Home Price Index
Home Price Index Comparision

More Related Content

What's hot

Economic Report August 15 2015
Economic Report August 15 2015Economic Report August 15 2015
Economic Report August 15 2015Dale Koeller
 
Fvreb may 2020 stats
Fvreb may 2020 stats Fvreb may 2020 stats
Fvreb may 2020 stats Vicky Aulakh
 
Fraser Valley Real Estate Board Statistics - November 2021
Fraser Valley Real Estate Board Statistics - November 2021 Fraser Valley Real Estate Board Statistics - November 2021
Fraser Valley Real Estate Board Statistics - November 2021 VickyAulakh1
 
Real Estate Analysis & Benchmark 121214
Real Estate Analysis & Benchmark 121214Real Estate Analysis & Benchmark 121214
Real Estate Analysis & Benchmark 121214Dean Koeller
 
FVREB October 2020 Statistics Package
FVREB October 2020 Statistics PackageFVREB October 2020 Statistics Package
FVREB October 2020 Statistics PackageVicky Aulakh
 
Fvreb August 2020 Stats Package
Fvreb August 2020 Stats PackageFvreb August 2020 Stats Package
Fvreb August 2020 Stats PackageVicky Aulakh
 
The Okanagan Statistics Package January 2022
The Okanagan Statistics Package January 2022The Okanagan Statistics Package January 2022
The Okanagan Statistics Package January 2022VickyAulakh1
 
Chmic economic report july 2016
Chmic economic report july 2016Chmic economic report july 2016
Chmic economic report july 2016Dean Koeller
 
Fraser Valley Real Estate Board Statistics Package March 2021
Fraser Valley Real Estate Board Statistics Package March 2021 Fraser Valley Real Estate Board Statistics Package March 2021
Fraser Valley Real Estate Board Statistics Package March 2021 Vicky Aulakh
 
Fraser Valley Real Estate Board November 2020 statistics package
Fraser Valley Real Estate Board November 2020 statistics packageFraser Valley Real Estate Board November 2020 statistics package
Fraser Valley Real Estate Board November 2020 statistics packageVicky Aulakh
 
Fvreb package april 2020
Fvreb package april 2020Fvreb package april 2020
Fvreb package april 2020Vicky Aulakh
 
FVREB September 2021 Statistics Package
FVREB September 2021 Statistics PackageFVREB September 2021 Statistics Package
FVREB September 2021 Statistics PackageVickyAulakh1
 
Fraser Valley Real Estate Board Statistics Package October 2021
Fraser Valley Real Estate Board Statistics Package October 2021Fraser Valley Real Estate Board Statistics Package October 2021
Fraser Valley Real Estate Board Statistics Package October 2021VickyAulakh1
 
FVREB April 2021 Statistics Package
FVREB April 2021 Statistics PackageFVREB April 2021 Statistics Package
FVREB April 2021 Statistics PackageVicky Aulakh
 
Feb 20 package fvreb
Feb 20 package fvrebFeb 20 package fvreb
Feb 20 package fvrebVicky Aulakh
 
August 2021 market watch
August 2021 market watchAugust 2021 market watch
August 2021 market watchMichelle Makos
 
Fraser Valley Real Estate Board May 2021 Statistics Package
Fraser Valley Real Estate Board May 2021 Statistics PackageFraser Valley Real Estate Board May 2021 Statistics Package
Fraser Valley Real Estate Board May 2021 Statistics PackageVicky Aulakh
 
Market Watch TORONTO 2014 OCTOBER
Market Watch TORONTO 2014 OCTOBERMarket Watch TORONTO 2014 OCTOBER
Market Watch TORONTO 2014 OCTOBERChaba Tamasi
 
Fraser Valley Stats Package September 2019
Fraser Valley Stats Package September 2019 Fraser Valley Stats Package September 2019
Fraser Valley Stats Package September 2019 Vicky Aulakh
 
San Francisco Market Focus August 2016
San Francisco Market Focus August 2016San Francisco Market Focus August 2016
San Francisco Market Focus August 2016Ronny Budiutama
 

What's hot (20)

Economic Report August 15 2015
Economic Report August 15 2015Economic Report August 15 2015
Economic Report August 15 2015
 
Fvreb may 2020 stats
Fvreb may 2020 stats Fvreb may 2020 stats
Fvreb may 2020 stats
 
Fraser Valley Real Estate Board Statistics - November 2021
Fraser Valley Real Estate Board Statistics - November 2021 Fraser Valley Real Estate Board Statistics - November 2021
Fraser Valley Real Estate Board Statistics - November 2021
 
Real Estate Analysis & Benchmark 121214
Real Estate Analysis & Benchmark 121214Real Estate Analysis & Benchmark 121214
Real Estate Analysis & Benchmark 121214
 
FVREB October 2020 Statistics Package
FVREB October 2020 Statistics PackageFVREB October 2020 Statistics Package
FVREB October 2020 Statistics Package
 
Fvreb August 2020 Stats Package
Fvreb August 2020 Stats PackageFvreb August 2020 Stats Package
Fvreb August 2020 Stats Package
 
The Okanagan Statistics Package January 2022
The Okanagan Statistics Package January 2022The Okanagan Statistics Package January 2022
The Okanagan Statistics Package January 2022
 
Chmic economic report july 2016
Chmic economic report july 2016Chmic economic report july 2016
Chmic economic report july 2016
 
Fraser Valley Real Estate Board Statistics Package March 2021
Fraser Valley Real Estate Board Statistics Package March 2021 Fraser Valley Real Estate Board Statistics Package March 2021
Fraser Valley Real Estate Board Statistics Package March 2021
 
Fraser Valley Real Estate Board November 2020 statistics package
Fraser Valley Real Estate Board November 2020 statistics packageFraser Valley Real Estate Board November 2020 statistics package
Fraser Valley Real Estate Board November 2020 statistics package
 
Fvreb package april 2020
Fvreb package april 2020Fvreb package april 2020
Fvreb package april 2020
 
FVREB September 2021 Statistics Package
FVREB September 2021 Statistics PackageFVREB September 2021 Statistics Package
FVREB September 2021 Statistics Package
 
Fraser Valley Real Estate Board Statistics Package October 2021
Fraser Valley Real Estate Board Statistics Package October 2021Fraser Valley Real Estate Board Statistics Package October 2021
Fraser Valley Real Estate Board Statistics Package October 2021
 
FVREB April 2021 Statistics Package
FVREB April 2021 Statistics PackageFVREB April 2021 Statistics Package
FVREB April 2021 Statistics Package
 
Feb 20 package fvreb
Feb 20 package fvrebFeb 20 package fvreb
Feb 20 package fvreb
 
August 2021 market watch
August 2021 market watchAugust 2021 market watch
August 2021 market watch
 
Fraser Valley Real Estate Board May 2021 Statistics Package
Fraser Valley Real Estate Board May 2021 Statistics PackageFraser Valley Real Estate Board May 2021 Statistics Package
Fraser Valley Real Estate Board May 2021 Statistics Package
 
Market Watch TORONTO 2014 OCTOBER
Market Watch TORONTO 2014 OCTOBERMarket Watch TORONTO 2014 OCTOBER
Market Watch TORONTO 2014 OCTOBER
 
Fraser Valley Stats Package September 2019
Fraser Valley Stats Package September 2019 Fraser Valley Stats Package September 2019
Fraser Valley Stats Package September 2019
 
San Francisco Market Focus August 2016
San Francisco Market Focus August 2016San Francisco Market Focus August 2016
San Francisco Market Focus August 2016
 

Viewers also liked

Calvert Home Mortgage Economic Report for October 2015
Calvert Home Mortgage Economic Report for October 2015Calvert Home Mortgage Economic Report for October 2015
Calvert Home Mortgage Economic Report for October 2015Keith Uthe
 
Calvert Home Mortgage Real Estate and Economic Report for September 2015
Calvert Home Mortgage Real Estate and Economic Report for September 2015Calvert Home Mortgage Real Estate and Economic Report for September 2015
Calvert Home Mortgage Real Estate and Economic Report for September 2015Keith Uthe
 
portfolio
portfolioportfolio
portfolioKumar M
 
Lunenberg Dengerink Korthagen 2013 ReviewstudieBeroepLerarenopleider
Lunenberg Dengerink Korthagen 2013 ReviewstudieBeroepLerarenopleiderLunenberg Dengerink Korthagen 2013 ReviewstudieBeroepLerarenopleider
Lunenberg Dengerink Korthagen 2013 ReviewstudieBeroepLerarenopleiderJurriën Dengerink
 
Complete
CompleteComplete
CompleteKumar M
 
Solène a testé la quinzaine des maths
Solène a testé la quinzaine des maths Solène a testé la quinzaine des maths
Solène a testé la quinzaine des maths DG WEB
 
Affiches de pub, éducation aux médias
Affiches de pub, éducation aux médiasAffiches de pub, éducation aux médias
Affiches de pub, éducation aux médiasDG WEB
 
Business View Magazine Article
Business View Magazine ArticleBusiness View Magazine Article
Business View Magazine ArticleKen Alessi
 

Viewers also liked (13)

Calvert Home Mortgage Economic Report for October 2015
Calvert Home Mortgage Economic Report for October 2015Calvert Home Mortgage Economic Report for October 2015
Calvert Home Mortgage Economic Report for October 2015
 
Calvert Home Mortgage Real Estate and Economic Report for September 2015
Calvert Home Mortgage Real Estate and Economic Report for September 2015Calvert Home Mortgage Real Estate and Economic Report for September 2015
Calvert Home Mortgage Real Estate and Economic Report for September 2015
 
Teresa Wahleithner Resume
Teresa Wahleithner ResumeTeresa Wahleithner Resume
Teresa Wahleithner Resume
 
Calvert Home Mortgage Real Estate and Economic Report for September 2015
Calvert Home Mortgage Real Estate and Economic Report for September 2015Calvert Home Mortgage Real Estate and Economic Report for September 2015
Calvert Home Mortgage Real Estate and Economic Report for September 2015
 
portfolio
portfolioportfolio
portfolio
 
Lunenberg Dengerink Korthagen 2013 ReviewstudieBeroepLerarenopleider
Lunenberg Dengerink Korthagen 2013 ReviewstudieBeroepLerarenopleiderLunenberg Dengerink Korthagen 2013 ReviewstudieBeroepLerarenopleider
Lunenberg Dengerink Korthagen 2013 ReviewstudieBeroepLerarenopleider
 
презентация
презентацияпрезентация
презентация
 
Complete
CompleteComplete
Complete
 
Solène a testé la quinzaine des maths
Solène a testé la quinzaine des maths Solène a testé la quinzaine des maths
Solène a testé la quinzaine des maths
 
Affiches de pub, éducation aux médias
Affiches de pub, éducation aux médiasAffiches de pub, éducation aux médias
Affiches de pub, éducation aux médias
 
Portfolio
Portfolio Portfolio
Portfolio
 
925 Arawak Ave
925 Arawak Ave 925 Arawak Ave
925 Arawak Ave
 
Business View Magazine Article
Business View Magazine ArticleBusiness View Magazine Article
Business View Magazine Article
 

Similar to Calvert Home Mortgage Economic Report May 31 2015

Calvert Home Mortgage's Real Estate and Economic Report for Sept 2015
Calvert Home Mortgage's Real Estate and Economic Report for Sept 2015Calvert Home Mortgage's Real Estate and Economic Report for Sept 2015
Calvert Home Mortgage's Real Estate and Economic Report for Sept 2015Jesse Bobrowski
 
Market Watch TORONTO 2015 JANUARY
Market Watch TORONTO 2015 JANUARYMarket Watch TORONTO 2015 JANUARY
Market Watch TORONTO 2015 JANUARYChaba Tamasi
 
Market Watch June 2013
Market Watch June 2013Market Watch June 2013
Market Watch June 2013Chaba Tamasi
 
2013 04 market watch
2013 04 market watch2013 04 market watch
2013 04 market watchChaba Tamasi
 
April 2016 Home Sales in Toronto and GTA
April 2016 Home Sales in Toronto and GTAApril 2016 Home Sales in Toronto and GTA
April 2016 Home Sales in Toronto and GTAMichelle Makos
 
Market Watch TORONTO 2015 FEBRUARY
Market Watch TORONTO 2015 FEBRUARYMarket Watch TORONTO 2015 FEBRUARY
Market Watch TORONTO 2015 FEBRUARYChaba Tamasi
 
Q1 2015 New River Valley real estate Nest Report
Q1 2015 New River Valley real estate Nest ReportQ1 2015 New River Valley real estate Nest Report
Q1 2015 New River Valley real estate Nest ReportJeremy Hart
 
THE TORONTO REAL ESTATE BOARD'S MAY 2018 MARKET SALES STATISTICS WITH MEDIA R...
THE TORONTO REAL ESTATE BOARD'S MAY 2018 MARKET SALES STATISTICS WITH MEDIA R...THE TORONTO REAL ESTATE BOARD'S MAY 2018 MARKET SALES STATISTICS WITH MEDIA R...
THE TORONTO REAL ESTATE BOARD'S MAY 2018 MARKET SALES STATISTICS WITH MEDIA R...Shawn Venasse
 
April 2014 Market Statistics - Toronto Real Estate Board
April 2014 Market Statistics - Toronto Real Estate BoardApril 2014 Market Statistics - Toronto Real Estate Board
April 2014 Market Statistics - Toronto Real Estate BoardMichelle Makos
 
San Francisco Market Focus July 2015
San Francisco Market Focus July 2015San Francisco Market Focus July 2015
San Francisco Market Focus July 2015Ronny Budiutama
 
January 2015 Greater Boston Real Estate Market Trends Report
January 2015 Greater Boston Real Estate Market Trends ReportJanuary 2015 Greater Boston Real Estate Market Trends Report
January 2015 Greater Boston Real Estate Market Trends ReportUnit Realty Group
 
San Francisco Market Focus June 2015
San Francisco Market Focus June 2015San Francisco Market Focus June 2015
San Francisco Market Focus June 2015Ronny Budiutama
 
Treb Market Watch - January 2016
Treb Market Watch - January 2016Treb Market Watch - January 2016
Treb Market Watch - January 2016Michelle Makos
 
San Francisco Market Focus April 2015
San Francisco Market Focus April 2015San Francisco Market Focus April 2015
San Francisco Market Focus April 2015Ronny Budiutama
 
San Francisco Market Focus March 2015
San Francisco Market Focus March 2015San Francisco Market Focus March 2015
San Francisco Market Focus March 2015Ronny Budiutama
 
The Do Good Report - Wrightsville Beach 1st Quarter 2013
The Do Good Report - Wrightsville Beach 1st Quarter 2013The Do Good Report - Wrightsville Beach 1st Quarter 2013
The Do Good Report - Wrightsville Beach 1st Quarter 2013DoGoodRealEstate
 
September 2021 Market Watch Report
September 2021 Market Watch ReportSeptember 2021 Market Watch Report
September 2021 Market Watch ReportMichelle Makos
 
San Francisco Market Focus May 2014
San Francisco Market Focus May 2014San Francisco Market Focus May 2014
San Francisco Market Focus May 2014Ronny Budiutama
 
October Market Watch is Here !
October Market Watch is Here !October Market Watch is Here !
October Market Watch is Here !Michelle Makos
 
San Francisco Market Focus May 2015
San Francisco Market Focus May 2015San Francisco Market Focus May 2015
San Francisco Market Focus May 2015Ronny Budiutama
 

Similar to Calvert Home Mortgage Economic Report May 31 2015 (20)

Calvert Home Mortgage's Real Estate and Economic Report for Sept 2015
Calvert Home Mortgage's Real Estate and Economic Report for Sept 2015Calvert Home Mortgage's Real Estate and Economic Report for Sept 2015
Calvert Home Mortgage's Real Estate and Economic Report for Sept 2015
 
Market Watch TORONTO 2015 JANUARY
Market Watch TORONTO 2015 JANUARYMarket Watch TORONTO 2015 JANUARY
Market Watch TORONTO 2015 JANUARY
 
Market Watch June 2013
Market Watch June 2013Market Watch June 2013
Market Watch June 2013
 
2013 04 market watch
2013 04 market watch2013 04 market watch
2013 04 market watch
 
April 2016 Home Sales in Toronto and GTA
April 2016 Home Sales in Toronto and GTAApril 2016 Home Sales in Toronto and GTA
April 2016 Home Sales in Toronto and GTA
 
Market Watch TORONTO 2015 FEBRUARY
Market Watch TORONTO 2015 FEBRUARYMarket Watch TORONTO 2015 FEBRUARY
Market Watch TORONTO 2015 FEBRUARY
 
Q1 2015 New River Valley real estate Nest Report
Q1 2015 New River Valley real estate Nest ReportQ1 2015 New River Valley real estate Nest Report
Q1 2015 New River Valley real estate Nest Report
 
THE TORONTO REAL ESTATE BOARD'S MAY 2018 MARKET SALES STATISTICS WITH MEDIA R...
THE TORONTO REAL ESTATE BOARD'S MAY 2018 MARKET SALES STATISTICS WITH MEDIA R...THE TORONTO REAL ESTATE BOARD'S MAY 2018 MARKET SALES STATISTICS WITH MEDIA R...
THE TORONTO REAL ESTATE BOARD'S MAY 2018 MARKET SALES STATISTICS WITH MEDIA R...
 
April 2014 Market Statistics - Toronto Real Estate Board
April 2014 Market Statistics - Toronto Real Estate BoardApril 2014 Market Statistics - Toronto Real Estate Board
April 2014 Market Statistics - Toronto Real Estate Board
 
San Francisco Market Focus July 2015
San Francisco Market Focus July 2015San Francisco Market Focus July 2015
San Francisco Market Focus July 2015
 
January 2015 Greater Boston Real Estate Market Trends Report
January 2015 Greater Boston Real Estate Market Trends ReportJanuary 2015 Greater Boston Real Estate Market Trends Report
January 2015 Greater Boston Real Estate Market Trends Report
 
San Francisco Market Focus June 2015
San Francisco Market Focus June 2015San Francisco Market Focus June 2015
San Francisco Market Focus June 2015
 
Treb Market Watch - January 2016
Treb Market Watch - January 2016Treb Market Watch - January 2016
Treb Market Watch - January 2016
 
San Francisco Market Focus April 2015
San Francisco Market Focus April 2015San Francisco Market Focus April 2015
San Francisco Market Focus April 2015
 
San Francisco Market Focus March 2015
San Francisco Market Focus March 2015San Francisco Market Focus March 2015
San Francisco Market Focus March 2015
 
The Do Good Report - Wrightsville Beach 1st Quarter 2013
The Do Good Report - Wrightsville Beach 1st Quarter 2013The Do Good Report - Wrightsville Beach 1st Quarter 2013
The Do Good Report - Wrightsville Beach 1st Quarter 2013
 
September 2021 Market Watch Report
September 2021 Market Watch ReportSeptember 2021 Market Watch Report
September 2021 Market Watch Report
 
San Francisco Market Focus May 2014
San Francisco Market Focus May 2014San Francisco Market Focus May 2014
San Francisco Market Focus May 2014
 
October Market Watch is Here !
October Market Watch is Here !October Market Watch is Here !
October Market Watch is Here !
 
San Francisco Market Focus May 2015
San Francisco Market Focus May 2015San Francisco Market Focus May 2015
San Francisco Market Focus May 2015
 

Recently uploaded

VIP Kolkata Call Girl Jodhpur Park 👉 8250192130 Available With Room
VIP Kolkata Call Girl Jodhpur Park 👉 8250192130  Available With RoomVIP Kolkata Call Girl Jodhpur Park 👉 8250192130  Available With Room
VIP Kolkata Call Girl Jodhpur Park 👉 8250192130 Available With Roomdivyansh0kumar0
 
原版1:1复刻温哥华岛大学毕业证Vancouver毕业证留信学历认证
原版1:1复刻温哥华岛大学毕业证Vancouver毕业证留信学历认证原版1:1复刻温哥华岛大学毕业证Vancouver毕业证留信学历认证
原版1:1复刻温哥华岛大学毕业证Vancouver毕业证留信学历认证rjrjkk
 
Call Girls Near Me WhatsApp:+91-9833363713
Call Girls Near Me WhatsApp:+91-9833363713Call Girls Near Me WhatsApp:+91-9833363713
Call Girls Near Me WhatsApp:+91-9833363713Sonam Pathan
 
Call Girls In Yusuf Sarai Women Seeking Men 9654467111
Call Girls In Yusuf Sarai Women Seeking Men 9654467111Call Girls In Yusuf Sarai Women Seeking Men 9654467111
Call Girls In Yusuf Sarai Women Seeking Men 9654467111Sapana Sha
 
Interimreport1 January–31 March2024 Elo Mutual Pension Insurance Company
Interimreport1 January–31 March2024 Elo Mutual Pension Insurance CompanyInterimreport1 January–31 March2024 Elo Mutual Pension Insurance Company
Interimreport1 January–31 March2024 Elo Mutual Pension Insurance CompanyTyöeläkeyhtiö Elo
 
SBP-Market-Operations and market managment
SBP-Market-Operations and market managmentSBP-Market-Operations and market managment
SBP-Market-Operations and market managmentfactical
 
government_intervention_in_business_ownership[1].pdf
government_intervention_in_business_ownership[1].pdfgovernment_intervention_in_business_ownership[1].pdf
government_intervention_in_business_ownership[1].pdfshaunmashale756
 
magnetic-pensions-a-new-blueprint-for-the-dc-landscape.pdf
magnetic-pensions-a-new-blueprint-for-the-dc-landscape.pdfmagnetic-pensions-a-new-blueprint-for-the-dc-landscape.pdf
magnetic-pensions-a-new-blueprint-for-the-dc-landscape.pdfHenry Tapper
 
House of Commons ; CDC schemes overview document
House of Commons ; CDC schemes overview documentHouse of Commons ; CDC schemes overview document
House of Commons ; CDC schemes overview documentHenry Tapper
 
OAT_RI_Ep19 WeighingTheRisks_Apr24_TheYellowMetal.pptx
OAT_RI_Ep19 WeighingTheRisks_Apr24_TheYellowMetal.pptxOAT_RI_Ep19 WeighingTheRisks_Apr24_TheYellowMetal.pptx
OAT_RI_Ep19 WeighingTheRisks_Apr24_TheYellowMetal.pptxhiddenlevers
 
fca-bsps-decision-letter-redacted (1).pdf
fca-bsps-decision-letter-redacted (1).pdffca-bsps-decision-letter-redacted (1).pdf
fca-bsps-decision-letter-redacted (1).pdfHenry Tapper
 
Call Girls Near Delhi Pride Hotel, New Delhi|9873777170
Call Girls Near Delhi Pride Hotel, New Delhi|9873777170Call Girls Near Delhi Pride Hotel, New Delhi|9873777170
Call Girls Near Delhi Pride Hotel, New Delhi|9873777170Sonam Pathan
 
chapter_2.ppt The labour market definitions and trends
chapter_2.ppt The labour market definitions and trendschapter_2.ppt The labour market definitions and trends
chapter_2.ppt The labour market definitions and trendslemlemtesfaye192
 
Stock Market Brief Deck for "this does not happen often".pdf
Stock Market Brief Deck for "this does not happen often".pdfStock Market Brief Deck for "this does not happen often".pdf
Stock Market Brief Deck for "this does not happen often".pdfMichael Silva
 
Chapter 2.ppt of macroeconomics by mankiw 9th edition
Chapter 2.ppt of macroeconomics by mankiw 9th editionChapter 2.ppt of macroeconomics by mankiw 9th edition
Chapter 2.ppt of macroeconomics by mankiw 9th editionMuhammadHusnain82237
 
20240417-Calibre-April-2024-Investor-Presentation.pdf
20240417-Calibre-April-2024-Investor-Presentation.pdf20240417-Calibre-April-2024-Investor-Presentation.pdf
20240417-Calibre-April-2024-Investor-Presentation.pdfAdnet Communications
 
Unveiling the Top Chartered Accountants in India and Their Staggering Net Worth
Unveiling the Top Chartered Accountants in India and Their Staggering Net WorthUnveiling the Top Chartered Accountants in India and Their Staggering Net Worth
Unveiling the Top Chartered Accountants in India and Their Staggering Net WorthShaheen Kumar
 
call girls in Nand Nagri (DELHI) 🔝 >༒9953330565🔝 genuine Escort Service 🔝✔️✔️
call girls in  Nand Nagri (DELHI) 🔝 >༒9953330565🔝 genuine Escort Service 🔝✔️✔️call girls in  Nand Nagri (DELHI) 🔝 >༒9953330565🔝 genuine Escort Service 🔝✔️✔️
call girls in Nand Nagri (DELHI) 🔝 >༒9953330565🔝 genuine Escort Service 🔝✔️✔️9953056974 Low Rate Call Girls In Saket, Delhi NCR
 
Vp Girls near me Delhi Call Now or WhatsApp
Vp Girls near me Delhi Call Now or WhatsAppVp Girls near me Delhi Call Now or WhatsApp
Vp Girls near me Delhi Call Now or WhatsAppmiss dipika
 

Recently uploaded (20)

VIP Kolkata Call Girl Jodhpur Park 👉 8250192130 Available With Room
VIP Kolkata Call Girl Jodhpur Park 👉 8250192130  Available With RoomVIP Kolkata Call Girl Jodhpur Park 👉 8250192130  Available With Room
VIP Kolkata Call Girl Jodhpur Park 👉 8250192130 Available With Room
 
原版1:1复刻温哥华岛大学毕业证Vancouver毕业证留信学历认证
原版1:1复刻温哥华岛大学毕业证Vancouver毕业证留信学历认证原版1:1复刻温哥华岛大学毕业证Vancouver毕业证留信学历认证
原版1:1复刻温哥华岛大学毕业证Vancouver毕业证留信学历认证
 
Call Girls Near Me WhatsApp:+91-9833363713
Call Girls Near Me WhatsApp:+91-9833363713Call Girls Near Me WhatsApp:+91-9833363713
Call Girls Near Me WhatsApp:+91-9833363713
 
Call Girls In Yusuf Sarai Women Seeking Men 9654467111
Call Girls In Yusuf Sarai Women Seeking Men 9654467111Call Girls In Yusuf Sarai Women Seeking Men 9654467111
Call Girls In Yusuf Sarai Women Seeking Men 9654467111
 
Interimreport1 January–31 March2024 Elo Mutual Pension Insurance Company
Interimreport1 January–31 March2024 Elo Mutual Pension Insurance CompanyInterimreport1 January–31 March2024 Elo Mutual Pension Insurance Company
Interimreport1 January–31 March2024 Elo Mutual Pension Insurance Company
 
SBP-Market-Operations and market managment
SBP-Market-Operations and market managmentSBP-Market-Operations and market managment
SBP-Market-Operations and market managment
 
government_intervention_in_business_ownership[1].pdf
government_intervention_in_business_ownership[1].pdfgovernment_intervention_in_business_ownership[1].pdf
government_intervention_in_business_ownership[1].pdf
 
magnetic-pensions-a-new-blueprint-for-the-dc-landscape.pdf
magnetic-pensions-a-new-blueprint-for-the-dc-landscape.pdfmagnetic-pensions-a-new-blueprint-for-the-dc-landscape.pdf
magnetic-pensions-a-new-blueprint-for-the-dc-landscape.pdf
 
House of Commons ; CDC schemes overview document
House of Commons ; CDC schemes overview documentHouse of Commons ; CDC schemes overview document
House of Commons ; CDC schemes overview document
 
OAT_RI_Ep19 WeighingTheRisks_Apr24_TheYellowMetal.pptx
OAT_RI_Ep19 WeighingTheRisks_Apr24_TheYellowMetal.pptxOAT_RI_Ep19 WeighingTheRisks_Apr24_TheYellowMetal.pptx
OAT_RI_Ep19 WeighingTheRisks_Apr24_TheYellowMetal.pptx
 
fca-bsps-decision-letter-redacted (1).pdf
fca-bsps-decision-letter-redacted (1).pdffca-bsps-decision-letter-redacted (1).pdf
fca-bsps-decision-letter-redacted (1).pdf
 
Call Girls Near Delhi Pride Hotel, New Delhi|9873777170
Call Girls Near Delhi Pride Hotel, New Delhi|9873777170Call Girls Near Delhi Pride Hotel, New Delhi|9873777170
Call Girls Near Delhi Pride Hotel, New Delhi|9873777170
 
chapter_2.ppt The labour market definitions and trends
chapter_2.ppt The labour market definitions and trendschapter_2.ppt The labour market definitions and trends
chapter_2.ppt The labour market definitions and trends
 
Stock Market Brief Deck for "this does not happen often".pdf
Stock Market Brief Deck for "this does not happen often".pdfStock Market Brief Deck for "this does not happen often".pdf
Stock Market Brief Deck for "this does not happen often".pdf
 
Chapter 2.ppt of macroeconomics by mankiw 9th edition
Chapter 2.ppt of macroeconomics by mankiw 9th editionChapter 2.ppt of macroeconomics by mankiw 9th edition
Chapter 2.ppt of macroeconomics by mankiw 9th edition
 
20240417-Calibre-April-2024-Investor-Presentation.pdf
20240417-Calibre-April-2024-Investor-Presentation.pdf20240417-Calibre-April-2024-Investor-Presentation.pdf
20240417-Calibre-April-2024-Investor-Presentation.pdf
 
Unveiling the Top Chartered Accountants in India and Their Staggering Net Worth
Unveiling the Top Chartered Accountants in India and Their Staggering Net WorthUnveiling the Top Chartered Accountants in India and Their Staggering Net Worth
Unveiling the Top Chartered Accountants in India and Their Staggering Net Worth
 
call girls in Nand Nagri (DELHI) 🔝 >༒9953330565🔝 genuine Escort Service 🔝✔️✔️
call girls in  Nand Nagri (DELHI) 🔝 >༒9953330565🔝 genuine Escort Service 🔝✔️✔️call girls in  Nand Nagri (DELHI) 🔝 >༒9953330565🔝 genuine Escort Service 🔝✔️✔️
call girls in Nand Nagri (DELHI) 🔝 >༒9953330565🔝 genuine Escort Service 🔝✔️✔️
 
Monthly Economic Monitoring of Ukraine No 231, April 2024
Monthly Economic Monitoring of Ukraine No 231, April 2024Monthly Economic Monitoring of Ukraine No 231, April 2024
Monthly Economic Monitoring of Ukraine No 231, April 2024
 
Vp Girls near me Delhi Call Now or WhatsApp
Vp Girls near me Delhi Call Now or WhatsAppVp Girls near me Delhi Call Now or WhatsApp
Vp Girls near me Delhi Call Now or WhatsApp
 

Calvert Home Mortgage Economic Report May 31 2015

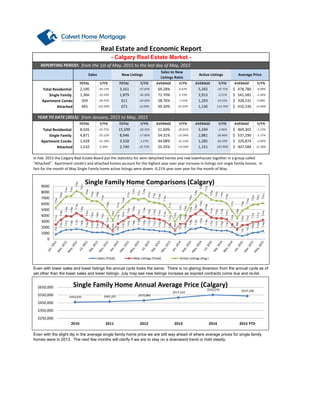
  • 1. Total Residential  Single Family  Apartment Condo Attached 2015 Total Residential  Single Family  Apartment Condo  Attached - Calgary Real Estate Market - REPORTING PERIOD: from the 1st of May, 2015 to the last day of May, 2015 Real Estate and Economic Report Sales New Listings Sales to New Listings Ratio Active Listings Average Price AVERAGE Y/Y% AVERAGE Y/Y%TOTAL Y/Y% TOTAL Y/Y% AVERAGE Y/Y% 5,342 ‐30.72% 478,780$     ‐0.98%2,190 ‐44.15% 3,161 ‐47.64% 69.28% 6.67% 1,366 ‐32.54% 1,879 ‐36.20% 72.70% 5.73% 2,913 ‐0.21% 541,582$     ‐2.36% 359 ‐29.75% 611 ‐24.00% 58.76% ‐7.55% 1,293 23.03% 328,531$     3.98% 465 122.49% 671 16.09% 69.30% 91.65% 1,136 114.74% 410,336$     13.49% YEAR TO DATE (2015): from January, 2015 to May, 2015 TOTAL Y/Y% TOTAL Y/Y% AVERAGE Y/Y% 8,026 ‐43.72% 15,599 ‐28.35% 51.60% ‐20.81% 5,349 ‐2.96% 469,302$     ‐1.12% AVERAGE Y/Y% AVERAGE Y/Y% 4,871 ‐35.12% 8,946 ‐17.66% 54.31% ‐21.04% 2,881 36.46% 537,290$     ‐1.71% 1,428 ‐31.18% 3,318 3.27% 44.08% ‐31.33% 1,285 66.93% 329,874$     ‐2.66% 1,510 9.34% 2,740 24.72% 55.35% ‐14.50% 1,151 192.90% 407,584$     12.38% In Feb. 2015 the Calgary Real Estate Board put the statisitics for semi‐detached homes and row townhouses together in a group called  "Attached".  Apartment condo's and attached homes account for the highest year over year increase in listings not single family homes.  In  fact for the month of May Single Family home active listings were dowm ‐0.21% year over year for the month of May. Even with lower sales and lower listings the annual cycle looks the same. There is no glaring diversion from the annual cycle as of yet other than the lower sales and lower listings. July may see new listings increase as expried contracts come due and re-list. Even with the slight dip in the average single family home price we are still way ahead of where average prices for single family homes were in 2013. The next few months will clarify if we are to stay on a downward trend or hold steady. $459,035  $465,202  $479,880  $517,333  $552,276  $537,290   $250,000  $350,000  $450,000  $550,000  $650,000 2010 2011 2012 2013 2014 2015 YTD Single Family Home Annual Average Price (Calgary) 0 1000 2000 3000 4000 5000 6000 7000 8000 9000 Single Family Home Comparisons (Calgary) Sales (Total) New Listings (Total) Active Listings (Avg.)
  • 2. Total Residential  Single Family  Condo  Townhouse  2015 Total Residential  Single Family  Condo  Townhouse  Sales to New  Listings Ratio Average Price - Edmonton Real Estate Market - TOTAL Y/Y% AVERAGE Y/Y% AVERAGE REPORTING PERIOD: from May, 2015 to May, 2015 Sales New Listings Y/Y% 1,784 ‐9.85% 3,314 ‐2.18% 53.83% ‐7.84% 381,111$      TOTAL Y/Y% 2.48% 1,078 ‐11.13% 1,974 ‐5.32% 55.00% ‐5.17% 451,312$      1.73% 510 ‐9.73% 1,047 5.86% 49.00% ‐14.04% 256,143$      1.77% 165 4.43% 219 ‐3.95% 75.00% 8.70% 345,659$      ‐1.61% TOTAL Y/Y% AVERAGE Y/Y% YEAR TO DATE (2015): from January, 2015 to May, 2015 AVERAGE Y/Y% 6,431 ‐13.25% 14,483 14.03% 43.17% ‐25.27% TOTAL Y/Y% 371,242$      2.56% 3,892 ‐13.68% 8,547 11.87% 44.20% ‐24.57% 437,356$      1.80% 1,832 ‐16.61% 4,482 15.63% 40.20% ‐27.96% 251,225$      3.06% 586 5.97% 1,097 30.29% 53.40% ‐17.85% We are currently sitting at the same average days on market as existed in the summer of 2014 when the market was extremely hot. Will July and August put the heat on stale listings or will homes ride the heat wave? The lower total sales have not impacted the price range people are buying in. The price range to sales is proportionatly the same year over year. Where the two graphs meet may indicate that homes previously priced from $600-$649 have moved down one price category pushing sales up for the $550-$599 price range. Edmonton sales have seen a slight drop off compared to a market that was heating up in 2014. The brakes were applied before prices went to crazy and the leveling off has had a softer effect than on overall numbers compared to Calgary. 358,513$      6.13% 0 20 40 60 Average Days on Market (Calgary) 0 50 100 150 200 250 300 350 400 450 > $100 $100 ‐ $199 $200 ‐ $299 $300 ‐$ 349 $350 ‐ $399 $400 ‐ $449  $450 ‐ $499  $500 ‐ $549 $550 ‐ $599 $600 ‐ $649 $650 ‐ $699  $700 ‐ $799 $800 ‐ $899 $900 ‐ $999 $1M + 2014 2015 Current Month Sale Price Range (Calgary)
  • 3. The annual cycle appears to be continuing on the same path as in prior years. As in previous years listings spiked in January and March, however, they have levelled off compared to previous years. Since 2011 the average home price in Edmonton has increased an average of just over 4% per year since 2011 with a high of 5.4% from 2013-2014 Days on market have levelled off settling at 41 days which is a reasonable amount of time that provides some balance. $383,226  $379,485  $392,446  $409,438  $431,707  $437,356   $340,000  $360,000  $380,000  $400,000  $420,000  $440,000  $460,000 2010 2011 2012 2013 2014 2015 YTD Single Family Home Annual Average Price (Edmonton) 543 737 989 1,084 1,264 1,136 941 854 773 782 623 419 528 648 923 1,022 1,179 1,198 1,125 983 857 863 673 436 485 747 917 1,147 1,213 1,218 1,092 924 967 850 717 439 390 547 876 1,001 1,078 1,155 1,354 1,737 1,663 1,943 1,627 1,455 1,380 1,266 1,082 769 409 955 1,115 1,467 1,569 1,911 1,586 1,491 1,349 1,268 1,059 783 415 1,070 1,082 1,585 1,818 2,085 1,828 1,602 1,353 1,337 1,256 794 534 1,298 1,428 1,883 1,964 1,974 0 500 1,000 1,500 2,000 2,500 Single Family Home Comparisons (Edmonton) Sales (Total) New Listings (Total) 0 50 100 Average Days on Market (Edmonton)
  • 4. Real GDP Change 2015Q1 Unemployment Rate May-15 Retail Sales Growth Apr. 2015 Job Vacancies 2015 Employees have continued to earn more money even as the Alberta Economy has slowed. This will be a good number to watch over the next 6 months to indicate the strength of business profits in Alberta during economic recovery. The last six months has seen a trend of closing the gap between the price in United States dollars of West Texas Iintermediate (WTI) Oil and Western Canadian Select (WCS) bitumen. This is a big benefit of the majority of Alberta producers as WCS is what is mostly produced in Alberta and shipped out at the US dollar rate and then converted to Candian Dollars. This means that currently the price for WCS in Canadian dollars is about $65 per barrel, with the low Canadian dollar the Alberta producers are feeling the benefit. - Alberta Economic Indicators - in Alberta -25.68% *the following information is based on current available data from: http://economicdashboard.albertacanada.com/, www.statcan.gc.ca/dai-quo/ and RBC Economic Outlook. Y/Y% TOTAL Y/Y% Net Migration to AB 7,723 2.20% Apr-15 34,100 1% -0.13% in Canada 3.30% in Canada 954.07$ 13,560 -6.43% 2.80% 1,531 Weekly Earnings April 2015 in Canada 0.60% -0.60% -86.36% -130.00% in Alberta in Alberta 5.80% in Canada -8.70% -2.09% -2.20% 1.71% in Alberta -1.42% in Canada -158.00% -231.24% 6.80% 11.54% -4.23% 1,177.00$ in Alberta Housing starts May-15 Mortgage Foreclosures Feb. 15 in Alberta in Canada $990.98 $1,034.17 $1,070.47 $1,107.97 $1,149.18 $1,177.00 $800 $900 $1,000 $1,100 $1,200 2010 2011 2012 2013 2014 2015 Alberta's Average Weekly Earnings  $‐  $10.00  $20.00  $30.00  $40.00  $50.00  $60.00  $70.00  $80.00  $90.00  $100.00  $110.00  $120.00 WCS OIL PRICES WTI OIL PRICES WTI‐WCS Price Differential WTI and WCS Pricing and Price Differential (US$)
  • 5. Notes: http://economicdashboard.albertacanada.com/ http://www.creb.com/ http://www.ereb.com/REALTORSAssociationOfEdmonton.html http://www.capp.ca/Pages/default.aspx http://homepriceindex.ca/hpi_tool_en.html http://www.cba.ca/en/component/content/publication/69-statistics http://www.finance.alberta.ca/aboutalberta/ http://www.statcan.gc.ca/dai-quo/ http://www.bankofcanada.ca/wp-content/uploads/2014/12/fsr-december2014.pdf Resources http://www.rbc.com/economics/economic-data/index.html Housing prices in Canada have had more growth than income. Low mortgage rates continue to stimulate the Canadian real estate market. CND resale of homes has picked up in Toronto and Vancouver while they have declined in Calgary and Edmonton. Oil and gas is employing 550,000 jobs across Canada, and 440,000 in Alberta either directly or indirectly 2013 oil and gas sector accounted for 20% of the TSX, and $69 billion in capital spending. (Statistics are from CAPP) 121,500 Albertans are directly employed in mining, oil and gas extraction sectors Bank of Canada is monitoring 3 key factors with relation to the financial system: 1. Elevated level of household indebtedness The current price of Western Canadian Select (WCS) crude in in Canadian dollars is trading at $10 more than the price of WCS in January of 2013, however, compared to one year ago WCS is trading at about 31% less(US$). 2. Imbalance in the householder market 3. Investor risk taking and illiquidity in financial markets Historically the HPI shows how Edmonton follows Calgary for price increases and decreases by about 6 months, however, that trend broke off in 2014 likely due to the drop in oil prices. During the same 10 year period the TSX100 only increased 50% compared to the 110% for Calgary and the 80% for Edmonton showing that real estate continues to perform stronger than the stock market. The difference is even more drastic since 2002. Other Bank of Canada comments: 0 50 100 150 200 250 Calgary Home Price Index Edmonton Home Price Index Home Price Index Comparision