Caffeine intake in children in the United States and 10-y
trends: 2001–20101–4
Namanjeet Ahluwalia, Kirsten Herrick, Alanna Moshfegh, and Michael Rybak
ABSTRACT
Background: Because of the increasing concern of the potential
adverse effects of caffeine intake in children, recent estimates of
caffeine consumption in a representative sample of children are
needed.
Objectives: We provide estimates of caffeine intake in children in
absolute amounts (mg) and in relation to body weight (mg/kg) to
examine the association of caffeine consumption with sociodemo-
graphic factors and describe trends in caffeine intake in children in
the United States.
Design: We analyzed caffeine intake in 3280 children aged 2–19 y
who participated in a 24-h dietary recall as part of the NHANES,
which is a nationally representative survey of the US population
with a cross-sectional design, in 2009–2010. Trends over time be-
tween 2001 and 2010 were examined in 2–19-y-old children (n =
18,530). Analyses were conducted for all children and repeated for
caffeine consumers.
Results: In 2009–2010, 71% of US children consumed caffeine on
a given day. Median caffeine intakes for 2–5-, 6–11-, and 12–19-y
olds were 1.3, 4.5, and 13.6 mg, respectively, and 4.7, 9.1, and 40.6
mg, respectively, in caffeine consumers. Non-Hispanic black chil-
dren had lower caffeine intake than that of non-Hispanic white
counterparts. Caffeine intake correlated positively with age; this
association was independent of body weight. On a given day,
10% of 12–19-y-olds exceeded the suggested maximum caffeine
intake of 2.5 mg/kg by Health Canada. A significant linear trend
of decline in caffeine intake (in mg or mg/kg) was noted overall for
children aged 2–19 y during 2001–2010. Specifically, caffeine in-
take declined by 3.0 and 4.6 mg in 2–5- and 6–11-y-old caffeine
consumers, respectively; no change was noted in 12–19-y-olds.
Conclusion: A majority of US children including preschoolers con-
sumed caffeine. Caffeine intake was highest in 12–19-y-olds and
remained stable over the 10-y study period in this age group. Am J
Clin Nutr 2014;100:1124–32.
INTRODUCTION
Caffeine is a commonly consumed stimulant present naturally
in or added to foods and beverages. Caffeine consumption in
children has received considerable interest because of the con-
cern of adverse health effects. Caffeine intake of 100–400 mg has
been associated with nervousness, jitteriness, and fidgetiness
(1, 2). Because of the continued brain development involving
myelination and pruning processes, children may be particularly
sensitive to caffeine (3, 4). There has been some evidence that
has linked caffeine intake in children to sleep dysfunction, el-
evated blood pressure, impairments in mineral absorption and
bone health, and increased alcohol use or dependence (1, 5–7).
In addition, the routine use of caffeinated sugar-sweetened
beverages may contribute to weight gain and dental cavities (8).
Caffeine toxicity in children has also ...
Applying the Theories of Reasoned Action Planned Behavior.pdfbkbk37
The document discusses applying the Transtheoretical Model to understand the health literacy of inner-city families regarding their purchase of fruits and vegetables at convenience stores. It suggests using the model to examine what stage of change inner-city families are at in terms of accessing and purchasing fresh produce. Considering families' resources and store access can provide insight into where interventions could best target to encourage healthier shopping behaviors.
This literature review summarizes research on factors influencing junk food consumption. It finds that junk food is linked to health issues like cancer, heart disease, and diabetes. On average, 36% of US children consume junk food daily, with 11% getting over 45% of their calories from it. Some people avoid junk food due to health awareness, while others consume it due to affordable prices and convenient locations of fast food restaurants. Recommendations to reduce consumption include increasing health education and making healthier options more available and affordable.
This study analyzed data from the National Health and Nutrition Examination Survey (NHANES) from 2007 to 2012 to assess consumption of ultra-processed foods in the US population and how it varies by sociodemographic factors and over time. The researchers found that almost 60% of calories consumed came from ultra-processed foods. Consumption decreased with age and income and was higher among non-Hispanic whites and blacks compared to other groups. Ultra-processed food consumption increased nearly 1% per survey cycle, including among males, adolescents, and those with a high school education.
Potential Adverse Effect of Caffeine Consumption - JavaCoffeeiq.comJavaCoffeeIQ.com
a systematic review published in the journal Food and Chemical Toxicology concluded that even up to eight cups of coffee daily “is not associated with significant concern regarding the risk of fracture and fall,” especially in healthy adults who get enough calcium.
https://javacoffeeiq.com/c/side-effects-of-coffee/
Breastfeeding Rates In The United States By Characteristics Of The Child,Biblioteca Virtual
This study analyzed breastfeeding rates in the United States using data from the 2002 National Immunization Survey. It found that over two-thirds of infants were ever breastfed, but rates of exclusive and continued breastfeeding dropped significantly by 6 and 12 months. Certain groups had lower rates, including non-Hispanic black children, those in daycare, enrolled in WIC, from lower socioeconomic status families, or younger or less educated mothers. The results suggest more efforts are needed to improve and support breastfeeding, especially among disadvantaged populations.
This document summarizes recent research on the health effects of coffee and caffeine in the United States. It discusses a systematic review by the International Life Sciences Institute that reconfirmed recommendations on safe caffeine intake levels. Several US studies examined caffeine exposure from all sources. The US Dietary Guidelines committee concluded that moderate coffee consumption can be part of a healthy diet. Recent research has studied the effects of coffee and caffeine on cardiovascular health, reproduction, behavior, bone health, and acute toxicity. The document also describes the newly founded UC Davis Coffee Center for research.
Drewnowski and Rehm Nutrition Journal 2013, 1259httpwww..docxjacksnathalie
Drewnowski and Rehm Nutrition Journal 2013, 12:59
http://www.nutritionj.com/content/12/1/59
RESEARCH Open Access
Energy intakes of US children and adults by food
purchase location and by specific food source
Adam Drewnowski1,2* and Colin D Rehm2
Abstract
Background: To our knowledge, no studies have examined energy intakes by food purchase location and food
source using a representative sample of US children, adolescents and adults. Evaluations of purchase location and
food sources of energy may inform public health policy.
Methods: Analyses were based on the first day of 24-hour recall for 22,852 persons in the 2003-4, 2005-6, and
2007-8 National Health and Nutrition Examination Surveys (NHANES). The most common food purchase locations
were stores (grocery store, supermarket, convenience store, or specialty store), quick-service restaurants/pizza (QSR),
full-service restaurants (FSR), school cafeterias, or food from someone else/gifts. Specific food sources of energy
were identified using the National Cancer Institute aggregation scheme. Separate analyses were conducted for
children ages 6-11y, adolescents ages 12-19y, and adults aged 20-50y and ≥51y.
Results: Stores (grocery, convenience, and specialty) were the food purchase locations for between 63.3% and
70.3% of dietary energy in the US diet. Restaurants provided between 16.9% and 26.3% of total energy. Depending
on the respondents’ age, QSR provided between 12.5% and 17.5% of energy, whereas FSR provided between 4.7%
and 10.4% of energy. School meals provided 9.8% of energy for children and 5.5% for adolescents. Vending
machines provided <1% of energy. Pizza from QSR, the top food away from home (FAFH) item, provided 2.2% of
energy in the diets of children and 3.4% in the diets of adolescents. Soda, energy, and sports drinks from QSR
provided approximately 1.2% of dietary energy.
Conclusions: Refining dietary surveillance approaches by incorporating food purchase location may help inform
public health policy. Characterizing the important sources of energy, in terms of both purchase location and source
may be useful in anticipating the population-level impacts of proposed policy or educational interventions. These
data show that stores provide a majority of energy for the population, followed by quick-service and full-service
restaurants. All food purchase locations, including stores, restaurants and schools play an important role in
stemming the obesity epidemic.
Keywords: Energy intake, Obesity, Food away from home, Food source, Food purchase location
Background
Foods away from home (FAFH) represent an increasing
proportion of energy in the American diet [1-3]. Accor-
ding to reports from the US Department of Agriculture
(USDA) [4,5], FAFH consumption has been associated
with poor diet quality and may contribute to weight
gain. The potential links between dietary energy obtained
* Correspondence: [email protected]
1Université Pierre et Marie Curie - Paris VI, Groupe Hospitalier P ...
Dietary practice of school going childrenUday Kumar
1) The study aimed to assess the nutritional status and prevalence of dental caries among 600 children aged 12-15 years in Lucknow, India.
2) Clinical assessments were conducted to record nutritional status using BMI and dental caries experience using the DMFT index.
3) Preliminary results found a 53.8% caries prevalence with a mean DMFT of 1.84 in Indian children aged 12, indicating high rates of malnutrition and dental caries.
AbstractComment by Tim Cameron Will you be adding the title page.docxbartholomeocoombs
Abstract Comment by Tim Cameron: Will you be adding the title page before this? Comment by Tim Cameron:
Introduction
Children require different types of diets as they grow up. Every stage of development requires a specific type of diet to enhances growth and general well-being. This is why the federal government has set up rules and regulations and governs to school lunches in the United States. The government introduces updated National School Lunch and School Breakfast Programs (NSLP) in 2012 to cut down sugar, sodium and fat intake in the schools. The program included introduction of fruits, whole grains and vegetables every day. Statistics shows that nearly one third of children and adolescents in the country are obese and overweight. Poor nutrition in school lunches also increases chances of developing chronic diseases such as kidney stones, heart diseases and diabetes (Schuna, 2017). Healthy nutrition among children and adolescents enhances memory development, social skills and fine motor skills. Nutritionally sound diets in children and preadolescents plays very important roles in preparing them to (for) a healthier future. It is therefore the responsibility of the government to ensure school lunches are free of excess sugar, salt and fats.
There a strong relationship between nutrition and brain development. High intake of poor diet during the earlier years in children leads to anxiety and depression in later years. It also increases emotional and behavioral problems. However, healthy diets such as vegetables, whole grains and fruits prevent children’s risk to for depression in later years. According to the U.S. Department of Agriculture (USDA, 2018), whole grains contains vitamins B, fiber and minerals that helps kids in school to concentrate in class. The government through the USDA started offering whole-grain rich food in school lunches after the enactment of the Healthy, Hunger-Free Kids Act in 2012. The problem now is that these rules have been relaxed and children and adolescents are back consuming sugary foods. Also most schools do not adhere to NLSP program expectations.
You need a Population Concerns section
Methods This should be Nutrition Relation Topics – what areas of your research are related to nutrition?
Next should be Nutrition Interventions – what studies were conducted?
The research methodology used in this nutrition research paper involved systematic reviews of various sources involving children, preadolescents and nutrition. Most of these studies were obtained from government agency databases such as United States Department of Agriculture (USDA), NHANES and other nutrition databases. The research studies reviewed were majorly conducted through Cross-sectional surveys, surveillance surveys and experimental designs. Data were obtained through admission of questionnaires and interviews. Statistical tools such as regression analysis were used in analyzing the data.
Research Findings This should be Nutrition.
This document summarizes a systematic review of factors associated with childhood overweight and obesity in South Asian countries. The review included 11 studies from India, Pakistan, Bangladesh, and Sri Lanka that used BMI to measure overweight and obesity in children and adolescents. The studies found wide variation in overweight prevalence from 3.1-19.7% and obesity prevalence from 1.2-14.5%. Lack of physical activity was associated with overweight/obesity in most studies, while higher socioeconomic status, urban residence, and consumption of junk food/fast food were also identified as risk factors.
The National Children's Food Survey (NCFS) was conducted between 2003-2004 in Ireland to study food and nutrient intake in children aged 5-12 years. 594 children were selected from 28 primary schools across Ireland using stratified random sampling. Data was collected through 7-day weighed food diaries and questionnaires. Nutrient intake was analyzed using food composition databases. Anthropometric measurements and physical activity data using accelerometers was also collected. Rigorous methodology including training, multiple food diary reviews, and quality control procedures were employed to obtain accurate dietary intake data.
The document summarizes the methodology used for the National Teens' Food Survey conducted in Ireland between 2005-2006. It describes the sampling and selection of schools, recruitment of respondents, data collection methods including food diaries and questionnaires, anthropometric measurements, data analysis, and validation procedures. Over 400 teenagers were selected from 32 secondary schools across Ireland to collect detailed information on food and beverage intake and lifestyle factors over a 7-day period.
This document contains a proposal for a thesis defense on the prevalence of malnutrition among children in Berbera, Somaliland. The study aims to determine the prevalence of malnutrition and associated factors among children aged 6-59 months attending a Mother and Child Health clinic in Berbera. The proposal outlines the background, problem statement, objectives, research questions, scope, significance, and proposed research design of the study, which will use a cross-sectional survey to examine socioeconomic factors, childcare practices, and child characteristics in relation to malnutrition.
The document summarizes the methodology of the Irish Health Behaviour in School-aged Children (HBSC) Study 2010. It describes how a nationally representative sample of school-aged children was obtained through a two-stage cluster sampling process involving randomly selecting schools and classes within schools. Data was collected through self-reported questionnaires administered in classrooms. The study aimed to monitor health behaviors and their social context among Irish children aged 9-18 years in line with international HBSC protocols.
Submission Ide e223bfb4-049f-4c26-ba24-2ede2b73157041 SI.docxdeanmtaylor1545
Submission Ide: e223bfb4-049f-4c26-ba24-2ede2b731570
41% SIMILARITY SCORE 8 CITATION ITEMS 46 GRAMMAR ISSUES 0 FEEDBACK COMMENT
Internet Source 0%
Institution 41%
Avery Bryan
Benchmark – Capstone Project.docx
Summary
1911 Words
Running head: BENCHMARK – CAPSTONE PROJECT 1
BENCHMARK – CAPSTONE PROJECT 2
Use an m-dash.: – —
Use an m-dash.: – —
Benchmark – Capstone Project
Avery Bryan
Professor Tammy Gray
NRS-490
02/09/20
Benchmark – Capstone Project
Obesity is prevalent among the African American children. Most of the African
American families fall in the low income groups. This results to them not being able to purchase
BENCHMARK – CAPSTONE PROJECT 3
Spelling mistake: junky junk
Passive voice: be considered to be
Unpaired braces, brackets, quotation m...: (
Possible typo: et al et al.
Unpaired braces, brackets, quotation m...: (
Spelling mistake: Chircop Chirp
healthy foods. There is a perception that healthy foods are very expensive to purchase. Their
food consumption to a large extent consists of proteins from genetically modified organisms
(GMOs), larger amounts of refined grains and sugars and high level of fructose corn syrup. They
consume junky foods that are cheaper to buy. These foods contribute a lot to childhood obesity
among the African American children who consume them.
Obesity is not a disease in itself. However, it leads to an increased risk of individuals to
develop other diseases that may be considered to be chronic. These chronic diseases include
some types of cancer, coronary heart disease, stroke, osteoarthritis, type 2 diabetes and other
complicated health conditions. A myriad of social and physical negative consequences are
associated with obesity. The conditions associated with obesity carry both short term and long
term negative outcomes that are extremely expensive to treat both at individual and societal
level. It is less expensive to prevent obesity than to cure it. It is therefore important to address the
problem of obesity by implementing effective preventive measures.
Childhood obesity is a world-wide health problem and development of interventions to
prevent or control it should be a priority (Amini et al, (2014). Obesity is prevalent and on the
increase among many school going African American children in the US. Physical activity and
healthy diet are the key preventive interventions that can be implemented to tackle the challenge
of childhood obesity (Chircop et al., (2015).
Obesity is a major health concern. This is because children who have obesity, compared
to those with normal weight are at .
This needs assessment examines overweight and obesity rates among children in the Harrison School District Two in El Paso County, Colorado. Interviews with local stakeholders and a review of secondary data revealed high rates of childhood obesity and a lack of access to healthy foods and physical activity opportunities. A sidewalk audit and SOPARC assessment of Meadows Park found the park is underutilized despite being accessible. Implications of the study include proposing additional programs like farmers markets, physical activity classes, and neighborhood improvements to increase access to healthy lifestyle options for children.
Nutritional Status of School Age Children in Private Elementary Schools: Basi...IJAEMSJORNAL
Department of Education (DepEd) organizes nutritional programs to improve the health status of children in public schools. Likewise, the researcher believes that health awareness must be raised in private schools as well. This study aimed to affect the community to be aware and more knowledgeable about nutrition. Specifically, this study focused on the nutritional status of school age children in private elementary schools in Santa Rosa, Nueva Ecija. It sought to determine the profile of the learners, anthropometrics, clinical data and the knowledge of the learners as to dietary and the significant relationship between the profile of the learners and the nutritional status of the school aged children. With all the data gathered a meal management program was proposed. The study employed the quantitative description design. The study manifests that majority of the respondents were not yet aware of what they eat. In addition, age, greatly affects the respondent’s anthropometrics as to height. More so, age, number of siblings and family income, greatly affect the respondents’ anthropometrics as to weight. The researcher adopted the Nutritional Guidelines for Filipino program that was developed by the DOST- FNRI.
This document provides a summary of a study on functional food ideation conducted by Company X. Key trends identified include growing demand for more nutritious, local, and natural whole foods. However, concerns remain regarding the overall quality and safety of the food supply. Unhealthy eating behaviors persist in both adults and children. New technologies offer potential for more personalized nutrition approaches. Key nutrition issues cited include growing rates of obesity, poor dental health, deficiencies in vitamins/minerals, and concerns with the changes occurring in the food supply and eating patterns that may impact health.
The Effect of Community Risk Perception on Type-2 Diabetes Mellitus Screening...Carly Freeman
This document summarizes a study on the effect of risk perception on type 2 diabetes screening in a rural Thai village. The study found that:
1) The prevalence of type 2 diabetes was much higher in adults over age 45 (12.8%) than under age 45 (0.7%), and screening rates followed a similar pattern.
2) Less than half of residents were aware of the Ministry of Health's dietary recommendations. Risk perception emphasized genetic and age-related factors over behavioral factors like diet.
3) There may be an undiagnosed population of type 2 diabetes residents because of a misguided risk perception from a lack of nutritional knowledge, as screening participation was low among adults under 45.
Infant Nutrition to 2020- An Ideation StudyBrand Acumen
This document summarizes the findings of a study on infant nutrition trends conducted for Company X. Key trends identified include growing demand for fresh, local, whole foods and concerns about the overall nutrition quality and safety of the food supply. Issues like childhood obesity, vitamin/mineral deficiencies, and unhealthy eating behaviors are ongoing problems. The document also discusses awareness and perceptions of functional foods and emerging research areas like personalized nutrition using mobile technologies. Identification of current nutrition, behavior, and weight management trends in both children and adults is provided to help inform new product development opportunities.
(1) Dr. James R. Coughlin, a food toxicologist with over 35 years of experience, testified before the U.S. Senate Committee on concerns about marketing energy drinks to youth.
(2) He stated that restrictions cannot be supported scientifically because caffeine from energy drinks is a small source of caffeine compared to coffee, tea, and soda, and that the caffeine content in mainstream energy drinks is comparable or less than that in coffee.
(3) The best available clinical evidence shows that caffeine consumption at current levels in the U.S. population, including in children and teens, presents no safety concerns.
The document provides an executive summary of a study on functional food innovation conducted for Company X. Key findings from the study include:
- Trends in more sustainable, nutritious eating, but also continued unhealthy behaviors like fast food consumption and snacking.
- Major nutrition issues like obesity, deficiencies in vitamins/minerals, and poor overall diet quality for both children and adults.
- Mixed awareness and opinions on functional foods, with concerns about added ingredients versus whole foods.
- Research on behaviors like earlier weight management and poor eating habits influencing children's development.
- Identification of opportunities like personalized nutrition using mobile technologies.
This document summarizes research on childhood obesity, food marketing, and parental influence on children's food consumption. It discusses debates around who is to blame for rising obesity rates, with food advertisers and parents often criticized. The document reviews literature on "pester power" and children's persuasiveness. It questions assumptions that advertising always leads to purchases against parents' judgment or that parents prioritize health. The study explored these issues through research with New Zealand children on advertising exposure, snacking preferences, and parental mediation.
Relationship between urinary Bisphenol A (BPA) levels and diabetes mellitusricguer
This study examined the association between levels of bisphenol A (BPA) in urine and diabetes. The study used data from the National Health and Nutritional Examination Survey from 2003-2008. Higher levels of urinary BPA were associated with increased odds of diabetes, even after adjusting for factors like age, gender, BMI and cholesterol levels. Compared to the lowest quartile of BPA, the highest quartile was associated with 68% higher odds of diabetes. The association was seen in both normal weight and overweight/obese individuals. This study suggests BPA exposure may play a role in diabetes risk.
Diet and Exercise Research Paper 2 PC correctedAustin Clark
This meta-analysis reviewed 7 randomized controlled trials examining the effects of diet, exercise, and mixed interventions on obesity measures in children. The studies included a total of 1,530 children who were approximately 55% overweight or obese at baseline. The analysis found no statistically significant effects of any intervention type on BMI, BMI z-score, or weight compared to controls. There was significant heterogeneity between the studies. While the results did not support the efficacy of these interventions, dietary interventions favored weight gain while exercise and mixed interventions favored weight loss, though insignificantly. Additional high-quality research is still needed to determine effective obesity interventions for children.
Determinants of children's nutritional status among primaryAlexander Decker
This document summarizes a study that assessed the nutritional status of primary school children from farming households in Ado-Ekiti, Nigeria. Anthropometric data was collected from 175 children aged 5-11 through surveys of their parents. The data showed high rates of malnutrition among the children based on weight-for-age, weight-for-height, and height-for-age. Regression analysis found that factors like the mother's education, child's sex, household size and income, and living conditions were significantly associated with the child's nutritional status. The study concluded that many children suffered from issues like obesity, stunting and wasting, and recommendations were made to address the high levels of malnutrition among this group.
Eating Fermented Foods with Live Microbes May Improve Dietary Health.pdfAlexandraDiaz101
Fermented foods like kimchi and yogurt contain live microorganisms that have been associated with improved metabolic health and reduced disease risk. However, little is known about how much of the Western diet contains live microbes and what percentage of Americans consume them. To address this knowledge gap, Marco et al. (2022) conducted a study analyzing dietary recall data from over 74,000 adults and children in the NHANES study from 2001 to 2018. They aimed to estimate microbial content across food items, classify foods as low, medium, or high in microbes, and determine what proportion of Americans ingest live microbes through their diet.
Evaluate the role of leadership on organizational behaviorProv.docxhumphrieskalyn
Evaluate the role of leadership on organizational behavior
Provide the name of the corporation you will be using as the basis for this project.
Provide the organization’s purpose or mission statement.
Describe the organization's industry.
Provide the name and position of the person interviewed during this portion of the assignment (indicate as much pertinent information (e.g., length of service with company, previous roles in the company, educational background, etc.).
Provide the list of interview questions you asked the manager/executive.
Indicate which two - three of the following concepts from this competency that you intend to evaluate the organization/team on and describe the company’s/team’s current situation with each topic you’ve selected:
Power and politics
Communication
Organizational leadership
Organizational structure
Organizational change
Provide citations in APA format for any references.
.
Evaluate the role that PKI plays in cryptography.Ensure that you.docxhumphrieskalyn
Evaluate the role that PKI plays in cryptography.
Ensure that your initial discussion posting has been created by Thursday of each week and then you respond to a minimum of two other learners during the week. Your response must build upon the initial learner's comments. Please ensure that you properly APA format your writing. 500 words.
You must also use a scholarly source
.
More Related Content
Similar to Caffeine intake in children in the United States and 10-ytre.docx
AbstractComment by Tim Cameron Will you be adding the title page.docxbartholomeocoombs
Abstract Comment by Tim Cameron: Will you be adding the title page before this? Comment by Tim Cameron:
Introduction
Children require different types of diets as they grow up. Every stage of development requires a specific type of diet to enhances growth and general well-being. This is why the federal government has set up rules and regulations and governs to school lunches in the United States. The government introduces updated National School Lunch and School Breakfast Programs (NSLP) in 2012 to cut down sugar, sodium and fat intake in the schools. The program included introduction of fruits, whole grains and vegetables every day. Statistics shows that nearly one third of children and adolescents in the country are obese and overweight. Poor nutrition in school lunches also increases chances of developing chronic diseases such as kidney stones, heart diseases and diabetes (Schuna, 2017). Healthy nutrition among children and adolescents enhances memory development, social skills and fine motor skills. Nutritionally sound diets in children and preadolescents plays very important roles in preparing them to (for) a healthier future. It is therefore the responsibility of the government to ensure school lunches are free of excess sugar, salt and fats.
There a strong relationship between nutrition and brain development. High intake of poor diet during the earlier years in children leads to anxiety and depression in later years. It also increases emotional and behavioral problems. However, healthy diets such as vegetables, whole grains and fruits prevent children’s risk to for depression in later years. According to the U.S. Department of Agriculture (USDA, 2018), whole grains contains vitamins B, fiber and minerals that helps kids in school to concentrate in class. The government through the USDA started offering whole-grain rich food in school lunches after the enactment of the Healthy, Hunger-Free Kids Act in 2012. The problem now is that these rules have been relaxed and children and adolescents are back consuming sugary foods. Also most schools do not adhere to NLSP program expectations.
You need a Population Concerns section
Methods This should be Nutrition Relation Topics – what areas of your research are related to nutrition?
Next should be Nutrition Interventions – what studies were conducted?
The research methodology used in this nutrition research paper involved systematic reviews of various sources involving children, preadolescents and nutrition. Most of these studies were obtained from government agency databases such as United States Department of Agriculture (USDA), NHANES and other nutrition databases. The research studies reviewed were majorly conducted through Cross-sectional surveys, surveillance surveys and experimental designs. Data were obtained through admission of questionnaires and interviews. Statistical tools such as regression analysis were used in analyzing the data.
Research Findings This should be Nutrition.
This document summarizes a systematic review of factors associated with childhood overweight and obesity in South Asian countries. The review included 11 studies from India, Pakistan, Bangladesh, and Sri Lanka that used BMI to measure overweight and obesity in children and adolescents. The studies found wide variation in overweight prevalence from 3.1-19.7% and obesity prevalence from 1.2-14.5%. Lack of physical activity was associated with overweight/obesity in most studies, while higher socioeconomic status, urban residence, and consumption of junk food/fast food were also identified as risk factors.
The National Children's Food Survey (NCFS) was conducted between 2003-2004 in Ireland to study food and nutrient intake in children aged 5-12 years. 594 children were selected from 28 primary schools across Ireland using stratified random sampling. Data was collected through 7-day weighed food diaries and questionnaires. Nutrient intake was analyzed using food composition databases. Anthropometric measurements and physical activity data using accelerometers was also collected. Rigorous methodology including training, multiple food diary reviews, and quality control procedures were employed to obtain accurate dietary intake data.
The document summarizes the methodology used for the National Teens' Food Survey conducted in Ireland between 2005-2006. It describes the sampling and selection of schools, recruitment of respondents, data collection methods including food diaries and questionnaires, anthropometric measurements, data analysis, and validation procedures. Over 400 teenagers were selected from 32 secondary schools across Ireland to collect detailed information on food and beverage intake and lifestyle factors over a 7-day period.
This document contains a proposal for a thesis defense on the prevalence of malnutrition among children in Berbera, Somaliland. The study aims to determine the prevalence of malnutrition and associated factors among children aged 6-59 months attending a Mother and Child Health clinic in Berbera. The proposal outlines the background, problem statement, objectives, research questions, scope, significance, and proposed research design of the study, which will use a cross-sectional survey to examine socioeconomic factors, childcare practices, and child characteristics in relation to malnutrition.
The document summarizes the methodology of the Irish Health Behaviour in School-aged Children (HBSC) Study 2010. It describes how a nationally representative sample of school-aged children was obtained through a two-stage cluster sampling process involving randomly selecting schools and classes within schools. Data was collected through self-reported questionnaires administered in classrooms. The study aimed to monitor health behaviors and their social context among Irish children aged 9-18 years in line with international HBSC protocols.
Submission Ide e223bfb4-049f-4c26-ba24-2ede2b73157041 SI.docxdeanmtaylor1545
Submission Ide: e223bfb4-049f-4c26-ba24-2ede2b731570
41% SIMILARITY SCORE 8 CITATION ITEMS 46 GRAMMAR ISSUES 0 FEEDBACK COMMENT
Internet Source 0%
Institution 41%
Avery Bryan
Benchmark – Capstone Project.docx
Summary
1911 Words
Running head: BENCHMARK – CAPSTONE PROJECT 1
BENCHMARK – CAPSTONE PROJECT 2
Use an m-dash.: – —
Use an m-dash.: – —
Benchmark – Capstone Project
Avery Bryan
Professor Tammy Gray
NRS-490
02/09/20
Benchmark – Capstone Project
Obesity is prevalent among the African American children. Most of the African
American families fall in the low income groups. This results to them not being able to purchase
BENCHMARK – CAPSTONE PROJECT 3
Spelling mistake: junky junk
Passive voice: be considered to be
Unpaired braces, brackets, quotation m...: (
Possible typo: et al et al.
Unpaired braces, brackets, quotation m...: (
Spelling mistake: Chircop Chirp
healthy foods. There is a perception that healthy foods are very expensive to purchase. Their
food consumption to a large extent consists of proteins from genetically modified organisms
(GMOs), larger amounts of refined grains and sugars and high level of fructose corn syrup. They
consume junky foods that are cheaper to buy. These foods contribute a lot to childhood obesity
among the African American children who consume them.
Obesity is not a disease in itself. However, it leads to an increased risk of individuals to
develop other diseases that may be considered to be chronic. These chronic diseases include
some types of cancer, coronary heart disease, stroke, osteoarthritis, type 2 diabetes and other
complicated health conditions. A myriad of social and physical negative consequences are
associated with obesity. The conditions associated with obesity carry both short term and long
term negative outcomes that are extremely expensive to treat both at individual and societal
level. It is less expensive to prevent obesity than to cure it. It is therefore important to address the
problem of obesity by implementing effective preventive measures.
Childhood obesity is a world-wide health problem and development of interventions to
prevent or control it should be a priority (Amini et al, (2014). Obesity is prevalent and on the
increase among many school going African American children in the US. Physical activity and
healthy diet are the key preventive interventions that can be implemented to tackle the challenge
of childhood obesity (Chircop et al., (2015).
Obesity is a major health concern. This is because children who have obesity, compared
to those with normal weight are at .
This needs assessment examines overweight and obesity rates among children in the Harrison School District Two in El Paso County, Colorado. Interviews with local stakeholders and a review of secondary data revealed high rates of childhood obesity and a lack of access to healthy foods and physical activity opportunities. A sidewalk audit and SOPARC assessment of Meadows Park found the park is underutilized despite being accessible. Implications of the study include proposing additional programs like farmers markets, physical activity classes, and neighborhood improvements to increase access to healthy lifestyle options for children.
Nutritional Status of School Age Children in Private Elementary Schools: Basi...IJAEMSJORNAL
Department of Education (DepEd) organizes nutritional programs to improve the health status of children in public schools. Likewise, the researcher believes that health awareness must be raised in private schools as well. This study aimed to affect the community to be aware and more knowledgeable about nutrition. Specifically, this study focused on the nutritional status of school age children in private elementary schools in Santa Rosa, Nueva Ecija. It sought to determine the profile of the learners, anthropometrics, clinical data and the knowledge of the learners as to dietary and the significant relationship between the profile of the learners and the nutritional status of the school aged children. With all the data gathered a meal management program was proposed. The study employed the quantitative description design. The study manifests that majority of the respondents were not yet aware of what they eat. In addition, age, greatly affects the respondent’s anthropometrics as to height. More so, age, number of siblings and family income, greatly affect the respondents’ anthropometrics as to weight. The researcher adopted the Nutritional Guidelines for Filipino program that was developed by the DOST- FNRI.
This document provides a summary of a study on functional food ideation conducted by Company X. Key trends identified include growing demand for more nutritious, local, and natural whole foods. However, concerns remain regarding the overall quality and safety of the food supply. Unhealthy eating behaviors persist in both adults and children. New technologies offer potential for more personalized nutrition approaches. Key nutrition issues cited include growing rates of obesity, poor dental health, deficiencies in vitamins/minerals, and concerns with the changes occurring in the food supply and eating patterns that may impact health.
The Effect of Community Risk Perception on Type-2 Diabetes Mellitus Screening...Carly Freeman
This document summarizes a study on the effect of risk perception on type 2 diabetes screening in a rural Thai village. The study found that:
1) The prevalence of type 2 diabetes was much higher in adults over age 45 (12.8%) than under age 45 (0.7%), and screening rates followed a similar pattern.
2) Less than half of residents were aware of the Ministry of Health's dietary recommendations. Risk perception emphasized genetic and age-related factors over behavioral factors like diet.
3) There may be an undiagnosed population of type 2 diabetes residents because of a misguided risk perception from a lack of nutritional knowledge, as screening participation was low among adults under 45.
Infant Nutrition to 2020- An Ideation StudyBrand Acumen
This document summarizes the findings of a study on infant nutrition trends conducted for Company X. Key trends identified include growing demand for fresh, local, whole foods and concerns about the overall nutrition quality and safety of the food supply. Issues like childhood obesity, vitamin/mineral deficiencies, and unhealthy eating behaviors are ongoing problems. The document also discusses awareness and perceptions of functional foods and emerging research areas like personalized nutrition using mobile technologies. Identification of current nutrition, behavior, and weight management trends in both children and adults is provided to help inform new product development opportunities.
(1) Dr. James R. Coughlin, a food toxicologist with over 35 years of experience, testified before the U.S. Senate Committee on concerns about marketing energy drinks to youth.
(2) He stated that restrictions cannot be supported scientifically because caffeine from energy drinks is a small source of caffeine compared to coffee, tea, and soda, and that the caffeine content in mainstream energy drinks is comparable or less than that in coffee.
(3) The best available clinical evidence shows that caffeine consumption at current levels in the U.S. population, including in children and teens, presents no safety concerns.
The document provides an executive summary of a study on functional food innovation conducted for Company X. Key findings from the study include:
- Trends in more sustainable, nutritious eating, but also continued unhealthy behaviors like fast food consumption and snacking.
- Major nutrition issues like obesity, deficiencies in vitamins/minerals, and poor overall diet quality for both children and adults.
- Mixed awareness and opinions on functional foods, with concerns about added ingredients versus whole foods.
- Research on behaviors like earlier weight management and poor eating habits influencing children's development.
- Identification of opportunities like personalized nutrition using mobile technologies.
This document summarizes research on childhood obesity, food marketing, and parental influence on children's food consumption. It discusses debates around who is to blame for rising obesity rates, with food advertisers and parents often criticized. The document reviews literature on "pester power" and children's persuasiveness. It questions assumptions that advertising always leads to purchases against parents' judgment or that parents prioritize health. The study explored these issues through research with New Zealand children on advertising exposure, snacking preferences, and parental mediation.
Relationship between urinary Bisphenol A (BPA) levels and diabetes mellitusricguer
This study examined the association between levels of bisphenol A (BPA) in urine and diabetes. The study used data from the National Health and Nutritional Examination Survey from 2003-2008. Higher levels of urinary BPA were associated with increased odds of diabetes, even after adjusting for factors like age, gender, BMI and cholesterol levels. Compared to the lowest quartile of BPA, the highest quartile was associated with 68% higher odds of diabetes. The association was seen in both normal weight and overweight/obese individuals. This study suggests BPA exposure may play a role in diabetes risk.
Diet and Exercise Research Paper 2 PC correctedAustin Clark
This meta-analysis reviewed 7 randomized controlled trials examining the effects of diet, exercise, and mixed interventions on obesity measures in children. The studies included a total of 1,530 children who were approximately 55% overweight or obese at baseline. The analysis found no statistically significant effects of any intervention type on BMI, BMI z-score, or weight compared to controls. There was significant heterogeneity between the studies. While the results did not support the efficacy of these interventions, dietary interventions favored weight gain while exercise and mixed interventions favored weight loss, though insignificantly. Additional high-quality research is still needed to determine effective obesity interventions for children.
Determinants of children's nutritional status among primaryAlexander Decker
This document summarizes a study that assessed the nutritional status of primary school children from farming households in Ado-Ekiti, Nigeria. Anthropometric data was collected from 175 children aged 5-11 through surveys of their parents. The data showed high rates of malnutrition among the children based on weight-for-age, weight-for-height, and height-for-age. Regression analysis found that factors like the mother's education, child's sex, household size and income, and living conditions were significantly associated with the child's nutritional status. The study concluded that many children suffered from issues like obesity, stunting and wasting, and recommendations were made to address the high levels of malnutrition among this group.
Eating Fermented Foods with Live Microbes May Improve Dietary Health.pdfAlexandraDiaz101
Fermented foods like kimchi and yogurt contain live microorganisms that have been associated with improved metabolic health and reduced disease risk. However, little is known about how much of the Western diet contains live microbes and what percentage of Americans consume them. To address this knowledge gap, Marco et al. (2022) conducted a study analyzing dietary recall data from over 74,000 adults and children in the NHANES study from 2001 to 2018. They aimed to estimate microbial content across food items, classify foods as low, medium, or high in microbes, and determine what proportion of Americans ingest live microbes through their diet.
Similar to Caffeine intake in children in the United States and 10-ytre.docx (20)
Evaluate the role of leadership on organizational behaviorProv.docxhumphrieskalyn
Evaluate the role of leadership on organizational behavior
Provide the name of the corporation you will be using as the basis for this project.
Provide the organization’s purpose or mission statement.
Describe the organization's industry.
Provide the name and position of the person interviewed during this portion of the assignment (indicate as much pertinent information (e.g., length of service with company, previous roles in the company, educational background, etc.).
Provide the list of interview questions you asked the manager/executive.
Indicate which two - three of the following concepts from this competency that you intend to evaluate the organization/team on and describe the company’s/team’s current situation with each topic you’ve selected:
Power and politics
Communication
Organizational leadership
Organizational structure
Organizational change
Provide citations in APA format for any references.
.
Evaluate the role that PKI plays in cryptography.Ensure that you.docxhumphrieskalyn
Evaluate the role that PKI plays in cryptography.
Ensure that your initial discussion posting has been created by Thursday of each week and then you respond to a minimum of two other learners during the week. Your response must build upon the initial learner's comments. Please ensure that you properly APA format your writing. 500 words.
You must also use a scholarly source
.
Evaluate the presence and effects of alteration in the homeostatic s.docxhumphrieskalyn
Evaluate the presence and effects of alteration in the homeostatic state secondary to gender, genetic, ethnic and temporal variables
Select one of the case studies below, and include in your discussion an evaluation of the presence and effects of alteration in the homeostatic state secondary to gender, genetic, ethnic, and temporal variables.
Requirements:
Make sure all of the topics in the case study have been addressed.
Cite at least three sources; journal articles, textbooks or evidenced-based websites to support the content.
All sources must be within 5 years.
Do not use .com, Wikipedia, or up-to-date, etc., for your sources.
Case Study 1
Structure and Function of the Respiratory System
Brad is 45 years old and has been working as a coal cutter in a mine for the last 25 years. He likes the job because it pays well and the same mine had employed his father. Like many of his colleagues, Brad has had problems with a chronic cough. He has avoided his annual checkups for fear that he will be told he has “black lung,” or coal worker’s pneumoconiosis. The disease causes fibrosis, decreased diffusing capacity, and permanent small airway dilation. In later stages, pulmonary capillaries, alveoli, and airways are destroyed.
How can the disease described above create a mismatch between ventilation and perfusion? Use your understanding of alveolar dead space and physiologic shunt to explain your answer.
Individuals with chronic obstructive pulmonary disease have more difficulty exhaling than inhaling. Why is this so?
In general terms, what mechanisms in lung disease can affect diffusing capacity across alveolar membranes? Use the Fick law to explain your answer.
Case Study 2
Respiratory Tract Infections, Neoplasms, and Childhood Disorders
Patricia was called at work by a woman at the local daycare center. She told Patricia to come and pick up her son because he was not feeling well. Her son, three-and-a-half-year-old Marshall, had been feeling tired and achy when he woke up. While at daycare, his cheeks had become red and he was warm to touch. He did not want to play with his friends, and by the time Patricia arrived, he was crying. Later that afternoon, Marshall’s condition worsened. He had fever, chills, a sore throat, runny nose, and a dry hacking cough. Suspecting Marshall had influenza, Patricia wrapped him up and took him to the community health care clinic.
Why did Marshall’s presentation lead Patricia to think he had influenza and not a cold? Why is it important to medically evaluate and diagnose a potential influenza infection?
Describe the pathophysiology of the influenza virus. Outline the properties of influenza A antigens that allow them to exert their effects in the host.
Marshall may be at risk at contracting secondary bacterial pneumonia. Why is this so? Explain why cyanosis may be a feature associated with pneumonia.
Case Study 3
Disorders of Ventilation and Gas Exchange
Emmanuel and his mother live in an.
Evaluate the role of a digital certificate in cryptography. How doe.docxhumphrieskalyn
Evaluate the role of a digital certificate in cryptography. How does it impact the security posture of an organization?
Write a minimum of 2 to pages
The Paper must include scholarly references of 2
Make sure to follow APA Guidelines
.
Evaluate the merits of Piaget’s stage theory for explaining cognitiv.docxhumphrieskalyn
Evaluate the merits of Piaget’s stage theory for explaining cognitive development.
Discuss evidence that supports his theory as well as evidence that calls it into question.
Discuss your personal opinions about stage theories in general. Who are some of the major detractors and how would you address them?
.
Evaluate the notion that white collar offenders are intrinsically di.docxhumphrieskalyn
Evaluate the notion that white collar offenders are intrinsically different from non-offenders. What are the principal elements of the demonic, biogenetic, psychological and sociogenic perspectives on this question, and the evidence for an answer to the question within these perspectives? Which individualistic attributes of white collar offenders do you regard as meriting further systematic study, and why?
.
EV 551 Hazardous Materials Assessment – Summer2020Homework 1 – 4.docxhumphrieskalyn
EV 551 Hazardous Materials Assessment – Summer2020
Homework 1 – 40 points
1. Which of the following is not a part of the HAZWOPER process:
a.
Recognition of hazards
b.
Evaluation of hazards
c.
Control of hazards
d.
Information gathering
e.
Safety from hazards
f.
All are part of the process
2.
Hazardous waste site workers must:
a.
Receive 40-hour OSHA 1910.120 training plus 24 hours of field supervision if exposed over the PEL
b.
Receive 40-hour training plus 8 hours field supervision if exposed below the PEL and when respirators are not required
c.
8-hour annual refresher training
d.
All of the above
3.
First Responder Operations level training allows persons to:
a.
Witness or discover a release
b.
Perform defensive actions
c.
Stop the release
d.
A and B are true
e.
All of the above
4.
Recognition of hazards includes:
a.
Identifying the materials involved in the release
b.
Identifying the degree of hazards present
c.
Provide the level of protection needed for site workers
d.
A and B are correct
e.
All of the above
5.
The most important response activity at a hazardous waste work site is:
a.
Evaluation of hazards
b.
Control of hazards
c.
Recognition of hazards
d.
Safety precautions
6.
Frequent hazard types found at response sites include:
a.
Physical hazards
b.
Biological hazards
c.
Chemical hazards
d.
Mechanical hazards
e.
All of the above
7.
The purpose of initial control activities is to:
a.
Immediately assess clean up alternatives
b.
Provide time to responders to address long-term hazards
c.
Slowly size up response activities
d.
Both A and B are correct
e.
None of the above
8.
Spill reporting is covered by which of these federal regulations:
a.
Superfund
b.
DOT
c.
RCRA
d.
Clean Water Act
e.
A, B, and D are correct
9.
The effects of toxic materials on the human body are determined by:
a.
Routes of exposure
b.
Dose
c.
Duration and frequency of exposure
d.
All of the above
10.
What are the four major pathways that chemical substances can enter the body?
a.
___________________________________________________
b.
___________________________________________________
c.
___________________________________________________
d.
___________________________________________________
11.
What is the primary route of exposure to hazardous waste site workers or incident
responders?
a.
Ingestion
b.
Dermal absorption
c.
Inhalation
d.
Both a and b are correct
12.
Dermal absorption may occur with which form(s) of a chemical:
a.
Solid
b.
Liquid
c.
Aerosol
d.
Mist
e.
All of the above
13.
The dose-response curve illustrates:
a.
The indirect relationship between dose and response
b.
The direct relationship between dose and response
c.
The average number of affected individuals
d.
None of the above
14.
For most chemicals, a low dose does that does not show an appreciable hazard to exposed individuals is called the:
a.
LOAEL
.
Evaluate the history of cryptography from its origins. Analyze how .docxhumphrieskalyn
Cryptography has a long history that students must evaluate in at least two written pages using a minimum of three scholarly sources, with proper APA formatting including a separate title page and references cited. The assignment requires an analysis of how cryptography was used historically and a description of its development over time.
Evaluate the evidence provided by Apollo Shoes.Decide how to s.docxhumphrieskalyn
Evaluate
the evidence provided by Apollo Shoes.
Decide
how to structure the audit report for the provided evidence.
Compose
an audit report
reflecting the appropriate length, sections, and content for the provided information.
Include
a description of the evidence, the accounting sampling and testing procedures used, and a brief description of the value of the audit report
Can anyone do this assignement. It is due by 9pm 11/12/2012 Eastern Standard Time..
.
Evaluate the Health History and Medical Information for Mrs. J.,.docxhumphrieskalyn
Evaluate the Health History and Medical Information for Mrs. J., presented below.
Based on this information, formulate a conclusion based on your evaluation, and complete the Critical Thinking Essay assignment, as instructed below.
Health History and Medical Information
Health History
Mrs. J. is a 63-year-old married woman who has a history of hypertension, chronic heart failure, and chronic obstructive pulmonary disease (COPD). Despite requiring 2L of oxygen/nasal cannula at home during activity, she continues to smoke two packs of cigarettes a day and has done so for 40 years. Three days ago, she had sudden onset of flu-like symptoms including fever, productive cough, nausea, and malaise. Over the past 3 days, she has been unable to perform ADLs and has required assistance in walking short distances. She has not taken her antihypertensive medications or medications to control her heart failure for 3 days. Today, she has been admitted to the hospital ICU with acute decompensated heart failure and acute exacerbation of COPD.
Subjective Data
Is very anxious and asks whether she is going to die.
Denies pain but says she feels like she cannot get enough air.
Says her heart feels like it is "running away."
Reports that she is exhausted and cannot eat or drink by herself.
Objective Data
Height 175 cm; Weight 95.5kg.
Vital signs: T 37.6C, HR 118 and irregular, RR 34, BP 90/58.
Cardiovascular: Distant S1, S2, S3 present; PMI at sixth ICS and faint: all peripheral pulses are 1+; bilateral jugular vein distention; initial cardiac monitoring indicates a ventricular rate of 132 and atrial fibrillation.
Respiratory: Pulmonary crackles; decreased breath sounds right lower lobe; coughing frothy blood-tinged sputum; SpO2 82%.
Gastrointestinal: BS present: hepatomegaly 4cm below costal margin.
Intervention
The following medications administered through drug therapy control her symptoms:
IV furosemide (Lasix)
Enalapril (Vasotec)
Metoprolol (Lopressor)
IV morphine sulphate (Morphine)
Inhaled short-acting bronchodilator (ProAir HFA)
Inhaled corticosteroid (Flovent HFA)
Oxygen delivered at 2L/ NC
Critical Thinking Essay
In 750-1,000 words, critically evaluate Mrs. J.'s situation. Include the following:
Describe the clinical manifestations present in Mrs. J.
Discuss whether the nursing interventions at the time of her admissions were appropriate for Mrs. J. and explain the rationale for each of the medications listed.
Describe four cardiovascular conditions that may lead to heart failure and what can be done in the form of medical/nursing interventions to prevent the development of heart failure in each condition.
Taking into consideration the fact that most mature adults take at least six prescription medications, discuss four nursing interventions that can help prevent problems caused by multiple drug interactions in older patients. Provide a rationale for each of the interventions you recommend.
Provide a health promotion .
Evaluate the current state of the health care system in Sacramento. .docxhumphrieskalyn
Evaluate the current state of the health care system in Sacramento. Read local newspaper articles, watch videos, and explore government and health care sites for information about challenges to the city’s health care needs (shortages, financial difficulties, privacy issues, etc.).
Propose a new or improved health care service that you would introduce into the community. Explain why the service is needed and how it would improve the community.
Design a new health care facility that would offer a new or an improved service to the community. Present a floor plan of the facility that includes the surface area, purpose for, and description of each space.
Write a 700 - to 1,050–word report about the state of health care in your selected city, your proposal for a new or improved service, and the floor plan of a facility to implement that service.
.
Evaluate the advantages and disadvantages of the various decis.docxhumphrieskalyn
Evaluate the advantages and disadvantages of the various decision-making tools listed (e.g., regular payback, discounted payback, net present value (NPV), internal rate of return (IRR), and modified internal rate of return).
Describe a project scenario in which you would recommend one method, or a combination of methods, as being more effective than others. Draw from your professional experience and/or additional research, and provide a rationale for your recommendation.
.
Evaluate some technologies that can help with continuous monitoring..docxhumphrieskalyn
Evaluate some technologies that can help with continuous monitoring. One example of many is Cyberscope, an automated reporting tool for security reporting that receives recurring data feeds to assess the security posture of IT systems. Discuss the pros and cons of using continuous monitoring tools and make other suggestions to improve continuous monitoring.
In the second week, discuss the major challenges in continuous monitoring of information systems security.
*will send 2 classmates after completion of discussion so you can respond!
.
Evaluate progress on certification plansReport your prog.docxhumphrieskalyn
Evaluate progress on certification plans
Report your progress on the Certification Plan completed in Week 1 and submitted in Week 4.
What have you done to prepare for your certification?
Have you completed the scheduled tasks assigned on your timeline? If not, what are your plans to stay on schedule?
Rubric:
Quality of Work Submitted:
The extent of which work meets the assigned criteria and work reflects graduate level critical and analytic thinking.--
Quality of Work Submitted:
The purpose of the paper is clear.--
Written Expression and Formatting
Paragraph and Sentence Structure: Paragraphs make clear points that support well developed ideas, flow logically, and demonstrate continuity of ideas. Sentences are clearly structured and carefully focused--neither long and rambling nor short and lacking substance.--
.
Evaluate how you have achieved course competencies and your plans to.docxhumphrieskalyn
Evaluate how you have achieved course competencies and your plans to develop further in these areas. The course competencies for this course are as follows:
Explore the historical evolution of the advance practice nurse.
Differentiate the roles and scope of practice for nurses working in advanced clinical, education, administration, informatics, research, and health policy arenas.
Analyze attributes of the practice arena such as access and availability, degree of consumer choice, competition, and financing that impact advanced practice nurses and their ability to effectively collaborate with other health professionals.
Integrate evidence from research and theory into discussions of practice competencies, health promotion and disease prevention strategies, quality improvement, and safety standards.
Identify collaborative, organizational, communication, and leadership skills in working with other professionals in healthcare facilities and/or academic institutions.
Synthesize knowledge from values theory, ethics, and legal/regulatory statutes in the development of a personal philosophy for a career as an advanced practice nurse.
.
Evaluate how information privacy and security relates to the Interne.docxhumphrieskalyn
Evaluate how information privacy and security relates to the Internet, which is the major information conduit for businesses and individuals.
Write a paragraph of at least 200 words addressing the following: Explain how your expectations for Internet privacy differ for the following situations: Accessing the web at home, at work, and in a public setting, such as a library computer lab or Wi–Fi zone. What is the basis for your expectations? Is it legal to use your neighbors’ wireless Internet signal? Is it ethical? Explain your reasoning.
.
Evaluate assessment of suicide in forensic settings andor cri.docxhumphrieskalyn
Evaluate assessment of suicide in forensic settings and/or criminal justice institutions by addressing the following:
Who would serve on the task force?
Who would be involved in suicide prevention or identification if you were able to intervene at the institution?
What would the interventions look like? What would be some of the policies and procedures that you might implement to ensure that best practices are met?
Provide specific examples based on your current or future forensic role.
Include an analysis of your own prejudices and biases regarding inmate suicides (e.g., consider a child murderer).
.
Evaluate different approaches to ethical decision making. Then, choo.docxhumphrieskalyn
Evaluate different approaches to ethical decision making. Then, choose one of them to apply to an ethical issue you have identified.
By successfully completing this assessment, you will demonstrate your proficiency in the following course competencies and assessment criteria:
Competency 1: Evaluate the parameters for ethical decision making in 21st century multicultural business environments.
Evaluate the parameters of various ethical decision-making approaches.
Competency 3: Evaluate organizational policy within the framework of ethical standards.
Analyze an ethical dilemma using an ethical decision-making approach.
Assess the validity of a resolution suggested by a selected ethical decision-making approach.
Competency 4: Communicate effectively.
Communicate the analysis of ethical decision making clearly and effectively.
.
Evaluate and grade websites in terms of their compliance with PL pri.docxhumphrieskalyn
Evaluate and grade websites in terms of their compliance with PL principles. You will first do this with a local government site (Project 1a) and then with a federal site (Project 1b). You will perform the same analysis and evaluation that is done by those who volunteer with the Center for Plain Language to review and grade federal websites as part of the plain language Federal Report Card.
.
Evaluate at least (2) factors that make financial statement analys.docxhumphrieskalyn
Evaluate at least (2) factors that make financial statement analysis essential to management, investors, and creditors. Provide a rationale for your response.
Imagine you are considering investing in a corporation. Examine the key information you would look for in a company’s financial statements and explain why this information would be important to you. Suggest at least two (2) financial statement analysis tools you would use to evaluate this company’s financial statements. Provide a rationale for your suggestions.
.
Temple of Asclepius in Thrace. Excavation resultsKrassimira Luka
The temple and the sanctuary around were dedicated to Asklepios Zmidrenus. This name has been known since 1875 when an inscription dedicated to him was discovered in Rome. The inscription is dated in 227 AD and was left by soldiers originating from the city of Philippopolis (modern Plovdiv).
Walmart Business+ and Spark Good for Nonprofits.pdfTechSoup
"Learn about all the ways Walmart supports nonprofit organizations.
You will hear from Liz Willett, the Head of Nonprofits, and hear about what Walmart is doing to help nonprofits, including Walmart Business and Spark Good. Walmart Business+ is a new offer for nonprofits that offers discounts and also streamlines nonprofits order and expense tracking, saving time and money.
The webinar may also give some examples on how nonprofits can best leverage Walmart Business+.
The event will cover the following::
Walmart Business + (https://business.walmart.com/plus) is a new shopping experience for nonprofits, schools, and local business customers that connects an exclusive online shopping experience to stores. Benefits include free delivery and shipping, a 'Spend Analytics” feature, special discounts, deals and tax-exempt shopping.
Special TechSoup offer for a free 180 days membership, and up to $150 in discounts on eligible orders.
Spark Good (walmart.com/sparkgood) is a charitable platform that enables nonprofits to receive donations directly from customers and associates.
Answers about how you can do more with Walmart!"
How to Setup Warehouse & Location in Odoo 17 InventoryCeline George
In this slide, we'll explore how to set up warehouses and locations in Odoo 17 Inventory. This will help us manage our stock effectively, track inventory levels, and streamline warehouse operations.
Beyond Degrees - Empowering the Workforce in the Context of Skills-First.pptxEduSkills OECD
Iván Bornacelly, Policy Analyst at the OECD Centre for Skills, OECD, presents at the webinar 'Tackling job market gaps with a skills-first approach' on 12 June 2024
Communicating effectively and consistently with students can help them feel at ease during their learning experience and provide the instructor with a communication trail to track the course's progress. This workshop will take you through constructing an engaging course container to facilitate effective communication.
Chapter wise All Notes of First year Basic Civil Engineering.pptxDenish Jangid
Chapter wise All Notes of First year Basic Civil Engineering
Syllabus
Chapter-1
Introduction to objective, scope and outcome the subject
Chapter 2
Introduction: Scope and Specialization of Civil Engineering, Role of civil Engineer in Society, Impact of infrastructural development on economy of country.
Chapter 3
Surveying: Object Principles & Types of Surveying; Site Plans, Plans & Maps; Scales & Unit of different Measurements.
Linear Measurements: Instruments used. Linear Measurement by Tape, Ranging out Survey Lines and overcoming Obstructions; Measurements on sloping ground; Tape corrections, conventional symbols. Angular Measurements: Instruments used; Introduction to Compass Surveying, Bearings and Longitude & Latitude of a Line, Introduction to total station.
Levelling: Instrument used Object of levelling, Methods of levelling in brief, and Contour maps.
Chapter 4
Buildings: Selection of site for Buildings, Layout of Building Plan, Types of buildings, Plinth area, carpet area, floor space index, Introduction to building byelaws, concept of sun light & ventilation. Components of Buildings & their functions, Basic concept of R.C.C., Introduction to types of foundation
Chapter 5
Transportation: Introduction to Transportation Engineering; Traffic and Road Safety: Types and Characteristics of Various Modes of Transportation; Various Road Traffic Signs, Causes of Accidents and Road Safety Measures.
Chapter 6
Environmental Engineering: Environmental Pollution, Environmental Acts and Regulations, Functional Concepts of Ecology, Basics of Species, Biodiversity, Ecosystem, Hydrological Cycle; Chemical Cycles: Carbon, Nitrogen & Phosphorus; Energy Flow in Ecosystems.
Water Pollution: Water Quality standards, Introduction to Treatment & Disposal of Waste Water. Reuse and Saving of Water, Rain Water Harvesting. Solid Waste Management: Classification of Solid Waste, Collection, Transportation and Disposal of Solid. Recycling of Solid Waste: Energy Recovery, Sanitary Landfill, On-Site Sanitation. Air & Noise Pollution: Primary and Secondary air pollutants, Harmful effects of Air Pollution, Control of Air Pollution. . Noise Pollution Harmful Effects of noise pollution, control of noise pollution, Global warming & Climate Change, Ozone depletion, Greenhouse effect
Text Books:
1. Palancharmy, Basic Civil Engineering, McGraw Hill publishers.
2. Satheesh Gopi, Basic Civil Engineering, Pearson Publishers.
3. Ketki Rangwala Dalal, Essentials of Civil Engineering, Charotar Publishing House.
4. BCP, Surveying volume 1
Chapter wise All Notes of First year Basic Civil Engineering.pptx
Caffeine intake in children in the United States and 10-ytre.docx
1. Caffeine intake in children in the United States and 10-y
trends: 2001–20101–4
Namanjeet Ahluwalia, Kirsten Herrick, Alanna Moshfegh, and
Michael Rybak
ABSTRACT
Background: Because of the increasing concern of the potential
adverse effects of caffeine intake in children, recent estimates
of
caffeine consumption in a representative sample of children are
needed.
Objectives: We provide estimates of caffeine intake in children
in
absolute amounts (mg) and in relation to body weight (mg/kg)
to
examine the association of caffeine consumption with
sociodemo-
graphic factors and describe trends in caffeine intake in children
in
the United States.
Design: We analyzed caffeine intake in 3280 children aged 2–19
y
who participated in a 24-h dietary recall as part of the
NHANES,
which is a nationally representative survey of the US population
with a cross-sectional design, in 2009–2010. Trends over time
be-
tween 2001 and 2010 were examined in 2–19-y-old children (n
=
18,530). Analyses were conducted for all children and repeated
for
2. caffeine consumers.
Results: In 2009–2010, 71% of US children consumed caffeine
on
a given day. Median caffeine intakes for 2–5-, 6–11-, and 12–
19-y
olds were 1.3, 4.5, and 13.6 mg, respectively, and 4.7, 9.1, and
40.6
mg, respectively, in caffeine consumers. Non-Hispanic black
chil-
dren had lower caffeine intake than that of non-Hispanic white
counterparts. Caffeine intake correlated positively with age; this
association was independent of body weight. On a given day,
10% of 12–19-y-olds exceeded the suggested maximum caffeine
intake of 2.5 mg/kg by Health Canada. A significant linear trend
of decline in caffeine intake (in mg or mg/kg) was noted overall
for
children aged 2–19 y during 2001–2010. Specifically, caffeine
in-
take declined by 3.0 and 4.6 mg in 2–5- and 6–11-y-old caffeine
consumers, respectively; no change was noted in 12–19-y-olds.
Conclusion: A majority of US children including preschoolers
con-
sumed caffeine. Caffeine intake was highest in 12–19-y-olds
and
remained stable over the 10-y study period in this age group.
Am J
Clin Nutr 2014;100:1124–32.
INTRODUCTION
Caffeine is a commonly consumed stimulant present naturally
in or added to foods and beverages. Caffeine consumption in
children has received considerable interest because of the con-
cern of adverse health effects. Caffeine intake of 100–400 mg
has
been associated with nervousness, jitteriness, and fidgetiness
3. (1, 2). Because of the continued brain development involving
myelination and pruning processes, children may be particularly
sensitive to caffeine (3, 4). There has been some evidence that
has linked caffeine intake in children to sleep dysfunction, el-
evated blood pressure, impairments in mineral absorption and
bone health, and increased alcohol use or dependence (1, 5–7).
In addition, the routine use of caffeinated sugar-sweetened
beverages may contribute to weight gain and dental cavities (8).
Caffeine toxicity in children has also been described involving
tachycardia, central nervous system agitation, gastrointestinal
disturbance, and diuresis (6, 9, 10). Health Canada has put forth
maximal daily caffeine intake guidelines for children and ado-
lescents (6, 11). Although no such recommendations have been
set in the United States, the American Academy of Pediatrics
has underscored that “caffeine and other stimulant substances
contained in energy drinks have no place in the diet of children”
(12).
Caffeine consumption has also been associated with certain
health benefits such as increased endurance, attention, and vig-
ilance and a reduced reaction time in some studies (9, 13, 14).
Perceived positive effects on mood and cognition as well as
physical performance may encourage preteens and adolescents
to
consume caffeinated products (2, 15, 16).
The literature on caffeine consumption in a representative
sample of US children has been primarily based on older data,
namely the US Department of Agriculture Continuing Survey of
Food Intakes by Individuals (CSFII)5 1994–1996 and 1998 (16,
17). In addition, caffeine intake from beverages from the 1999
US Share of Intake Panel (SIP) survey in caffeine consumers
has
also been published (18). A 2010 US Food and Drug Admin-
istration report also presented findings from the analysis of
4. older
data from NHANES 2005–2006 (19). Because of the current
1
From the Division of Health and Nutrition Examination
Surveys, Na-
tional Center for Health Statistics, CDC, Hyattsville, MD (NA
and KH);
the National Center for Environmental Health, CDC, Atlanta,
GA (MR);
and the Food Surveys Research Group, Beltsville Human
Nutrition Research
Center–Agricultural Research Service, USDA, Beltsville, MD
(AM).
2 Findings and conclusions in this report are those of the
authors and do
not necessarily represent the official position of the National
Center for
Health Statistics, CDC.
3 This work was not supported by any external grant.
4 Address correspondence to N Ahluwalia, Division of Health
and Nutri-
tion Examination Surveys, National Center for Health Statistics,
CDC, 3311
Toledo Road, Room 4110, Hyattsville, MD 20782. E-mail:
[email protected]
cdc.gov.
5 Abbreviations used: CSFII, Continuing Survey of Food
5. Intakes by In-
dividuals; MEC, mobile examination center; PIR, poverty
income ratio; SIP,
Share of Intake Panel.
ReceivedDecember 19, 2013. Accepted for publication July 3,
2014.
First published online August 27, 2014; doi:
10.3945/ajcn.113.082172.
1124 Am J Clin Nutr 2014;100:1124–32. Printed in USA. �
2014 American Society for Nutrition
D
ow
nloaded from
https://academ
ic.oup.com
/ajcn/article-abstract/100/4/1124/4576506 by guest on 05 M
arch 2020
debate on the safety of caffeine intake by children (1, 12, 18)
and deliberations to evaluate maximal intake recommendations,
it is important to describe caffeine intake from more recent data
available on a nationally representative sample such as the
NHANES.
Trends in beverage consumption have changed over time (16,
6. 20), and several caffeinated beverages and energy drinks have
been
introduced in the past decade, some marketed especially to
youth
(12, 15, 16). Few reports have described trends in caffeine
intake
both in milligrams and milligrams per kilogram of body weight
by
age in the United States (16, 21). Thus, our objective was to
provide estimates of the distribution of caffeine intake in
absolute
amounts and in milligrams per kilogram in a representative
sample
of American children (2–19 y old) by using the most recent di-
etary data available from the NHANES (ie, 2009–2010) in re-
lation to demographic characteristics and examine the trends in
caffeine consumption between 2001 and 2010 in children.
SUBJECTS AND METHODS
Study design
The NHANES is a series of large, complex, stratified,
multistage
probability surveys of the US civilian, noninstitutionalized pop-
ulation conducted by the National Center for Health Statistics,
CDC (22). Briefly, NHANES is conducted yearly in w5000
individuals, and data are publicly released every 2 y on w10,000
individuals. Participants in the NHANES are administered a se-
ries of questionnaires in a detailed in-home interview followed
by a scheduled visit at the mobile examination center (MEC).
At the MEC visit, participants receive a physical examination
as well as a dietary interview, which is commonly referred to as
the What We Eat in America component of the NHANES. The
NHANES protocol was approved by the National Center for
Health Statistics’s Research Ethics Review board. Informed
7. consent was obtained from persons aged $18 y. For participants
,18 y of age, written parental consent was obtained, and child
assent was obtained for individuals from 7 to 17 y of age. The
most recent available data on caffeine intake from the NHANES
(from the 2009–2010 survey) were used for the current analysis
to describe caffeine consumption by demographic characteris-
tics; data from this single survey cycle were sufficient to
provide
stable national estimates. We used NHANES data from 2001
to 2010 (2001–2002, 2003–2004, 2005–2006, 2007–2008, and
2009–2010 survey cycles) to conduct the trends analysis; be-
cause of changes in the dietary data collection methodology on
merging of the CSFII with NHANES in 1999–2000, data from
1999 to 2000 were not included in the trends analysis. The un-
weighted total examination response rate for the 5 survey cycles
examined for participants 2–19 y of age ranged from 81% to
88%
(23).
Dietary interview
The type and quantity of all foods and beverages consumed in
a single 24-h period, specifically the 24-h period before the
dietary interview (from midnight to midnight) at the MEC, were
collected by trained interviewers with the use of a computer-
assisted dietary interview system with standardized probes (ie,
the USDA’s Automated Multiple-Pass Method). Specifically for
beverages for which caffeine may be removed such as soda,
coffee,
tea, and energy drinks, probes were used to ascertain if the bev-
erage reported was caffeine free. The Automated Multiple-Pass
Method is designed to enhance a complete and accurate data
collection while reducing the respondent burden (24, 25). For
children aged #5 y, interviews were obtained through proxies,
generally a parent. Proxies also assisted with dietary interviews
8. of children aged 6–11 y. Dietary intakes were self-reported for
participants aged $12 y. Since 2003–2004, a second, telephone-
administered 24-h recall has been collected (3–10 d after the
first
24-h recall at the MEC), but only one 24-h dietary recall was
included in this analysis to maximize the comparability between
surveys. Furthermore, one 24-h recall is sufficient to estimate
population means because the effects of random errors associ-
ated with dietary recall, including the day-to-day variability, are
generally assumed to cancel out if days of the week are evenly
represented (26).
Caffeine intake for all foods and beverages (including energy
drinks) consumed during the 24-h period was calculated by
using
the USDA Food and Nutrient Database for Dietary Studies (27).
The basis of nutrient values for foods and beverages, such as
energy drinks, is the USDA National Nutrient Database for
Standard Reference. Sources of nutrient data include scientific
literature, data provided by food companies and trade associa-
tions, and USDA analytical contracts. Caffeine intake was es-
timated by summing the caffeine consumed for each food and
beverage during the 24-h recall.
Demographic variables
Sex, age, race-Hispanic origin, and poverty income ratio (PIR)
were used. Age was categorized as 2–5, 6–11, and 12–19 y
TABLE 1
Percentage of US children aged 2–19 y old who consumed
caffeine on
a given day by demographic characteristics: NHANES 2009–
2010
9. 1
Characteristic n (% 6 SE) P
All children 3280 (71.0 6 1.0) —
Age ,0.01
2–5 y 861 (58.3 6 2.4)
6–11 y 1154 (74.9 6 1.7)
12–19 y 1265 (74.5 6 2.2)
Sex NS
M 1712 (70.6 6 1.9)
F 1568 (71.5 6 1.3)
Poverty income ratio2 NS
#130% 1422 (70.0 6 1.8)
131–349% 1023 (74.2 6 1.9)
$350% 555 (69.6 6 2.7)
Race-Hispanic origin3 ,0.001
Non-Hispanic white 1101 (74.9 6 1.8)a
Non-Hispanic black 654 (56.3 6 2.2)b
Mexican American 914 (71.7 6 2.0)a
1 NS at P $ 0.05. A test of linear trend was used for ordinal
variables
(age and poverty income ratio) and Wald’s F test was used for
sex and race-
Hispanic origin; significance was set at P , 0.05. Different
superscript
10. letters represent a significant difference between categories
compared by
using the t test adjusted with the Bonferroni method for
multiple compari-
sons.
2
Index calculated by dividing family income by a federal poverty
threshold specific to family size defined by the US Census
Bureau.
3 “Other” race category not shown.
CAFFEINE INTAKE IN US CHILDREN 1125
D
ow
nloaded from
https://academ
ic.oup.com
/ajcn/article-abstract/100/4/1124/4576506 by guest on 05 M
arch 2020
consistent with NHANES sample-selection methods (28). Self-
reported race-Hispanic origin was categorized as non-Hispanic
white, non-Hispanic black, Mexican American, and other. Par-
ticipants with a race-Hispanic origin categorized as other were
included in overall estimates, but findings from this group are
not reported (because of the small sample size and unstable
variance estimates for a very heterogeneous group). Socioeco-
11. nomic status was defined by using the PIR, which is an index
calculated by dividing family income by a federal poverty
threshold specific to family size defined by the US Census Bu-
reau (29). The PIR was categorized as #130%, 131–349%, and
$350%; for reference, a family income that corresponds to
a 130% PIR qualifies for the Supplemental Nutrition Assistance
Program (formerly the Food Stamp Program) and free school
meals (30).
Analytic population
All children and adolescents aged 2–19 y who participated in
the examination component of the NHANES were eligible for
the dietary interview. In each survey cycle, a small proportion
(4–6%) of participants were excluded because their 24-h recalls
did not meet the standards of reliability that ensure the com-
pleteness of recalls (31). In addition, 5 children who were re-
portedly breastfed during the 24-h recall were excluded from
the
analysis because their caffeine intakes from breast milk could
not be ascertained. The final analytic sample, after exclusions,
comprised 4288, 3824, 4029, 3159, and 3280 participants aged
2–19 y in 2001–2002, 2003–2004, 2005–2006, 2007–2008, and
2009–2010, respectively.
Data analysis
Statistical analyses were conducted with SAS software (version
9.3; SAS Institute Inc) and SUDAAN software (version 11.0;
RTI
International). Caffeine intake on a given day was examined in
absolute amounts (mg) and in relation to body weight (mg/kg)
in
all analyses. Caffeine intake displayed a skewed distribution;
w30% of the analytic population did not report any caffeine in-
take during the 24-h recall period. Thus, logarithmically (base
12. 10)
transformed data on caffeine intake were used to test statistical
hypotheses because they were identified (by using the Box-Cox
procedure in SAS) to be more consistent with a normal distri-
bution (32, 33). To accommodate respondents who reported no
caffeine consumption on the day of recall, caffeine intakes of
zero
were set to 0.0001 to allow the log base 10 transformation. Ex-
treme values were examined to determine whether they exerted
undue influence. Plots of dietary sample weight compared with
caffeine intake showed that extreme values were not associated
with influential weights. Preliminary analyses indicated that the
exclusion of these extreme values did not change the results;
thus,
no exclusions or corrections were made.
Dietary sample weights were used to account for a differential
probability of selection and adjust for nonresponse,
noncoverage,
and sample design. These publically available sample weights
also include a poststratification step to balance recalls across
days
of the week (31).
Weighted, untransformed estimates of the 50th (median), 75th,
90th, and 95th percentiles and percentages (6SEs) were com-
puted for children and adolescents (aged 2–19 y) by demo-
graphic characteristics. Statistical hypotheses regarding the
TABLE 2
Caffeine intake on a given day by demographic characteristics
for US children 2–19 y old: NHANES 2009–2010
1
Characteristics
13. Caffeine
Pn Median2 75th percentile 90th percentile 95th percentile
mg/d
All children 3280 4.6 30.8 94.6 147.6 —
Age ,0.0001
2–5 y 861 1.3 5.9 13.4 23.8
6–11 y 1154 4.5 19.2 49.7 72.3
12–19 y 1265 13.6 70.9 147.9 260.5
Sex NS
M 1712 4.7 30.0 102.1 169.5
F 1568 4.5 31.3 85.1 132.5
Poverty income ratio
3
NS
#130% 1422 4.5 30.2 77.4 131.7
131–349% 1023 5.5 36.4 106.5 141.9
$350% 555 3.6 26.5 88.9 153.0
Race-Hispanic origin
4 ,0.0001
14. Non-Hispanic white 1101 6.4
a
43.2 112.0 177.9
Non-Hispanic black 654 1.3b 9.7 55.2 93.1
Mexican American 914 4.2a 22.7 70.3 112.8
1
Medians and percentiles were calculated from untransformed
weighted data; 5th and 25th percentiles are not
presented and were essentially equal to zero because of a high
proportion of children who did not consume any caffeine.
A test of linear trend was used for ordinal variables age and
poverty income ratio. Wald’s F test was used for sex and race-
Hispanic origin. Significance was set at P , 0.05. Different
superscript letters represent a significant difference between
categories compared by using the t test adjusted with the
Bonferroni method for multiple comparisons.
2 All statistical tests were performed on log-transformed means.
3 Index calculated by dividing family income by a federal
poverty threshold specific to family size defined by the US
Census Bureau.
4
“Other” race category not shown.
1126 AHLUWALIA ET AL
D
ow
15. nloaded from
https://academ
ic.oup.com
/ajcn/article-abstract/100/4/1124/4576506 by guest on 05 M
arch 2020
proportion of children who consumed caffeine in relation to
sociodemographic variables were tested on weighted, untrans-
formed percentages. Hypotheses concerning caffeine intake (mg
and mg/kg) in relation to sociodemographic variables were
tested
by using weighted means of the log-transformed variable. SEs
were estimated by using Taylor’s series linearization. Statistical
hypotheses were tested by using Wald’s F tests with a = 0.05. If
the hypothesis that the mean or percentage of all subgroups
being
equal was rejected, pairwise t tests were performed. An
adjustment
for multiple comparisons was made by using the Bonferroni
method (34). Linear trends in log-transformed caffeine intake
by age and PIR were determined by using orthogonal contrast
matrices (35). We also tested for linear trends in log-
transformed
caffeine intake across the survey periods between 2001 and
2010
by using orthogonal contrast matrices (35); tests were
conducted
for all children and within age groups over time. Analyses were
carried out for all children in the analytic population and re-
peated for children who consumed caffeine (consumers only).
For the purpose of the current analyses, caffeine consumers
16. were
defined as children who reported the consumption of caffeine on
the 24-h dietary recall.
RESULTS
A majority (71%) of 2–19-y-olds consumed caffeine on
a given day (Table 1). A linear trend was noted in the
proportion
of 2–19-y-olds who consumed caffeine with age but not PIR. No
differences were seen between males and females in terms of
the
proportion of children who consumed caffeine. However, dif-
ferences were noted in caffeine consumption by race-Hispanic
origin as follows: non-Hispanic black children (56%) were less
likely to consume caffeine than were non-Hispanic white (75%)
or Mexican American (72%) children (Table 1); however, no
differences between non-Hispanic white or Mexican American
children were noted.
The distribution of caffeine intake (mg) on a given day by
selected demographic characteristics (Table 2) showed that
the median caffeine intake by US children 2–19 y of age was
4.6 mg. An increasing linear trend in caffeine intake was noted
by age. No significant associations were shown between the
PIR and caffeine intake. Non-Hispanic black children consumed
significantly less caffeine than did non-Hispanic white or
Mexican
American children (Table 2). No differences in caffeine intake
between non-Hispanic white and Mexican American children
were noted.
When these analyses were restricted to children who con-
sumed caffeine (ie, consumers only) (Table 3), the median
caffeine intake on a given day was 12.4 mg. The significant
17. linear trend for caffeine intake and age remained, with the
oldest
age group (12–19-y-olds) having the highest caffeine intake
(40.6 mg). Non-Hispanic black children consumed significantly
less caffeine (8.0 mg) than did non-Hispanic white children
(14.4 mg) (Table 3). No other racial-ethnic group differences
were noted.
When caffeine intake (mg) was expressed in relation to body
weight (kg), the median caffeine consumption for US children
2–19 y of age was 0.15 mg/kg (Table 4). Associations of
caffeine
intake (mg/kg) with age and race-Hispanic origin were similar
TABLE 3
Caffeine intake in consumers of caffeine on a given day by
demographic characteristics for US children 2–19 y old:
NHANES 2009–2010
1
Characteristics
Caffeine
Pn Median2 75th percentile 90th percentile 95th percentile
mg
All children 2230 12.4 52.2 116.6 184.0 —
Age ,0.0001
2–5 y 485 4.7 10.3 20.9 36.1
6–11 y 826 9.1 31.4 58.5 85.3
18. 12–19 y 919 40.6 96.6 186.3 284.4
Sex NS
M 1154 12.1 56.2 124.0 223.6
F 1076 12.6 49.0 105.3 148.0
Poverty income ratio3 NS
#130% 952 14.3 51.6 98.9 155.3
131–349% 717 11.6 55.4 119.4 184.2
$350% 382 9.5 48.7 113.3 204.4
Race-Hispanic origin
4 ,0.01
Non-Hispanic white 819 14.4
a
60.1 137.3 220.2
Non-Hispanic black 367 8.0b 41.3 89.4 109.6
Mexican American 633 11.6a,b 42.5 91.5 131.5
1
Medians and percentiles were calculated from untransformed
weighted data. A test of linear trend was used for
ordinal variables age and poverty income ratio. Wald’s F test
was used for sex and race-Hispanic origin. Significance was
19. set at P , 0.05. Different superscript letters represent a
significant difference between categories compared by using the
t
test adjusted with the Bonferroni method for multiple
comparisons.
2
All statistical tests were performed on log transformed means.
3 Index calculated by dividing family income by a federal
poverty threshold specific to family size defined by the US
Census Bureau.
4
“Other” race category not shown.
CAFFEINE INTAKE IN US CHILDREN 1127
D
ow
nloaded from
https://academ
ic.oup.com
/ajcn/article-abstract/100/4/1124/4576506 by guest on 05 M
arch 2020
as noted for caffeine intake in absolute amounts (mg). Non-
Hispanic black children had significantly lower caffeine intake
(0.04 mg/kg) than did other race-ethnicities examined (Table 4).
When analyses of caffeine intake (mg/kg) were restricted to
20. children who consumed caffeine, (ie, consumers only) (Table
5), the
median caffeine intake was 0.40 mg/kg on a given day. A linear
trend in caffeine intake (mg/kg) with age was again observed.
As
for the results concerning the absolute amount (mg) of caffeine
ingested in consumers only, the finding that non-Hispanic black
children consumed significantly lower caffeine (0.24 mg/kg)
than
did non-Hispanic white children (0.47 mg/kg) remained
unaltered
(Table 5). No other race-ethnic differences were noted.
Caffeine intake did not differ by sex or poverty level whether
expressed as total intake (mg) or in relation to body weight
(mg/kg) for all children 2–19 y of age or in caffeine consumers
2–19 y of age (Tables 2–5).
We estimated 90th and 95th percentiles of caffeine intake by
various sociodemographic factors to provide national estimates
that may be useful for policy makers in future evaluations of the
upper end of the distribution. As expected, the 90th percentile
of
caffeine intake (mg) was lower in all children than caffeine
consumers (Tables 2 and 3, respectively). Health Canada has
put
forth maximal caffeine intake (mg) guidelines for children that
vary by age; specifically, 45, 62.5, and 85 mg caffeine/d have
been suggested as maximum caffeine intakes for 4–6-, 7–9-, and
10–12-y-olds, respectively (11). Our analyses show that most
(90–95%) children ,12 y old had caffeine intakes below these
guidelines (Tables 2 and 3). For older children, caffeine con-
sumption guidance has been based on milligrams per kilogram
of body weight; Health Canada has suggested that daily caffeine
intake for children .12 y of age should be ,2.5 mg/kg (6, 11).
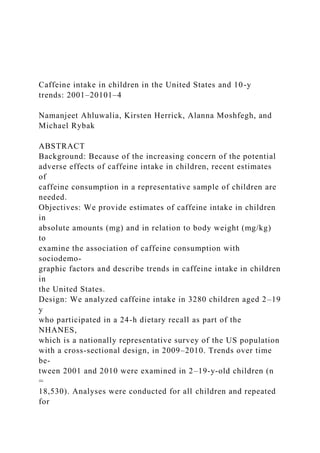
21. Our findings indicated that 90% of children 12–19 y of age and
$75% and ,90% of 12–19-y-old caffeine consumers on a given
day met these guidelines and had caffeine intakes ,2.5 mg $
kg21 $ d21 (Tables 4 and 5, respectively).
We also examined trends in caffeine intake from 2001 to 2010.
The caffeine intake in 2–19-y-old children decreased overall in
the 10-y study period for all children (Figure 1A; n = 18,530
and P , 0.05) and caffeine consumers only (Figure 1B; n =
12,776 and P , 0.001). No major trends were noted for specific
age groups in all children (caffeine consumers and non-
consumers) (Figure 1A). However, when trends analyses were
restricted to caffeine consumers only, 2–5- and 6–11-y-olds
showed a significant decrease in caffeine intakes from 2001–
2002 to 2009–2010 (Figure 1B; P-trend , 0.001 for both age
groups); the magnitude of these changes, however, was small,
by
3.0 and 4.6 mg in children 2–5 and 6–11 y of age, respectively.
Identical findings were noted with caffeine intake expressed as
milligrams per kilogram of body weight (data not shown) for all
children (consumers and nonconsumers of caffeine) as well as
for children who consumed caffeine.
DISCUSSION
Caffeine intake in children has received much attention be-
cause of potential adverse health effects (1, 2, 10, 36). Most
TABLE 4
Caffeine intake in relation to body weight on a given day by
demographic characteristics for US children 2–19 y old:
NHANES 2009–20101
Caffeine
22. Characteristic n Median2 75th percentile 90th percentile 95th
percentile P
mg/kg
All children 3280 0.15 0.75 1.78 2.70 —
Age ,0.01
2–5 y 861 0.11 0.36 0.86 1.43
6–11 y 1154 0.15 0.62 1.68 2.49
12–19 y 1265 0.22 1.13 2.45 3.27
Sex NS
M 1712 0.15 0.72 1.83 2.98
F 1568 0.15 0.80 1.69 2.58
Poverty income ratio3 NS
#130% 1422 0.15 0.77 1.71 2.76
131–349% 1023 0.17 0.86 1.87 2.70
$350% 555 0.13 0.63 1.47 2.44
Race-Hispanic origin4 ,0.001
Non-Hispanic white 1101 0.19
a
0.90 2.09 3.02
Non-Hispanic black 654 0.04
23. b
0.28 1.07 1.55
Mexican American 914 0.14a 0.65 1.47 2.21
1 Medians and percentiles were calculated from untransformed
weighted data. Fifth and 25th percentiles are not
presented and were essentially equal to zero because of a high
proportion of children who did not consume any caffeine.
A test of linear trend was used for ordinal variables age and
poverty income ratio. Wald’s F test was used for sex and race-
Hispanic origin. Significance was set at P , 0.05. Different
superscript letters represent a significant difference between
categories compared by using the t test adjusted with the
Bonferroni method for multiple comparisons.
2
All statistical tests were performed on log transformed means.
3 Index calculated by dividing family income by a federal
poverty threshold specific to family size defined by the US
Census Bureau.
4
“Other” race category not shown.
1128 AHLUWALIA ET AL
D
ow
nloaded from
24. https://academ
ic.oup.com
/ajcn/article-abstract/100/4/1124/4576506 by guest on 05 M
arch 2020
healthy persons tolerate caffeine well; however, there is a large
variation in individuals in their responses to caffeine (37, 38).
Estimates of caffeine consumption in a nationally representative
sample of young children that were based on recent data may be
informative for updating recommendations. To our knowledge,
this is the first report of caffeine intake in US children aged 2–
19 y,
which was examined both in absolute amount (mg) and milli-
grams per kilogram of body weight, and its associations with
sociodemographic factors from the most-recent available na-
tional data from NHANES 2009–2010. In addition, trends in
caffeine consumption (both in mg and mg/kg) over a decade
(2001–2010) are reported for the first time to our knowledge.
In the current study, 71% of US children aged 2–19 y con-
sumed caffeine on a given day. Our finding that 58% of 2–5-y-
olds and 75% of 6–11-y-olds consumed caffeine on a given day
was lower than estimates reported by Frary et al (16) on the
basis of older national data from the CSFII in these age groups.
In that study, 76% of 2–5-y-olds and 86% of 6–11-y-olds con-
sumed caffeine. For older children, Frary et al (16) reported that
91 and 88% of 12–17-y-old boys and girls, respectively, con-
sumed caffeine on a given day. Because of differences in ages
reported, no direct comparison could be made for older
children.
We showed that over one-half of US children aged 2–5 y and 3
25. in 4 children aged $6 y consumed caffeine on a given day. This
finding is important because food habits are formed early and
continue into later years and in light of the American Academy
of Pediatrics recommendation that “caffeine and other stimulant
substances contained in energy drinks have no place in the diet
of children” (12).
We noted a positive linear trend between age and caffeine
consumption (expressed as mg or mg/kg) as has been reported in
other studies (16, 18, 19, 39). This association may be driven by
biological changes such as disrupted sleep rhythm in puberty
(40)
as well as psychosocial factors including a greater autonomy in
beverage purchase and consumption, peer pressure, and desire
for
enhanced academic or physical performance (1, 15, 41, 42).
Limited comparative estimates of caffeine intake are available
from large representative studies (16, 18, 19, 43). Besides dif-
ferences in study designs, methodologies, time periods, and the
use of different age and sex groups, an additional complexity
arises because most studies have reported mean intakes (despite
a skewed distribution for caffeine). For comparison purposes,
we computed mean caffeine intakes (6SEs) for 2–5-, 6–11-,
and 12–19-y-olds. These intakes were 5.8 6 0.45, 17.2 6 1.1,
and 58.3 6 6.4 mg, respectively, in all children and 10.0 6 1.0,
23.0 6 1.4, and 78.3 6 7.4 mg, respectively, in caffeine con-
sumers. These estimates are similar to those reported for the
NHANES 2005–06 (19) but lower than those reported for
caffeine
consumers in the SIP survey (1-5-y olds: 13.5 mg/d) (18) and
the
CSFII in middle to late 1990s (2–5-y-olds: 16 mg) (16).
Caffeine is generally regarded as a safe substance; however,
the US Food and Drug Administration has suggested the use of
the .90th percentile to indicate a “heavy consumption” of
26. caffeine (18, 19). Our results showed that, in adolescents ages
12–19 y, caffeine intake at the 90th percentile was 2.45 mg/kg.
This intake is identical to the maximal consumption limit sug-
gested for children by Health Canada (6, 11) that was based on
reported behavioral effects (44). On the basis of the NHANES
TABLE 5
Caffeine intake in relation to body weight on a given day in
caffeine consumers by demographic characteristics for US
children 2–19 y old: NHANES 2009–20101
Characteristic n
Caffeine
PMedian2 75th percentile 90th percentile 95th percentile
mg/kg
All children 2230 0.40 1.13 2.27 3.18 —
Age ,0.01
2–5 y 485 0.29 0.62 1.34 1.34
6–11 y 826 0.30 0.90 1.80 2.77
12–19 y 919 0.64 1.47 2.66 3.65
Sex NS
M 1154 0.39 1.18 2.49 3.26
F 1076 0.40 1.09 2.11 2.77
27. Poverty income ratio3 NS
#130% 952 0.44 1.10 2.19 3.47
131–349% 717 0.43 1.24 2.46 3.04
$350% 382 0.31 0.86 1.79 3.10
Race-Hispanic origin4 ,0.01
Non-Hispanic white 819 0.47
a
1.32 2.58 3.28
Non-Hispanic black 367 0.24
b
0.74 1.46 1.86
Mexican American 633 0.35a,b 0.93 1.81 2.56
1 Medians and percentiles were calculated from untransformed
weighted data. A test of linear trend was used for
ordinal variables age and poverty income ratio. Wald’s F test
was used for sex and race-Hispanic origin. Significance was
set at P , 0.05. Different superscript letters represent a
significant difference between categories compared by using the
t
test adjusted with the Bonferroni method for multiple
comparisons.
2
All statistical tests were performed on log transformed means.
28. 3
Index calculated by dividing family income by a federal poverty
threshold specific to family size defined by the US
Census Bureau.
4 “Other” race category not shown.
CAFFEINE INTAKE IN US CHILDREN 1129
D
ow
nloaded from
https://academ
ic.oup.com
/ajcn/article-abstract/100/4/1124/4576506 by guest on 05 M
arch 2020
2009–2010, we showed that 10% of children 12–19 y of age
consumed .2.5 mg caffeine/kg on a given day and ,25% of
12–19-y-old caffeine consumers had intakes greater than this
guideline.
Children may metabolize caffeine differently than adults do
(18) and show a large variation in body weight across
childhood,
and recommendations to limit caffeine intake have been based
on
body weight for children by Health Canada (6, 11). Few reports
have examined caffeine intake in children expressed as milli-
grams per kilogram, and they presented findings in caffeine
consumers only (16, 18, 21, 43). Thus, there has been no
29. comparative literature on caffeine consumption in all children
(caffeine consumers and nonconsumers) as has been provided in
this study.
Our estimates of caffeine intake (mg/kg) in caffeine consumers
were generally lower than those previously reported (16, 18,
21).
Frary et al (16), on the basis of older CSFII data, reported 0.4,
0.4,
0.5, and 0.6 mg/kg for 2–5-, 6–11-, and12–17-y-old boys and
12–
17-y-old girls, respectively, compared with our estimates of 0.3
mg/kg for 2–5- and 6–11-y-olds. Barone and Roberts (21) re-
viewed studies up to the early 1990s and showed that caffeine
intake (mg/kg) declined between 1975 and 1989. Our finding of
a significant linear decreasing trend from 2001 to 2010 sug-
gested that this trend has likely continued since that report (21)
and could explain our lower estimates.
We also examined sociodemographic patterns in caffeine
consumption related to race-Hispanic origin and income. Our
finding that non-Hispanic black children consumed significantly
less caffeine than that of non-Hispanic white children was
consistent with findings from the Bogalusa study (39) and
CSFII
(17). However, to our knowledge, this is the first report to show
higher caffeine intake by Mexican American compared with
non-
Hispanic black 2–19-y-olds. In the current study, we did not
find
any difference in caffeine intake in relation to socioeconomic
status that was contrary to findings from a small study that in-
volved 24–32-mo-old children (45). Other authors have reported
lower caffeine intakes by female than male children (46); this
difference was more pronounced particularly at older ages (16,
30. 19). However, we did not find a significant association with
sex,
which was consistent with findings from the SIP survey (18).
FIGURE 1. Trends over time in caffeine intake on a given day
(mg) in US children aged 2–19 y: 2001–2010. Trends are shown
for all children aged 2–19 y
(A) (n = 18,530) and caffeine consumers aged 2–19 y (B) (n =
12,776). P-linear trend , 0.05 by using the t statistic for all
children 2–19 y of age (A); NS for
specific age groups (A). P-linear trend , 0.001 by using the t
statistic for caffeine consumers 2–19 y of age, and P-linear
trend , 0.001 for both 2–5- and 6–
11-y-old groups (B). Error bars represent 6 1 SE; bars capped
by diamonds, circles, dashes, and triangles represent variations
for all (solid line), 2–5-y-old
(dashed and dotted line), 6–11-y-old (dotted line), and 12–19-y-
old (dashed line) children, respectively.
1130 AHLUWALIA ET AL
D
ow
nloaded from
https://academ
ic.oup.com
/ajcn/article-abstract/100/4/1124/4576506 by guest on 05 M
arch 2020
Overall, findings for the association of caffeine intake with
sociodemographic factors were consistent whether caffeine in-
31. take was expressed as an absolute amount or in milligrams per
kilogram. Moreover, results were similar when analyses were
conducted with all children or consumers only. The only ex-
ception was that differences in caffeine intake by race-Hispanic
origin were less prominent in consumers only. Specifically,
caffeine intake of non-Hispanic black and Mexican American
children was no longer different in consumers.
Last, our results from the trend analysis showed a significant,
albeit small, decline over the 10-y study period (2001–2010) in
caffeine intake in all children and caffeine consumers only re-
gardless of how caffeine intake was expressed (ie, mg or
mg/kg).
The decrease in caffeine intake (mg) observed over this period
was significant only in younger caffeine consumers (ages ,12
y), which suggested that caffeine intake by adolescents (aged
12–19 y) who consumed the highest amounts of caffeine in all
age groups examined remained stable over the 10-y study pe-
riod. In view of an increasing choice of products that contain
caffeine such as energy drinks targeted to youth, another pos-
32. sibility is that children may be replacing some of their caffeine
intakes from sodas by other caffeinated products such as energy
drinks. This hypothesis fits well with the findings from the
NHANES that showed a decrease in soda along with a signifi-
cant increase in energy or sport-drink consumption in 2–19-y-
olds (20).
The NHANES design allows the estimation of caffeine con-
sumption on a representative sample and examination of the
association of caffeine consumption with sociodemographic
factors including race-Hispanic origin. The continuous nature of
the NHANES since 1999 offers the possibility of evaluating
trends over time from different survey cycles that used the same
data-collection methodology and are linked to nutrient data
banks
that are updated periodically to capture new products introduced
during the survey years. The current analyses were based on
a single 24-h recall that was sufficient to estimate population-
level estimates because random errors associated with a dietary
recall, including the day-to-day variability, can be generally
33. assumed to cancel out if days of the week are evenly
represented
(26). The database used in this study did not include caffeine
intake from herbals, supplements including energy shots, or
medications.
In conclusion, this study provides updated national estimates
of caffeine intakes in children that may be useful in the context
of
the mounting evidence of adverse health effects associated with
high caffeine intake while balancing benefits of caffeine. Future
research should identify the contribution of specific foods and
beverages to caffeine intake as well as the chief sources of
caffeine in children and adolescents.
We are grateful to Margaret Carroll for her expert guidance
with the sta-
tistical analysis.
The authors’ responsibilities were as follows—NA: was
responsible for
the concept development, supervision of the statistical analysis,
and writing
of the manuscript; KH: conducted the statistical analysis and
assisted with
34. preparing the tables and figure; NA and KH: were responsible
for the final
content of the manuscript; and all authors: provided input on the
writing of
the manuscript and reviewed and provided critical feedback on
the manu-
script. None of the authors had a conflict of interest.
REFERENCES
1. Temple JL. Caffeine use in children: what we know, what we
have left
to learn, and why we should worry. Neurosci Biobehav Rev
2009;33:
793–806.
2. Temple JL, Dewey AM, Briatico LN. Effects of acute
caffeine admin-
istration on adolescents. Exp Clin Psychopharmacol
2010;18:510–20.
3. De Bellis MD, Keshavan MS, Beers SR, Hall J, Frustaci K,
Masalehdan A,
Noll J, Boring AM. Sex differences in brain maturation during
childhood
and adolescence. Cereb Cortex 2001;11:552–7.
4. White AM. Understanding adolescent brain development and
its im-
plications for the clinician. Adolesc Med State Art Rev
2009;20:73–90,
viii–ix.
35. 5. Arria AM, Caldeira KM, Kasperski SJ, Vincent KB, Griffiths
RR,
O’Grady KE. Energy drink consumption and increased risk for
alcohol
dependence. Alcohol Clin Exp Res 2011;35:365–75.
6. Nawrot P, Jordan S, Eastwood J, Rotstein J, Hugenholtz A,
Feeley M.
Effects of caffeine on human health. Food Addit Contam
2003;20:1–30.
7. Savoca MR, MacKey ML, Evans CD, Wilson M, Ludwig DA,
Harshfield GA. Association of ambulatory blood pressure and
dietary
caffeine in adolescents. Am J Hypertens 2005;18:116–20.
8. Lim S, Zoellner JM, Lee JM, Burt BA, Sandretto AM, Sohn
W, Ismail
AI, Lepkowski JM. Obesity and sugar-sweetened beverages in
African-
American preschool children: a longitudinal study. Obesity
(Silver
Spring) 2009;17:1262–8.
9. Hughes JR, Hale KL. Behavioral effects of caffeine and other
meth-
ylxanthines on children. Exp Clin Psychopharmacol 1998;6:87–
95.
10. Seifert SM, Schaechter JL, Hershorin ER, Lipshultz SE.
Health effects
of energy drinks on children, adolescents, and young adults.
Pediatrics
2011;127:511–28.
36. 11. Health Canada. Caffeine in food. Available from:
http://www.hc-sc.gc.
ca/fn-an/securit/addit/caf/food-caf-aliments-eng.php (cited 26
August
2013).
12. Committee on Nutrition and the Council on Sports Medicine
and Fit-
ness. Sports drinks and energy drinks for children and
adolescents: are
they appropriate? Pediatrics 2011;127:1182–9.
13. European Food Standard Agency Panel on Dietetic Products
Nutrition
and Allergies. Scientific Opinion on the substantiation of health
claims
related to caffeine and increase in physical performance during
short-
term high-intensity exercise, increase in endurance
performance, increase
in endurance capacity, and reduction in the rated perceived
exertion/effort
during exercise. Available from:
http://www.efsa.europa.eu/en/efsajournal/
doc/2053.pdf (cited 26 August 2013).
14. Leviton A. Behavioral correlates of caffeine consumption by
children.
Clin Pediatr (Phila) 1992;31:742–50.
15. Bunting H, Baggett A, Grigor J. Adolescent and young adult
percep-
tions of caffeinated energy drinks. A qualitative approach.
Appetite
2013;65:132–8.
37. 16. Frary CD, Johnson RK, Wang MQ. Food sources and intakes
of caf-
feine in the diets of persons in the United States. J Am Diet
Assoc
2005;105:110–3.
17. Ahuja J, Perloff BP. Caffeine and theobromine intakes of
children:
results from CSFII 1994-96, 1998. Fam Econ Nutr Rev
2001;13:47–51.
18. Knight CA, Knight I, Mitchell DC, Zepp JE. Beverage
caffeine intake
in US consumers and subpopulations of interest: estimates from
the
Share of Intake Panel survey. Food Chem Toxicol
2004;42:1923–30.
19. Somogyi LP. Caffeine intake by the US Population. US
Food and Drug
Administration. Available from:
www.fda.gov/downloads/AboutFDA/
CentersOffices/OfficeofFoods/CFSAN/CFSANFOIAElectronicR
eadingRoom/
UCM333191.pdf (cited 26 August 2013).
20. Kit BK, Fakhouri TH, Park S, Nielsen SJ, Ogden CL. Trends
in sugar-
sweetened beverage consumption among youth and adults in the
United States: 1999-2010. Am J Clin Nutr 2013;98:180–8.
21. Barone JJ, Roberts HR. Caffeine consumption. Food Chem
Toxicol
1996;34:119–29.
22. Zipf G, Chiappa M, Porter KS, Ostchega Y, Lewis B, Dostal
38. J. The
National Health and Nutrition Examination Survey: plan and
opera-
tions, 1999-2010. National Center for Health Statistics, Vital
Health
Stat Series 1 2013;56:1–37.
23. CDC, National Center for Health Statistics. NHANES
response rates
and population totals. Available from: http://www.cdc.gov/nchs/
nhanes/response_rates_CPS.htm (cited 15 July 2013).
24. Blanton CA, Moshfegh AJ, Baer DJ, Kretsch MJ. The USDA
Auto-
mated Multiple-Pass Method accurately estimates group total
energy
and nutrient intake. J Nutr 2006;136:2594–9.
CAFFEINE INTAKE IN US CHILDREN 1131
D
ow
nloaded from
https://academ
ic.oup.com
/ajcn/article-abstract/100/4/1124/4576506 by guest on 05 M
arch 2020
25. Thompson FE, Subar AF. Dietary assessment methodology.
Edtion ed.
In: Coulston AM, Boushey CJ, Ferruzzi MG, ed. Nutrition in the
39. prevention and treatment of disease. 3rd ed. Boston, MA:
Academic
Press, 2013.
26. Gibson R. Principles of nutritional assessment. 2nd ed.
Oxford, United
Kingdom: Oxford University Press, 2005.
27. US Department of Agriculture. Agricultural Research
Service: Food
Surveys Research Group. Available from:
http://www.ars.usda.gov/
Services/docs.htm?docid=12085 (cited16 July 2013).
28. Curtin LR, Mohadjer LK, Dohrmann SM, Montaquila JM,
Kruszan-
Moran D, Mirel LB, Carroll MD, Hirsch R, Schober S, Johnson
CL.
The National Health and Nutrition Examination Survey: sample
de-
sign, 1999-2006. Vital Health Stat 2 2012;155:1–39.
29. United States Census Bureau. Poverty. Available from:
http://www.
census.gov/hhes/www/poverty/methods/definitions.html
(accessed 26
August 2013).
30. US Department of Agriculture. Supplemental Nutrition
Assistance
Program (SNAP)- Eligibility. Food and Nutrition Service.
Available
from: http://www.fns.usda.gov/snap/eligibility (cited 18 July
2014).
31. CDC. National Center for Health. Available from:
40. http://www.cdc.
gov/nchs/nhanes/nhanes2009-2010/DR1TOT_F.htm (accessed
15 July
2013).
32. Korn E, Graubard B. Analysis of health surveys. New York,
NY: John
Wiley & Sons Inc, 1999.
33. Wolter K. Introduction to variance estimation. New York,
NY:
Springer-Verlag, 1985.
34. Miller R. Developments in multiple comparisons. J Am Stat
Assn
1977;72:779–88.
35. Winer B. Statistical principles in experimental design. New
York, NY:
McGraw-Hill Companies, 1971.
36. Seifert SM, Seifert SA, Schaechter JL, Bronstein AC,
Benson BE,
Hershorin ER, Arheart KL, Franco VI, Lipshultz SE. An
analysis of
energy-drink toxicity in the National Poison Data System. Clin
Toxicol
(Phila) 2013;51:566–74.
37. Castellanos FX, Rapoport JL. Effects of caffeine on
development and
behavior in infancy and childhood: a review of the published
literature.
Food Chem Toxicol 2002;40:1235–42.
41. 38. Rétey JV, Adam M, Khatami R, Luhmann UF, Jung HH,
Berger W,
Landolt HP. A genetic variation in the adenosine A2A receptor
gene
(ADORA2A) contributes to individual sensitivity to caffeine
effects on
sleep. Clin Pharmacol Ther 2007;81:692–8.
39. Arbeit ML, Nicklas TA, Frank GC, Webber LS, Miner MH,
Berenson
GS. Caffeine intakes of children from a biracial population: the
Bo-
galusa Heart Study. J Am Diet Assoc 1988;88:466–71.
40. Carskadon MA. Sleep in adolescents: the perfect storm.
Pediatr Clin
North Am 2011;58:637–47.
41. Hattersley L, Irwin M, King L, Allman-Farinelli M.
Determinants and
patterns of soft drink consumption in young adults: a qualitative
analysis. Public Health Nutr 2009;12:1816–22.
42. Rath M. Energy drinks: what is all the hype? The dangers of
energy
drink consumption. J Am Acad Nurse Pract 2012;24:70–6.
43. Knight CA, Knight I, Mitchell DC. Beverage caffeine
intakes in young
children in Canada and the US. Can J Diet Pract Res
2006;67:96–9.
44. Bernstein GA, Carroll ME, Crosby RD, Perwien AR, Go FS,
Benowitz
NL. Caffeine effects on learning, performance, and anxiety in
normal
42. school-age children. J Am Acad Child Adolesc Psychiatry
1994;33:
407–15.
45. Skinner JD, Carruth BR, Houck KS, Morris M, Moran J 3rd,
Coletta F.
Caffeine intake in young children differs by family
socioeconomic
status. J Am Diet Assoc 2000;100:229–31.
46. Ellison RC, Singer MR, Moore LL, Nguyen US, Garrahie
EJ, Marmor
JK. Current caffeine intake of young children: amount and
sources.
J Am Diet Assoc 1995;95:802–4.
1132 AHLUWALIA ET AL
D
ow
nloaded from
https://academ
ic.oup.com
/ajcn/article-abstract/100/4/1124/4576506 by guest on 05 M
arch 2020
You will be responsible for answering this question with the
required number of examples and historical periods.
Please respond to the following question in 400-500 words.
Your short essays should be well-organized, thoughtful analyses
that engage the course material. Your responses must discuss
43. specific works of art/architecture and provide ample visual
evidence from the textbook to support your argument. Use the
lecture notes and textbook for support, but you do not need to
consult outside sources. Your response will run through
TurnItIn software, so be sure to cite the textbook, when
necessary.
Question:
Over the course of the five hundred years we have studied this
semester, the representation of subjectivity in portraiture has
changed drastically.
Please choose four examples and discuss the changing approach
to subjectivity by considering not only aspects such as realism
and style but also qualities such as the implied
movement/activity of the sitter, the gaze, attributes, etc. At
least one of your examples (but no more than two) must be from
before the first half of the semester (prior to the midterm). You
may analyze how the different concepts of subjectivity relate to
the culture/society in question. Your four examples must come
from four different stylistic periods. Each of the four examples
must be identified by artist, title, date, medium, and
cultural/historical period.
4 Examples:
Jan van Eyck, Giovanni Arnolfini and His Wife, 1434. Oil on
wood, 29 90 × 19 10 120. National Gallery, London.
John Henry Fuseli, The Nightmare, 1781. Oil on canvas, 39
3340 × 49 1120. Detroit Institute of the Arts (Founders Society
purchase with funds from Mr. and Mrs. Bert L. Smokler and Mr.
and Mrs. Lawrence A. Fleishman).
Henri Matisse, Woman with the Hat, 1905. Oil on canvas, 29 7
30 × 19 1110. San Francisco Museum of Modern Art, San
Francisco
44. Kehinde Wiley, Napoleon Leading the Army over the Alps,
2005. Oil on canvas, 99 × 99. Brooklyn Museum, Brooklyn
(Collection of Suzi and Andrew B. Cohen).
SAMPLE ESSAY
Question: Compare Michelangelo and Titian’s approach to color
and nature.
“Michelangelo and Titian are both outstanding artists who have
made huge impacts on the subject of art, though their
approaches to their work can be hugely different. Influenced
hugely by High Renaissance artists Leonardo Da Vinci and
Raphael, Titian encourages imaginations and participations
from viewer. Michelangelo, on the other hand, references more
to human anatomy and the central belief of Humanism: beauty
of body. The way they expresses such difference is mainly
through colors and contour: Michelangelo cast more emphasis
on the harsh contour as well as the contrast between colors;
while Titian neglects contour and focuses more on natural color.
Firstly, the color styles of the two are significantly different.
Take Last Judgement (1541) as an example. In this masterpiece,
the artist depicts a scene where one line of people is elevating
to the heaven while the other line falling into the hell. In an
attempt to express the seriousness of the religions and holiness,
as well as the perfection of human bodies, Michelangelo mixes
his colors with black and white, as a mean to raise the contrast
level between each objects that make up the space, so that the
skins can look perfectly pale and the holiness can be
highlighted. Clearly contradicting the color style of
Michelangelo, Titian tend to use more soft, natural colors, of
which the brightness and intensity are often not very high.
His Meeting of Bacchus and Ariadne (1523) marks his signature
natural way of using colors. In this work, he used variety of
earth toned red and yellow to detail the figures, clothings, and
animals. Even the color selections for negative space, sky and
45. ground, does not like abrupt at all, due to his avoidance of high
contrast between elements.
Secondly, the two artists have a different view on the use of
contour lines as well. Michelangelo advocates harsh contours as
he believes it singularizes the beauty of human and makes
movements vivid. In Michelangelo’s Creation of Adam (1512),
he made huge emphasis on the contour of every object within
the painting. From god, Adam, to the smaller details like the
fabrics behind them. If you look closely, the contour around the
body of Adam is so harsh that it looks as if Adam is floating.
On the other hand, preferring imagination over reality and
stressing the nature over perfection, Titian avoids all forms of
clear lines and harsh contours. In Titian’s pastoral symphony
(1510), there is barely contour lines since he gives positive
space a very natural colors that mesh well with the negative
space. As a result, the contour is barely seen and the painting as
a whole, looks more like natural world where no contour lines
exist.
To sum up, both Michelangelo and Titian are outstanding
masters with respect to their eras. And their ways of using color
and contour, though vastly different from each other, reflect
their own background, style, and school. Most importantly, both
styles are intriguing to the futurity.”
1006! CHAPTER 32 Contemporary Art Worldwide
Kehinde Wiley. !e paintings and photographs
of Basquiat, Marshall, and Simpson, which all fea-
ture African Americans as subjects, stand in vivid
contrast to the near-total absence of blacks in
Western painting and sculpture until the past half
century. One major contemporary artist who has
set out to correct that discriminatory imbalance
46. is Los Angeles native K"#$%&" W$'"( (b. 1977).
Wiley earned his BFA at the San Francisco Art
Institute and his MFA at Yale University and is
currently based in New York City, where he was
artist-in-residence at the Studio Museum in Har-
lem in 2001–2002. Wiley has achieved renown for
his large-scale portraits of young urban African
American men. His trademark paintings, however,
are reworkings of historically important portraits
in which he substitutes )gures of young black men
in contemporary dress in order to situate them in
what he calls “the )eld of power.”
A characteristic example is Napoleon Lead-
ing the Army over the Alps (*$+. 32-4) based on
Jacques-Louis David’s painting (*$+. 27-2A) of
the same subject. To evoke the era of the original,
Wiley presented his portrait of an African Ameri-
can Napoleon on horseback in a gilt wood frame.
Although in many details an accurate reproduc-
tion of David’s canvas, Wiley’s version is by no
means a mechanical copy. His heroic narrative
unfolds against a vibrantly colored ornate wallpa-
per-like background instead of a dramatic sky—a
distinctly modernist reminder to the viewer that
this is a painting and not
a window onto an Alpine
landscape.
Faith Ringgold. Like Bas-
quiat and Wiley, M"',$%
E&-./&0 (b. 1937) has
examined the lives—or,
more precisely, the death by
lynching (*$+. 32-4A)—of
51. ia
l o
r
m
at
ch
th
e
pu
bl
is
he
d
pr
od
uc
t.
Copyright 2020 Cengage Learning. All Rights Reserved. May
not be copied, scanned, or duplicated, in whole or in part.
WCN 02-200-203
of the status quo gave rise to the notion of an artistic avant-
garde.
52. !e term, which means “front guard,” derives from 19th-century
French military usage. !e avant-garde were the troops sent
ahead
of the army’s main body to scout the enemy’s position and
strength.
Politicians who deemed themselves visionary and forward
thinking
subsequently adopted the term. It then migrated to the art world
in the 1880s, when artists and critics used it to refer to the
Realists,
Impressionists, and Post-Impressionists—artists who were ahead
of
their time and who transgressed the limits of established art
forms.
Today, art historians generally use the term to describe more
nar-
rowly the modernist art movements of the opening decades of
the
20th century.
FAUVISM
In 1905, at the third Salon d’Automne (Autumn Salon) in Paris,
a
group of young painters exhibited canvases so simpli"ed in
design
and so shockingly bright in color that a startled critic, Louis
Vaux-
celles (1870–1943), described the artists as Fauves (“wild
beasts”).
!e Fauves were totally independent of the French Academy and
the “o#cial” Salon (see “Academic Salons and Independent Art
Exhibitions,” page 853). !eir aim was to develop an art having
the
directness of Impressionism but employing intense color
juxtaposi-
tions for expressive ends. Building on the legacy of artists such
53. as
Vincent van Gogh and Paul Gauguin, the Fauves went even
further
in liberating color from its descriptive function and exploring
the
e$ects that di$erent colors have on emotions. !e Fauves
produced
portraits, landscapes, still lifes, and nudes of spontaneity and
verve,
with rich surface textures, lively linear patterns, and, above all,
bold
colors. In an e$ort to release internal feelings, they employed
star-
tling contrasts of vermilion and emerald green and of cerulean
blue
and vivid orange held together by sweeping brushstrokes and
bold
patterns.
!e Fauve painters never o#cially organized, and within "ve
years, most of the artists had departed from a strict adherence to
Fauve principles and developed their own more personal styles.
During its brief existence, however, Fauvism made a signi"cant
contribution to the direction of art by demonstrating color’s
struc-
tural, expressive, and aesthetic capabilities.
Henri Matisse
!e dominant Fauve artist was Henri Matisse (1869–1954), who
believed that color could play a primary role in conveying
meaning,
and consequently focused his e$orts on developing this notion.
In
an early painting, Woman with the Hat (fig. 29-2), Matisse
depicted
his wife, Amélie, in a rather conventional manner
54. compositionally,
but the seemingly arbitrary colors immediately startle the
viewer,
as does the sketchiness of the forms. !e entire image—the wom-
an’s face, clothes, hat, and background—consists of patches and
splotches of color juxtaposed
in ways that sometimes pro-
duce jarring contrasts. Matisse
explained his approach in this
painting and his contemporary
Le Bonheur de Vivre (fig. 29-2A):
“What characterized Fauvism
was that we rejected imitative
colors, and that with pure colors
we obtained stronger reactions.”1
For Matisse and the Fauves, therefore, color became the formal
element most responsible for pictorial coherence and the
primary
conveyor of meaning (see “Henri Matisse on Color,” page 890).
Harmony in Red. !ese color discoveries reached maturity in
Matisse’s Red Room (Harmony in Red; fig. 29-3). !e subject is
the
interior of a comfortable, prosperous household with a maid
plac-
ing fruit and wine on the table, but Matisse’s canvas is radically
dif-
ferent from traditional paintings of domestic interiors (for
example,
figs. 25-19 and 25-19A). !e Fauve painter depicted objects in
simpli"ed and schematized fashion and .attened out the forms.
For
example, Matisse eliminated the front edge of the table,
rendering
the table, with its identical patterning, as .at as the wall behind
55. it.
!e window at the upper le/ could also be a painting on the wall,
further .attening the space. Everywhere, the colors contrast
richly
and intensely. Matisse’s process of overpainting reveals the
impor-
tance of color for striking the right chord in the viewer.
Initially, this
work was predominantly green. !en Matisse repainted it blue,
but
blue also did not seem appropriate to him. Not until he
repainted
the canvas red did Matisse feel that he had found the right color
for
the “harmony” he wished to compose.
29-2A MATISSE, Le Bonheur
de Vivre, 1905–1906.
29-2 Henri Matisse, Woman with the Hat, 1905. Oil on canvas,
29 7 340 × 19 11120. San Francisco Museum of Modern Art,
San Francisco
(bequest of Elise S. Haas).
Matisse’s portrayal of his wife, Amélie, features patches and
splotches of
seemingly arbitrary colors. He and the other Fauve painters
used color not
to imitate nature but to produce a reaction in the viewer.
1 ft.
Every thumbnail image has a corresponding full-size MindTap
Bonus Image and content in the MindTap reader for this
chapter.! 889
60. 808! CHAPTER 27 Romanticism, Realism, Photography: Europe
and America, 1800 to 1870
ROMANTICISM
Whereas Neoclassicism’s rationality reinforced Enlightenment
thought, particularly Voltaire’s views (see “Voltaire,” page
779),
Romanticism owed much to the ideas of Jean-Jacques Rousseau
(see “Rousseau,” page 781). Rousseau’s exclamation “Man is
born
free, but is everywhere in chains!”—the opening line of his
Social
Contract (1762)—summarizes a fundamental Romantic premise.
Romanticism emerged from a desire for freedom—not only
politi-
cal freedom but also freedom of thought, feeling, action,
worship,
speech, and taste. Romantics asserted that freedom was the right
and property of all. !ey believed that the path to freedom was
through imagination and feeling rather than reason.
!e allure of the Romantic spirit grew dramatically during the
late 18th century, when the term originated among German liter-
ary critics. !eir aim was to distinguish peculiarly “modern”
traits
from the Neoclassical traits that already had displaced Baroque
and Rococo design elements. Consequently, some scholars refer
to
Romanticism as a phenomenon that began around 1750 and
ended
about 1850, but most use the term more narrowly to denote an
art
movement that "ourished from about 1800 to 1840, between
Neo-
61. classicism and Realism.
Roots of Romanticism
!e transition from Neoclassicism to Romanticism in art was
more than a stylistic shi#. It represented a philosophical change
in
emphasis from calculation to intuition, from reason to emotion.
Among the leading manifestations of Romanticism was height-
ened interest in the medieval period and in the sublime. For
people
living in the 18th century, the Middle Ages were
the “dark ages,” a time of barbarism, superstition,
mystery, and miracle. !e Romantic imagina-
tion stretched its perception of the Middle Ages
into all the worlds of fantasy open to it, includ-
ing the ghoulish, infernal, terrible, nightmarish,
grotesque, and sadistic—the imagery that comes
from the chamber of horrors when reason sleeps.
Related to the imaginative sensibility was the
period’s notion of the sublime. Among the indi-
viduals most involved in studying the sublime was
the British politician and philosopher Edmund
Burke (1729–1797). In A Philosophical Enquiry
into the Origins of Our Ideas of the Sublime and
Beautiful (1757), Burke articulated his de$nition
of the sublime: feelings of awe mixed with terror.
Burke observed that pain or fear evoked the most
intense human emotions and that these emotions
could also be thrilling. !us raging rivers and
great storms at sea could be sublime to their view-
ers. Accompanying this taste for the sublime was
the taste for the fantastic, occult, and macabre.
John Henry Fuseli. !e Swiss painter Johann
Heinrich Füssli, better known by his English
62. name—J%&' H(')* F+,(-. (1741–1825)—lived
in Rome from 1770 to 1778, settled in England
in 1799, and eventually became a member of the
Royal Academy of Art and one of its instruc-
tors. Largely self-taught, he contrived a distinc-
tive manner to express the fantasies of his vivid
27-8 J!"# H$#%& F'($)*, !e Nightmare, 1781. Oil on canvas, 39
3 340 + 49 1
1
20. Detroit
Institute of the Arts (Founders Society purchase with funds
from Mr. and Mrs. Bert L.
Smokler and Mr. and Mrs. Lawrence A. Fleishman).
The transition from Neoclassicism to Romanticism marked a
shift in emphasis from reason
to feeling. Fuseli was among the first painters to depict the dark
terrain of the human
subconscious.
imagination. Fuseli specialized in night moods of horror and in
dark fantasies—in the demonic, the macabre, and o#en the
sadistic.
In !e Nightmare (/.0. 27-8), a beautiful young woman lies
asleep, draped across the bed with her limp arm dangling over
the
side. An incubus, a demon believed in medieval times to prey,
o#en
sexually, on sleeping women, squats ominously on her body. In
the background, a ghostly horse with "aming eyes bursts into
the
scene from beyond the curtain. Despite the temptation to see the
painting’s title as a pun because of this horse, the word
63. nightmare
in fact derives from “night” and “Mara.” Mara was an evil spirit
in
Scandinavian mythology who tormented and su1ocated sleepers.
Fuseli was among the $rst to attempt to depict the dark terrain
of
the human subconscious that became fertile ground for later
artists.
William Blake. In their images of the sublime and the terrible,
Romantic artists o#en combined something of Baroque dyna-
mism with naturalistic details in their quest for grippingly
moving
visions. !ese elements became the mainstay of Romantic art and
contrasted with the more intellectual, rational Neoclassical
themes
and compositions. !e two were not mutually exclusive, however.
Gros, Girodet-Trioson, and Ingres e1ectively integrated
elements of
Neoclassicism with Romanticism. So, too, did the visionary
English
poet, painter, and engraver W.--.23 B-24( (1757–1827).
Blake greatly admired ancient Greek art because it exempli-
$ed for him the mathematical and thus the eternal, and his work
o#en incorporated classical references. Yet Blake did not align
himself with prominent Enlightenment $gures. Like many other
Romantic artists, he also found the art of the Middle Ages
appeal-
ing. Blake derived the inspiration for many of his paintings and
poems from his dreams. !e importance he attached to these
1 ft.
30702_ch27_rev03_800-847.indd 808 11/06/18 4:40 pm
68. Flanders 577
crown at his feet and resplendent in a deep-
scarlet mantle—presides in majesty. To God’s
right is the Virgin, represented, as in the Gothic
age and in a small Jan van Eyck diptych (two-
paneled painting; !"#. 20-10A), as the queen of
Heaven, with a crown of 12 stars on her head.
John the Baptist sits to God’s le$. To either side
is a choir of angels, with an angel playing an
organ on the right. Adam and Eve appear in
the far panels. %e inscriptions in the arches
above Mary and Saint John extol the Virgin’s
virtue and purity and Saint John’s greatness as
the forerunner of Christ (see “Early Christian
Saints,” pages 246–247). %e inscription above
the Lord’s head translates as “%is is God,
all-powerful in his divine majesty; of all the best, by the gentle-
ness of his goodness; the most liberal giver, because of his
in&nite
generosity.” %e step behind the crown at the Lord’s feet bears
the
inscription “On his head, life without death. On his brow, youth
without age. On his right, joy without sadness. On his le$,
security
without fear.” %e entire altarpiece ampli&es the central theme
of
salvation. Even though humans, personi&ed by Adam and Eve,
are
sinful, they will be saved because God, in his in&nite love, will
sac-
69. ri&ce his own son for their sake.
%e panels of the lower register extend the symbolism of the
upper. In the center panel, saints arrive from the four corners of
the earth through an opulent, 'ower-spangled landscape. %ey
pro-
ceed toward the altar of the Lamb and the octagonal fountain of
life
(compare !"#. 20-2). %e book of Revelation passage that
recounts
the adoration of the Lamb is the main reading on All Saints’
Day
(November 1). %e Lamb symbolizes the sacri&ced son of God,
whose heart bleeds into a chalice, while into the fountain spills
the “pure river of water of life, clear as crystal, proceeding out
of
the throne of God and of the Lamb” (Rev. 22:1). On the right,
the
20-10A VAN
EYCK, Madonna
in a Church,
ca. 1430–1440.
A SECOND OPINION
Giovanni Arnolfini and His Wife
In 1434, Jan van Eyck depicted Giovanni Arnolfini, a Lucca
financier
who had established himself in Bruges as an agent of the Medici
family,
and his second wife in their home (FIG. 20-11). Arnolfini holds
the hand
of his spouse, whose name is not known. That much is certain,
but the
purpose and meaning of the double portrait remain the subject
70. of con-
siderable debate, with a few new interpretations having been
advanced
just during the last several years. According to the traditional
interpreta-
tion of the painting, Jan recorded the couple taking their
marriage vows.
As in the Mérode Triptych (FIG. 20-8), almost every object
portrayed car-
ries meaning. For example, the little dog symbolizes fidelity
(the com-
mon canine name Fido originated from the Latin fidere, “to
trust”). The
finial (crowning ornament) of the marriage bed at the right is a
tiny statue
of Saint Margaret, patron saint of childbirth. (The bride is not
yet preg-
nant, although the fashionable costume she wears makes her
appear
so.) From the finial hangs a whiskbroom, symbolic of domestic
care.
Indeed, even the placement of the two figures in the room is
meaningful.
The woman stands near the bed and well into the room, whereas
the
man stands near the open window, symbolic of the outside
world.
Many art historians, however, dispute this interpretation
because,
among other things, the room in which Arnolfini and his wife
stand is a
public reception area, not a bedchamber. One scholar has
suggested
that Arnolfini is conferring legal privileges on his wife to
conduct busi-
71. ness in his absence. Another thinks that this may be a memorial
portrait
of a wife who died in childbirth.
In any case, an important aspect of the painting is that the artist
functions as a witness to whatever event is taking place. In the
back-
ground, framed by the arms and joined hands of the two figures,
is a
convex mirror (complete with its spatial distortion, brilliantly
recorded;
compare FIG. 22-40), in which Jan depicted not only the
principals,
Arnolfini and his wife, but also two persons who look into the
room
through the door. (Arnolfini’s raised right hand may be a
gesture of
greeting to the two men.) One of these must be the artist
himself, as
the elegant inscription above the mirror, Johannes de Eyck fuit
hic (“Jan
van Eyck was here”), announces that he was present. The self-
portrait
also underscores the painter’s self-consciousness as a
professional art-
ist whose role deserves to be recorded and remembered.
20-11 J!" #!" E$%&, Giovanni Arnol!ni and His Wife, 1434.
Oil on wood, 29 90 ' 19 10 120. National Gallery, London.
Jan van Eyck played a major role in establishing portraiture as
an important
Flemish art form. In this portrait of an Italian financier and his
wife, he also
portrayed himself in the convex mirror on the rear wall.