Download to read offline

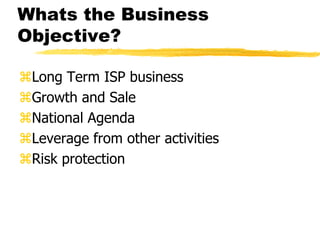
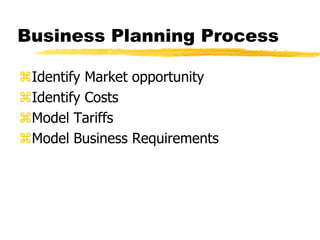

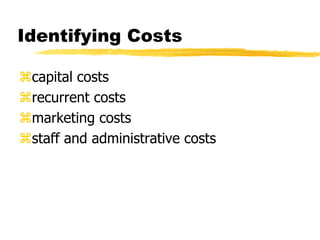
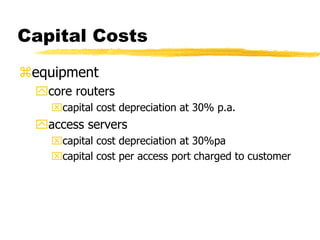
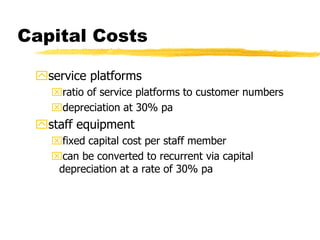
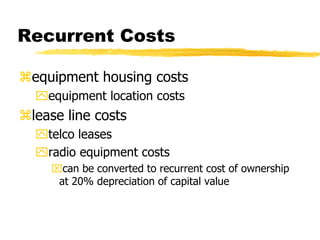
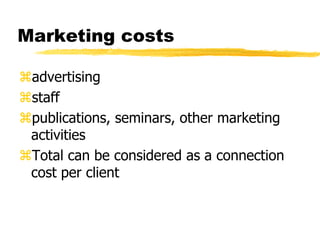
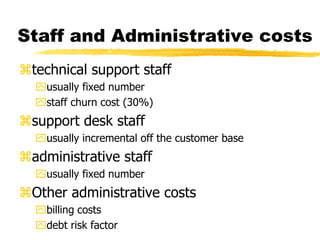
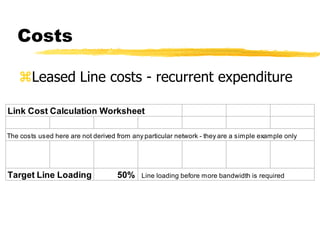
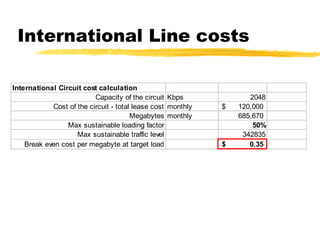
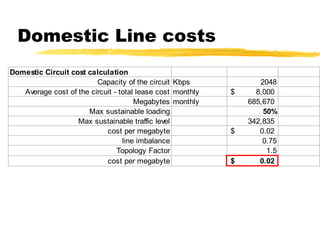
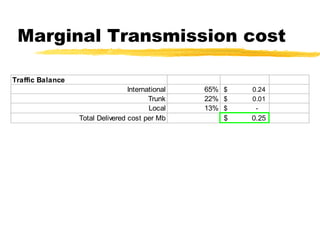
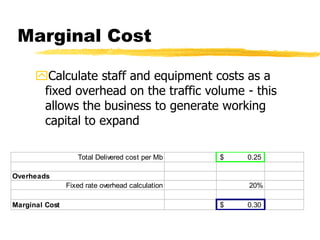

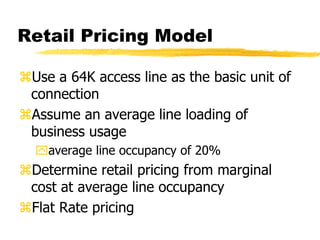
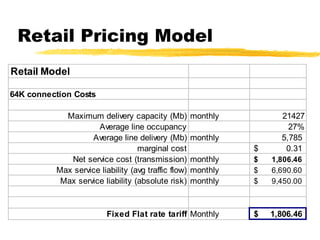

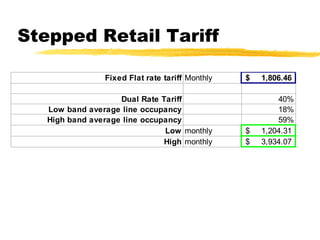
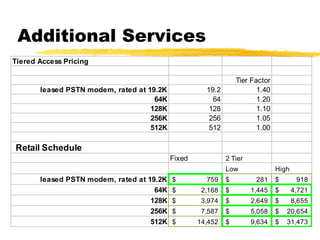
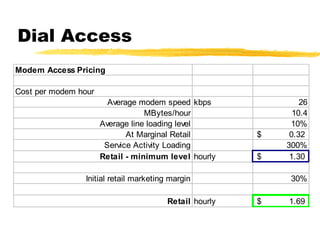

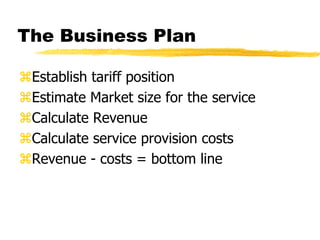
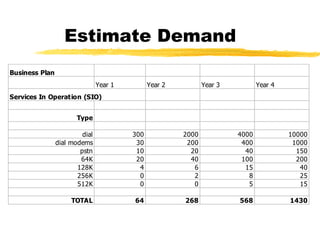
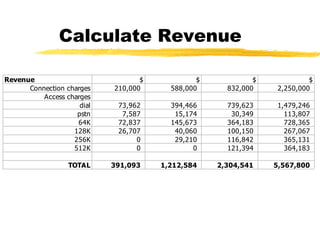
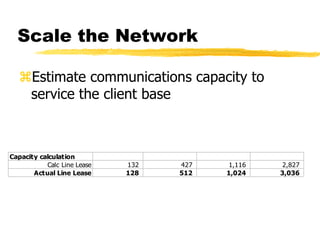
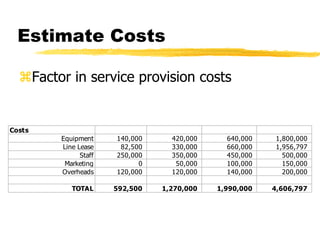
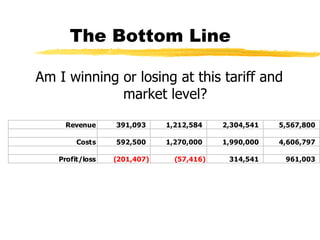

The document outlines the steps to develop a business plan for an ISP, including: identifying the business objectives and market opportunity; estimating costs such as capital, recurrent, marketing, and staffing; modeling tariffs; and developing a financial model to project revenue and costs over multiple years. It provides examples of calculating infrastructure and transmission costs, developing tiered access pricing, and estimating demand and network capacity requirements to generate a profit and loss statement. The goal is to establish a tariff position and financial model that shows the business becoming profitable as the customer base and services grow over a 3-4 year period.


