
Recommended
Recommended
More Related Content
Similar to Business Research Methods, 14eSchindler1casesState
Similar to Business Research Methods, 14eSchindler1casesState (19)
More from TawnaDelatorrejs
More from TawnaDelatorrejs (20)
Recently uploaded
Recently uploaded (20)
Business Research Methods, 14eSchindler1casesState
- 1. Business Research Methods, 14e/Schindler 1 >cases State Farm, the nation’s largest auto insurer, distributed a list of the 10 most dangerous intersections in the United States based on crashes resulting in claims by its policyholders. What started as a study to reduce risk turned into an ongoing study that directs a major public relations effort: State Farm provides funds for communities to further research their dangerous intersections and initiate improve- ments based on the research. This case tells you how the State Farm Dangerous Intersections initiative got started and how it is done. www.statefarm.com >Abstract >The Scenario State Farm Insurance has a rich history of proactive safety involvement in auto and appliance design to reduce injury and property loss. In June 2001, State Farm Insurance, Inc., released the second report in its Dangerous Intersection reporting series. State Farm modeled its program after an initiative by the Insurance Corporation of British Columbia, Canada (ICBC), and the American
- 2. Automobile Association of Michigan (AAA) to help position the nation’s largest auto insurer as the most safety- conscious insurer. ICBC had patterned its program on an earlier effort in Victoria, Australia. AAA, in turn, benchmarked its program on the ICBC program. AAA invited State Farm to help fund one of its intersection studies. State Farm saw this as an opportunity to expand its effort into a nationwide campaign in 1999. “The 2001 study is part of a larger effort focused on loss prevention and improving the safety of intersections around the U.S.A.,” shared State Farm research engineer John Nepomuceno. State Farm has allocated significant resources as well as funds to the initiative. Since its inception, every city with an intersection on the overall list of dangerous intersections is eligible to apply for a $20,000 grant to defray the cost of a comprehensive traffic engineering study of the intersection. Additionally, each city named to the national top 10 dangerous intersection list is eligible for a grant of $100,000 per intersection to defray some of the cost of making improvements. All totaled, State Farm offered $4.44 million to the safety initiative in its first year. Due to its large market share, State Farm is the only U.S. insurer in a position to mine its databases for the requisite information on accidents to come up with a viable U.S. list. But it found that although it had the interest to do so, its data warehouse
- 3. did not have sufficient information to tally accident rates for intersections. To rectify this, in 1998 State Farm included a location field as part of the data that its claims adjusters regularly complete. This location information, in open-text format, indicates whether the accident took place in an intersection or as part of an incident related to an intersection accident, and identifies the intersection. Following the 1999 study, the fields for identifying intersections were further refined. In the first study using 1998 data (reported in June 1999) as well as the 2001 State Farm: Dangerous Intersections Used with permission of Pamela S. Schindler ©2001. Business Research Methods, 14e/Schindler 2 study, State Farm looked at accidents involving only intersecting roads. They excluded any accident that occurred at the intersection of a road and a highway access or egress ramp. State Farm also looked only at accidents where the State Farm–insured driver was at fault. Because of the study’s focus on road safety engineering, the
- 4. first study ignored accident severity and made no attempt to isolate demographic (age or gender of driver, driving record, etc.) or geographic (weather conditions, population of area, etc.) factors related to the accident. It also looked only at State Farm’s own internal incident reports, not at any public records involving traffic patterns or volume or police incident reports. Based on industry market share information, State Farm was able to estimate the total number of crashes at a given intersection. “There was good reason to exclude police reports and traffic counts,” explained Nepomuceno. “The reporting threshold for police filing reports on accidents differs widely from jurisdiction to jurisdiction. Some will only fill out reports when personal injury or criminal behavior is involved. Others will fill them out only when a vehicle is damaged to the degree that it needs to be towed from the scene. Still others fill out such reports on every incident. Traffic volume reports are often prepared infrequently and often by independent sources. Not only may the data quality be questionable, but the time period in which the data was collected may not match our 1998 incident reports in every city involved. Also, when traffic volumes are factored in, low volume roads with relatively few crashes are often deprioritized. Now that we’re through with the 2001 study, we are asking ourselves if intersection volume should be factored in, and if so, how it can be included without significantly
- 5. increasing our effort in data processing.” In the 1998 study, State Farm identified 172 dangerous intersections. The top 10 most dangerous intersections in the United States were released publicly (www.statefarm. com). Public affairs staff for each state could request that up to 10 intersections be identified for their state. “This was usually determined by the resources that our local public affairs staff were willing to put toward the program,” shared Nepomuceno. “Each state had to recognize a top 10 national intersection, but they could request that no more be released or that up to 10 intersections within their state be released.” As of August 2001, 97 cities (56.4 percent) had applied for State Farm grants. “While some in the media claimed we had ‘hit a home run’ with the program, we quickly learned that there was a lot more at stake than we had anticipated in generating goodwill with transportation engineers,” indicated Nepomuceno. “This is, after all, a traffic safety program and we would not achieve that goal without having the cooperation of the traffic and transportation engineering community. First, while initially they lauded us for the attention our listing brought to traffic concerns, we and they soon discovered that the spotlight generated demand for immediate solutions, solutions that they often didn’t have budgets to implement.
- 6. Also, from their perspective, not all accidents are the same; locations with accidents that result in injuries and death should be given more attention. Some jurisdictions were upset that we didn’t consider intersection volume and we didn’t include accident rate data.1 The fact that the State Farm grants were intended to study the intersection State Farm: Dangerous Intersections Business Research Methods, 14e/Schindler 3 more completely wasn’t always seen as a solution to their immediate problems.” To include accident severity, State Farm needed a measurement system for classifying accidents. For the 2001 study, which used 1999 and 2000 accident data, State Farm calculated a median property damage accident payout (approximately $1,700). Incidents requiring payout of more than the median amount were classified as “high severity”; those requiring less, “low severity.” Additionally, State Farm chose to classify each accident using a multipoint scale. Zero was assigned to “no property damage, no personal injury” incidents and a higher number was assigned to “High property damage, personal injury” incidents, with numbers in
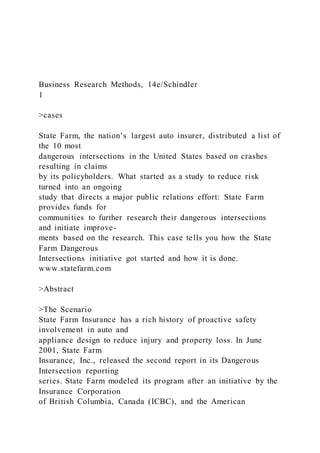
- 7. between assigned to levels of property damage and personal injury (see Exhibit SF 1–1). Accident scores were summed to create an aggregate danger index for each intersection. Each intersection was then weighted by dividing the danger index by State Farm’s market share in the area. Of the 224 intersections identified, the top 10 were released to the national media. Each of those 224 is now eligible for the $20,000 grant to study the intersection to identify specific improvements; the top 10 are also eligible for $100,000 grants for improvements. In this second round, State Farm has committed $5.48 million to the safety program. State Farm is making plans to track the success of the Dangerous Intersection program. Once cities notify them of the completion of an intersection’s improvements, State Farm will start tracking accidents for that intersection for a period of one year. The first post-improvement evaluation study is expected in 2002. Additionally, State Farm is taking steps to learn from the characteristics of the dangerous intersections. Each grant application for an affected city’s study of a dangerous intersection must include: • Collection and analysis of police report data. • An engineer’s “geometric review”2of the intersection. • A capacity profile of the intersection. • A traffic conflict study.3 • A benefit-cost analysis.
- 8. • A schedule of improvements (short-term, intermediate-term, and long-term).4 State Farm plans to use the new data to identify patterns of problems. This may lead to a model of desired intersection traits against which improvement plans can be assessed, further increasing the effectiveness of the loss prevention program and making life a little easier for the transportation engineers with whom they must partner to achieve safety success. Exhibit SF 1–1 Danger Codes No Personal Injury With Personal Injury No property damage 0 Y Low property damage 1 1 + Y High property damage X X + Y State Farm: Dangerous Intersections Business Research Methods, 14e/Schindler 4 1 Identify the various constructs and concepts involved in the study. 2 What hypothesis might drive the research of one of the cities on the top 10 dangerous intersection list? 3 Evaluate the methodology for State Farm’s research.
- 9. 4 If you were State Farm, how would you address the concerns of transpor- tation engineers? 5 If you were State Farm, would you use traffic volume counts as part of the 2003 study? What concerns, other than those expressed by Nepomuceno, do you have? >>>>>Discussion >>>>>Sources >Notes 1 Accident rate is calculated by dividing the number of accidents in a given period by the total traffic volume over the same period. 2 The intersection geometry or physical layout of the intersection can play an important role in influencing driver behavior at intersections. For example, a curve on the approach to an intersection may impede the sight distance to a traffic signal, preventing drivers from stopping in time. Or, a driver approaching two signalized intersections very closely spaced may see the traffic signals at both intersections and become confused about which traffic signal to obey. 3 A traffic conflict study is an observation study of traffic conflicts that do not necessarily end in an accident but have the potential to do so. Recording
- 10. and studying observations of driver behavior is expected to help traffic engineers understand the same problems that result in collisions. Some examples of conflicts are the sound of sharply applied breaks; sudden, unsignaled lane changes; or drivers hitting their horns. 4 Short-term improvements might include sign changes, changes in lane markings, or signal- timing changes. Most short-term improvements can be implemented in less than two years. Intermediate-term improvements might involve lane widening, the addition of turn lanes, etc., and be accomplished within 2–5 years. Examples of long- term improvements include grade separation of the intersecting roads and can take 5–10 years to implement. This case is based on information provided by John Nepomuceno in interviews that took place on August 9, 2001, and September 13, 2001. Other sources include: “Miami Area Intersection Tops State Farm List of Most Dangerous in the United States,” State Farm press release, June 27, 2001 (http://www.statefarm. com/media/release/danger00.htm); “Research” (http:// www.statefarm.com/media/methods.htm); and “State Farm 1999 Dangerous Intersection National Status List” (http://www.statefarm.com/media/statustop.htm); and “State Farm’s Dangerous Intersection Initiative,” Institute of Transportation Engineers press release, June 27, 2001 (http://www.ite.org/press_release.htm). State Farm: Dangerous Intersections
- 11. Criteria Ratings Points Content - Part I - Initial Post 9 to >8.0 pts Advanced Author responded to all case study questions by posted deadlines. Insightful throughout. Completely developed all relevant information. Critical issues and key areas that supported each question were clearly identified, analyzed, and supported. 8 to >7.0 pts Proficient Author responded to all case study questions by posted deadlines. Specific, solid. Less carefully developed. Some insights. Critical
- 12. issues and key areas that supported each question were partially identified, analyzed, and supported. 7 to >0.0 pts Developing Author responded to at least 4 questions by posted deadlines. Vague, obvious, underdeveloped, or too broad. One or more main issues not identified. Limited evidence of critical thinking. Critical issues and key areas that supported each question were not clearly identified, analyzed, and supported. 0 pts Not Present 9 pts Content - Part I - Direct Application of Scholarly Research
- 13. & Integration of Biblical Principles 9 to >8.0 pts Advanced Author accurately applied 5 or more scholarly (peer reviewed) sources to the discussion. Author accurately applied at least 1 scholarly (peer-reviewed) source to each question. Author accurately applied at least 1 scriptural/Biblical principles in each question response. 8 to >7.0 pts Proficient Author accurately applied at least 4 scholarly (peer reviewed) sources to the discussion. Author accurately applied at least 1 scholarly (peer-reviewed) source to each question. Author accurately applied at
- 14. least 1 scriptural/Biblical principle in each question response. 7 to >0.0 pts Developing Author accurately applied 1 -3 scholarly (peer reviewed) sources to the discussion. Author accurately applied at least 1 scholarly (peer-reviewed) source to some questions. Author accurately applied at least 1 scriptural/Biblical principle in each question response. 0 pts Not Present 9 pts Content - Part I - Mechanics, APA Style & Word Count 7 to >6.0 pts Advanced
- 15. Correct spelling and grammar are used throughout the essay. There are 0–1 errors in grammar or spelling that distract the reader from the content. There are 0–1 minor errors in APA format in the required items: citations and references. The word count of 800-1000 words is met. 6 to >5.0 pts Proficient There are 2-3 errors in grammar or spelling that distract the reader from the content. There are 2–3 minor errors in APA format in the required items. The word count of at least 750 words is met. 5 to >0.0 pts Developing There are 4-5 errors in grammar or spelling that distract the reader from the
- 16. content. There are more than 3 errors in APA format in the required items. The word count of 500–749 words. 0 pts Not Present 7 pts Discussion Grading Rubric | BUSI600_C01_202140 Criteria Ratings Points Content - Part II - Two Individual Response Posts 9 to >8.0 pts Advanced Author responded to at least 2 different peers by posted deadlines. Insightful throughout. Completely developed all relevant information. Critical issues and key
- 17. areas that supported each question were clearly identified, analyzed, and supported. Offer at least 1 strength and 1 weakness for each reply. 8 to >7.0 pts Proficient Author responded to at least 2 different peers by posted deadlines. Specific, solid. Less carefully developed. Some insights. Critical issues and key areas that supported each question were partially identified, analyzed, and supported. Offer at least 1 strength and 1 weakness for each reply. 7 to >0.0 pts Developing Author responded to at least 1 different peer by posted deadlines. Vague, obvious, underdeveloped, or too broad. One or more main issues not identified. Limited evidence of
- 18. critical thinking. Critical issues and key areas that supported each question were not clearly identified, analyzed, and supported. Offer at least 1 strength and 1 weakness for one reply. 0 pts Not Present 9 pts Content - Part II - Direct Application of Scholarly Research & Integration of Biblical Principles 9 to >8.0 pts Advanced Author accurately applied 2 or more scholarly (peer reviewed) sources to each peer response. Author accurately applied
- 19. at least 1 scriptural/Biblical principles in each question response (no more than 10% of the total response). 8 to >7.0 pts Proficient Author accurately applied at least 2 scholarly (peer reviewed) sources to each peer response. Author accurately applied at least 1 scriptural/Biblical principle in each question response (no more than 10% of the total response). 7 to >0.0 pts Developing Author accurately applied 1 or 2 scholarly (peer reviewed) sources to some peer response. Author accurately applied at least 1 scriptural/Biblical principle in each question response (no more than 10% of the total
- 20. response). 0 pts Not Present 9 pts Content - Part II - Mechanics, APA Style & Word Count 7 to >6.0 pts Advanced Correct spelling and grammar are used throughout the essay. There are 0–1 errors in grammar or spelling that distract the reader from the content. There are 0–1 minor errors in APA format in the required items: citations and references. The word count of 450–600 words is met for each response. 6 to >5.0 pts
- 21. Proficient There are 2-3 errors in grammar or spelling that distract the reader from the content. There are 2–3 minor errors in APA format in the required items. The word count of at least 400 words is met for each response. 5 to >0.0 pts Developing There are 4-5 errors in grammar or spelling that distract the reader from the content. There are more than 3 errors in APA format in the required items. The word count of 300 - 399 words is met for each response. 0 pts Not Present 7 pts Total Points: 50 Discussion Grading Rubric | BUSI600_C01_202140