Downloaded 136 times
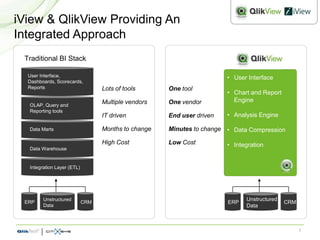
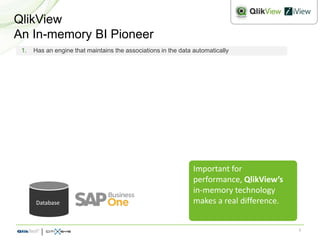
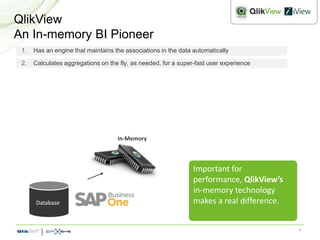

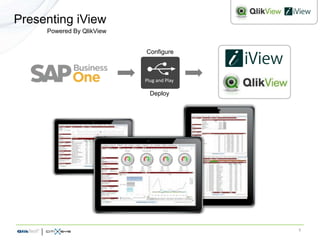
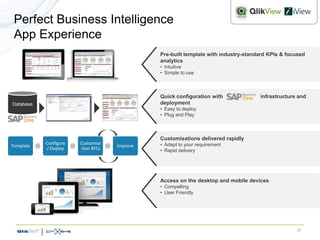

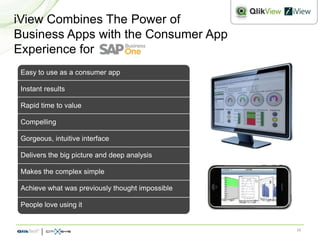


The document discusses the integration of QlikView and iView for SAP Business One, highlighting their unique capabilities such as in-memory technology, rapid data aggregation, and user-friendly interfaces. It reports high customer satisfaction and significant ROI from implementing QlikView, along with its effectiveness in various business applications. The emphasis is on the innovative, fast, and intuitive experience these tools provide for end users in business intelligence.