Download as PDF, PPTX
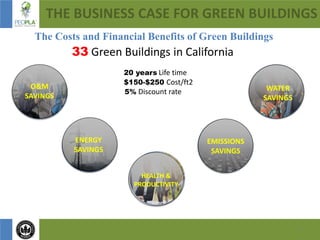
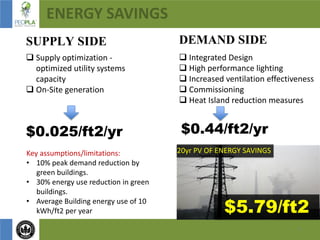
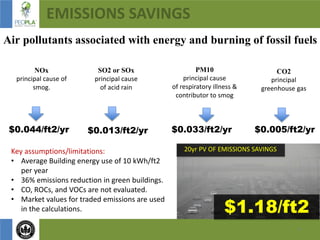
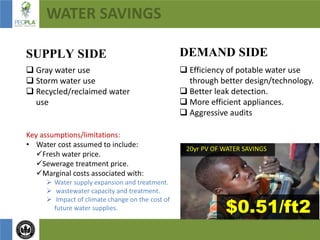
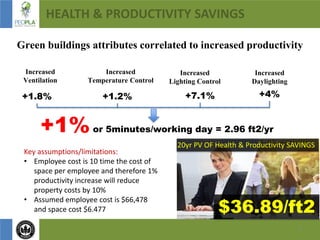
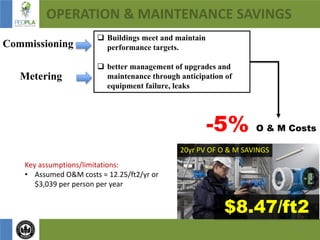
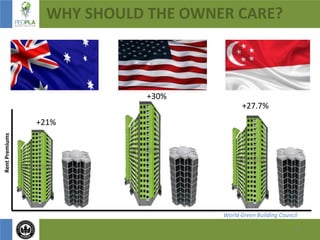
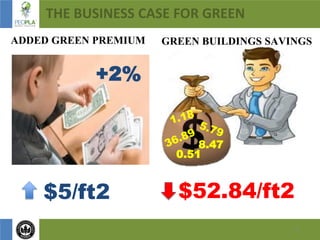
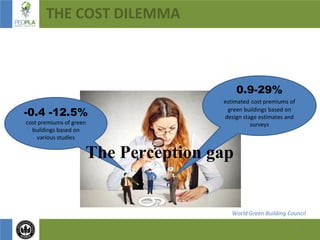
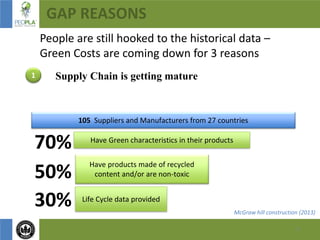
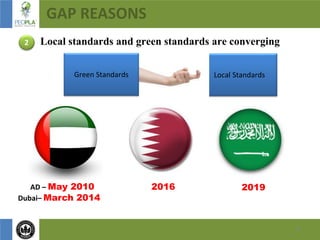
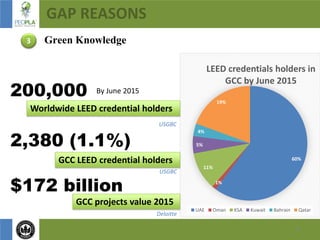
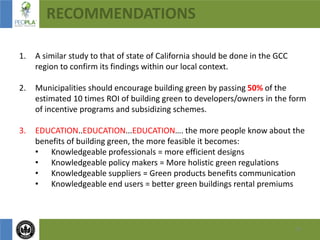

This document summarizes the business case for green buildings. It discusses how green buildings can provide savings through reduced energy usage, emissions, water usage, and increased health and productivity. It estimates that the net present value of savings over 20 years is $52.84 per square foot. However, there is still a perception gap around the costs of green buildings, with estimates ranging from 0.4-12.5% higher costs. This gap is decreasing as supply chains mature, standards converge, and knowledge increases. The document recommends conducting a similar study in the GCC region and increasing education and incentives to further the business case for green buildings.