This document presents a study characterizing the enhanced fluid transport observed in the presence of bubble-propelled tubular microengines using passive microsphere tracers. The study finds that:
1) Bubble generation by the microengines plays a dominant role in the dramatically enhanced displacement of passive tracer particles, as indicated by their mean squared displacement, compared to other micromotors like catalytic nanowires.
2) Fixing the microengines reveals that bubble evolution has a profound effect on tracer particle transport, separate from motor movement.
3) Tracer particle transport in the presence of bubble-propelled microengines is superdiffusive, with their mean squared displacement increasing nonlinearly with time, indicating their motion
Planet Velocity Is Defined As A Function Of Its Diameter (II) (revised) Gerges francis
Paper hypothesis
The Earth moon is created by effect of Uranus and Pluto motions
The hypothesis explanation
- Although the Earth moon is created by Planets collisions But
- The Earth moon data is created by an effect of light motion calculations
- That supports the conclusion that (light motion must be a companying with planet motion and effect on it)
Paper questions
- The paper tries to answer the following question:
o Why Mercury Day needs 5040 seconds to be 176 solar days?
o Why Uranus motion distance during (5040 seconds)= Pluto motion distance during 7511 seconds.
Paper conclusion
- Light Motion Is Accompanying With Planet Motion.
Gerges Francis Tawdrous +201022532292
Abstract
Paper hypothesis
- (1 hour = 1 day) this rate of time is produced by Uranus Motion Effect.
The hypothesis explanation
- Uranus motion causes 1 hour of a planet motion = 1 day of another planet motion –
- This process is done by Saturn motion interaction with Uranus motion –
- This rate of time is a part of the general rate of time (1 second of light motion is equivalent to 1 day of planet motion).
Paper objective
- The paper discusses the geometrical mechanism by which this process is done.
Gerges Francis Tawdrous +201022532292
Mercury Day needs 84 = 5040 seconds minutes to be 176 days
This Data analysis supports my claim that
"The Matter and Distance are created together by the Same Energy"
i.e.
The Matter is Energy
The Distance is Energy
The Space (distance) is a complementary to the Matter,
Means the matter can't be created without Space
Imagine a classroom
The classroom is NOT a space will be filled with desks..
It's mistaken
Each desk is brought inside the classroom, brought with it a part of the classroom floor
Now, the classroom floor is created with the desks and NOT without..
That's the concept I want to suggest
The matter and distance are complementary to each other … no one of both can found alone
This idea can easily be concluded from Matter Theory of Creation
Where the Theory supposes that the Matter is bright fringes and the distance is dark fringes
We can see that the matter is created as a rate to its complementary distance..
This meaning we concluded easily from the Equation
Planet orbital distance = Planet diameter * 1092
Note Please: 84 minutes = 5040 seconds but (71)2 = 5041
Jupiter uranus distance (metonic cycle reason) (revised)Gerges francis
1- Metonic Cycle is Energy sent from Uranus to the moon
2- Pluto also effects on Metonic Cycle
3-There's a relationship between Earth and the Moon at one side and Pluto at the other side
4- There's a relationship between Jupiter and Uranus at one side and Pluto at the other side
5- There's a relationship between Mercury and Pluto.
The previous relationships are found because
The solar group is one body (or one machine), and the solar planets are members in this body, and as the body blood connects all remembers. similar to that, the solar group is created from one energy, and this one energy creates the planet matter and orbital distance and connects all planets together in one system, which makes the solar group as one body (or one Energy trajectory).
Does Planet Day Period Depend On Its Circumference (VI)Gerges francis
Paper hypothesis
-The Moon Orbital Distance Is Proportional To Its Parent Circumference
-This hypothesis is suggested by the previous observation, which are
o Saturn moves during its day period a distance = its circumference
o Jupiter moves during its day period a distance = its circumference (+4%)
o Neptune moves during its day period a distance = 2 x circumferences
o Uranus moves during its day period a distance = 2.6 x circumferences
- This observations lead us to conclude that, Planet motion may depend on its circumference or the motion distance be function of the planet circumference..
- Then, the moon orbital radiuses analysis lead us to conclude this hypothesis, this paper tries to prove it
- By the hypothesis prove, many other old claims can be supported in addition, let's write them down here:
Gerges Francis Tawdrous +201022532292
The solar group geometrical structure is a pyramidGerges francis
I claim that
The solar group geometrical structure is a pyramid Form
Where the sun is in the Pyramid Head
And the solar outer planets form the Pyramid Base….
This paper tries to prove this fact..
Paper hypothesis
-The Motion Is Transported Among The Solar Planets.
The hypothesis explanation
-The Earth moon displacements total during 29.53 days = 2598693 km
-Pluto (4.7 km/s) moves during (153.3 h) a distance = 2593836 km
-Why These Distances Are Equal?
-How the motion at distance be done? or by what geometrical mechanism the masses gravity causes a motion at distance? These questions still need answers
- The motion transportation among the planets can be answer for these questions.
- What does mean "A motion Transportation"?
- It means, a planet motion causes another planet to move, and this motion depends on the planet motion and not on its masses gravity only. That tells, the motion transportation process must be done based on new geometrical rules.
- If the paper hypothesis is true and the motion is transported among the solar planets, that will answer why these 2 distances are equal? Because the motion is transported from one planet to another and by that the 2 planets move equal distances in defined periods of time.
Paper objective
- The paper tries to prove that, the motion is transported from a planet to another planet through the solar system and this motion transportation caused Pluto motion distance during its day period to be = the moon displacements total
Gerges Francis Tawdrous +201022532292
The moon motion basic equation (modified) (revised)Gerges francis
The Moon Motion Basic Equation (modified) (Revised)
Abstract
A Modification In
The Moon Orbital Motion Equation
The Old Form
θ1 (Per Solar Day) = θ0 (of Previous Day) + 0.98562 degrees
The Modified form
θ1 (Per Solar Day) = θ0 ( of Previous Day) + 1.6 degrees
- The Equation uses 1.5 degrees in place of the angle (0.98562 degrees) because the moon axial tilt (6.7 degrees) declines on the Earth Ecliptic line with 1.6 degrees.
- This paper tests the new modification on the equation accuracy
- The modified equation defines the moon position with an accuracy =96.12 %
(where the error is (3.88 %))
The Equation Concept
- The moon uses Pythagoras triangle to do the following job. While the moon moves a daily displacement =88000 km, The moon real displacement (L) through its orbit can be less than (88000 km) where (L =88000 Cos (θ))
- The moon needs to decrease its daily displacement (88000 km) through its orbit to enable the moon to revolve around Earth in more near orbits to Earth
- The angle (θ) defines the moon real displacement and its distance to perigee radius (r=0.363 mkm).
- For that reason the equation depends on the angle (θ).
Gerges Francis Tawdrous +201022532292
Paper hypothesis
The light supposed velocity 1.16 mkm/sec energy source is Earth motion
The hypothesis explanation
- 29.8 km /sec (Earth velocity) x 40080 seconds (Earth circumference 40080 km is used as a period of time) = 1.2 million /km
- The result 1.2 mkm = 1.16 mkm/sec + 40080 km /sec
- A light beam 1.16 mkm/sec is sent from Earth to Jupiter – this is Jupiter Energy source
- 40080 k/sec is a velocity used by Earth in the sun rays production equation.
Paper conclusion
- Earth is the source of the solar system energy.
Gerges Francis Tawdrous +201022532292
The first question in this research was why we see the sun disc = the moon disc? i.e. why (the Sun diameter/ the moon diameter) = (earth orbital distance/ Earth Moon distance)?
The answer was "That's only Pure Coincidence" (No.1)
Then I found another question…
The Earth-Moon Orbit circumference at apogee radius (406000km) = 2.58 mkm = Earth daily motion… why?
"That's also Pure Coincidence" (No.2)
Then I found the moon orbit geometrical relationships which are:
6. Earth Moon Distance at Perigee point =363000 km = Solar Outer Planets Diameters Total (error 1%)
7. Earth Moon Distance at Apogee point =406000 km = Solar Planets Diameters Total
8. The Distance between Perigee and Apogee = 40000km = Inner Solar Planets Diameters Total = Earth Circumference.
9. Saturn Circumference = Earth Moon Distance at total solar eclipse radius (377000km)
Why the previous relationships are found?
"Surely these are Pure Coincidence" (No.3)
Let's then with more depth, the moon has to move daily a distance = Earth daily motion, otherwise they will be separated from each other.. that means the moon should move daily =2.58 mkm, but we know that the moon orbit circumference at apogee radius (406000km) also 2.58mkm ..why?
"We all know this is Pure Coincidence" (No.4)
Then Metonic Cycle question is produced
Why the moon orbit regresses daily 19 degrees? Why the moon rotates Metonic Cycle which Earth doesn't? let's think with some deep vision
Metonic Cycle period = 6939.75 days
6939.75 days = 19 x 365.25 days (19 sidereal years)
= 235 x 29.53 days (Synodic Month)
= 20 x 346.6 days (nodal year)
The previous data tells us that, the Earth motion is in harmony with Moon and Moon orbit motions, that's why the three motions finish their cycles in the same time \
Why?
"Just Pure Coincidence" (No.5)
I found we need to find some logical and physical explanation behind all these data, I can't accept any of these as Pure coincidences…
A Modification In
The Moon Orbital Motion Equation
The Old Form
θ1 (Per Solar Day) = θ0 (of Previous Day) + 0.98562 degrees
The Modified form
θ1 (Per Solar Day) = θ0 ( of Previous Day) + 1.5 degrees
- The Equation uses 1.5 degrees in place of the angle (0.98562 degrees) because the moon axial tilt declines on the Earth Ecliptic line with 1.5 degrees.
- This paper tests the new modification on the equation accuracy
- The modified equation defines the moon position with an accuracy =96.12 %
(where the error is (3.88 %))
The Equation Concept
- The moon uses Pythagoras triangle to do the following job. While the moon moves a daily displacement =88000 km, The moon real displacement (L) through its orbit can be less than (88000 km) where (L =88000 Cos (θ))
- The moon needs to decrease its daily displacement (88000 km) through its orbit to enable the moon to revolve around Earth in more near orbits to Earth
- The angle (θ) defines the moon real displacement and its distance to perigee radius (r=0.363 mkm).
- For that reason the equation depends on the angle (θ).
Gerges Francis Tawdrous +201022532292
Why Earth moves Daily A Distance = The Moon Orbit CircumferenceGerges francis
The Moon Orbit Data shows A Geometrical Structure more complex than the Current theories can explain … Let's refer to it in following:
- Perigee Radius (R1) = Earth Moon Distance = 363000 km (Earth Nearest Point)
- Eclipse Radius (R2) = Earth Moon Distance = 377000km (Total Solar Eclipse Point)
- Average Radius (R3) = Earth Moon Distance = 384000 km (Registered Value)
- Apogee Radius (R4) =Earth Moon Distance = 406000km (The Most Far Point)
Earth Daily Motion 2.58 mkm = The Moon Orbit Circumference at apogee (R4)..why?
The Data
I. Earth Moon Distance at Perigee Point = The Outer Planets Diameters Total
II. Earth Moon Distance at Apogee Point = The Solar Planets Diameters Total
III. The Distance Between Perigee & Apogee Points = the inner planets Diameters total = Earth Circumference
IV. Earth Moon Distance (At Total Solar Eclipse Radius) = Saturn Circumference.
V. The Solar Planets Diameters Total = Saturn Diameter +2 Jupiter Diameters
The Moon Orbit Main Points: (Perigee - Solar Eclipse – Average- Apogee)
These points are defined based on the following geometrical rules:
1- (1st Rule) "R2n + (86000km)2= R2n+1" (Pythagoras Rule)
2- (2nd Rule) "2πRn= (1/Rn+1)" (Reflective Values)
3- (3rd Rule) "(2πRn+1/ 2πRn) =1.0725" (Relativities Effects)
(We should prove these rules in this paper)
The Conclusions
1- The Gravity Force Can't Create The Moon Orbit
2- The Space is A Geometrical Player In The Solar Group Geometry
3- There are relativistic effects in the solar Group
4- The Relativistic effects cause geometrical rules control the general geometrical structure (i.e. the higher velocity creates specific form for the space in which it travels)
The solar group geometrical structure is a pyramid (revised)Gerges francis
The Solar Group Is A Pyramid
Abstract
Let's explain this idea in following:
- The sun is found on the Pyramid Apex
- Each Planet is found on different level which makes the solar group as a ladder
- The planets (Mercury - Saturn - Neptune – Pluto) form the Pyramid Base
- The players (The sun – Earth – Moon – Mars) form the pyramid Height (The Pyramid Main Column)
- The rest planets form the Pyramid walls
- The pyramid is consisted by the planets motions
i.e.
- The Pyramid Is The Solar Planets Motions Trajectory…
- The Pyramid Base and Height consist from different planets levels on the ladder…
Best Regards
Gerges Francis Tawdrous
TEL +201022532292
E-mail georgytawdrous@yandex.ru
Linkedln https://eg.linkedin.com/in/gerges-francis-86a351a1
Does Planet Day Period Depend On Its Circumference (III)Gerges francis
Paper hypothesis
The Planet Day Period Definition : The Period Through Which The Planet Moves A Distance = Its Circumference.
Paper Question No. (1)
Is There An Interaction Between The Earth Moon & Jupiter Motions?
- Because
- Jupiter Diameter 142984 = The Earth Moon Circumference 10921 km x 13.1
- Where
- 13.1 km /sec = Jupiter Velocity …………And
- 13.18 degrees = the Earth moon motion degrees per solar day
- Shortly
- Are these 2 values (13.1 and 13.18) created depending on each other
- Which proves an interaction between Jupiter & the Earth moon Velocities
Paper Question No. (2)
If This interaction is found, can it effect on both Planets Days Periods?
- The paper discusses these questions
Gerges Francis Tawdrous +201022532292
Unit operation in Food Processing. Preliminary Unit operation
Cleaning, sorting & Grading - aims, methods and applications
2. Size Reduction and Sieve Analysis
Theory of comminution; Calculation of energy required during size reduction. Crushing efficiency; Size reduction equipment; Size reduction of fibrous, dry and liquid foods; effects of size reduction on sensory characteristics and nutritive value of food
Sieving: Separation based on size (mesh size); types of screens; effectiveness of screens
3. Mixing
Mixing, Agitating, kneading, blending, homogenization and related equipment
4. Separation Processes
Principles of Filtration, Sedimentation, Crystallization and Distillation and equipment used
Why we see the sun disc = the moon disc? (T.S. Eclipse II)Gerges francis
This paper discusses Mercury Data to prove 3 conclusions which are:
1- The solar group is one machine, each planet is a gear in this same machine. (i.e. each solar planet depends on other solar planets in his Origin And Motion).
2- Mercury Data shows a relationship with Jupiter can't be explained by gravity concept or any current theory. (i.e. The Solar Group Current Theory Is Insufficient)
3- Special Theory of Relativity provides empirical results only and need a theoretical extension to be a complete theory. (Specifically, the theory needs to explain why the lorentz length contraction phenomenon is done and what geometrical effect it practices)
The paper also suggest the following idea
"The Time existence depends on relativistic effects"
i.e.
"Time Definition" is a process extends beyond the human daily experiences
This paper completes the previous discussion
Total Solar Eclipse Analysis (Part I)
Saturn Effect On The Solar Group Geometry
Saturn shows Clearly The Solar Group Geometrical Structure.
The Basic Hypothesis:
The Solar Group Is One Trajectory Of Energy And Each Planet Is A Point On This Same Trajectory…
i.e.
The Solar Planets (matter is energy because E=mc2) and their orbital distances (Space is Energy – hypothesis)both are created from the same energy which makes
The solar group as one body and each planet is a member of this same body.
Or
The solar group can be similar to one machine each planet is a gear in this same machine… so the solar group is created depending on the cooperation and integration between the solar planets.
Saturn Effect
Saturn tells how the solar group is created based on the previous vision
i.e.
Saturn tells us which planet is created first and which second and what geometrical rule control this creation process.
Shortly
The solar group is one family, all planets are relatives to each other – but Saturn tells us who's brother to whom and who's uncle, who's parent and who's nephew
Saturn Data tells this fact clearly as the sun …Saturn Is The Solar Group Secret
- The moon orbital triangle is created to explain that, many data in the moon orbit is created based on Pythagoras rule
- This paper provide the moon orbital triangle to be analyzed geometrically as deep as possible
Paper Claim
- The moon motion depends on Pythagoras triangle, and because of that the moon orbital triangle analysis can solve many basic questions in the moon motion
- The moon orbital triangle proves that, there's another force effect on the moon motion, this force is seen in (Point A) in the moon orbital triangle.
Paper question
- Why the moon orbital triangle is a significant triangle?
- Because the moon uses Pythagoras triangle to define its motion points, why? because the moon daily displacement isn't used as a real displacement through the moon orbit – instead – the moon uses part of this displacement to be the real displacement suitably to the orbit radius – that's why the moon orbital triangle is a cornerstone in the moon motion definition –
Gerges Francis Tawdrous +201022532292
Nonlinear Darcy flow dynamics during ganglia stranding and mobilization in he...Anastasia Dollari
We study the steady-state displacement of nonwetting liquid ganglia during immiscible two-phase flows in realistic focusing
primarily on the nonlinear Darcian regime that arises when capillary to viscous (or gravity) forces become comparable at the pore scale.Published at Phys Rev Fluids Journal, 2019.
Paper hypothesis
The Moon Orbit Is Created In A Triangle Form
The hypothesis explanation
- The moon uses Pythagorean triangle as one of its motion techniques because the moon daily displacement =88000 km, and during 29.5 days the total distance will =2.598 mkm, which should be = the moon orbital circumference…. But
- (2.598 mkm = 2π x 413000 km) (the moon apogee radius =0.406 mkm) (1%)
- Based on that, if the moon uses its displacement as a real displacement through its orbit, the moon would revolve around Earth through its apogee orbit only along month.
- The intelligent moon creates an angle (θ) between its displacement motion direction and its orbit horizontal level, by that, the real displacement through the orbit be (L =88000 km cos (θ)), and will be shorter than 88000 km enables the moon to revolve around Earth through more near orbits.
- The moon using of Pythagorean triangle technique creates the moon orbit in a triangle form. (The paper hypothesis)
- The using of Pythagorean triangle is a proved fact otherwise the moon apogee radius should be (r=0.413 mkm) in place of (r=0.406 mkm).
Gerges Francis Tawdrous +201022532292
Mesoscopic simulation of incompressible fluid flow in porous mediaeSAT Journals
Abstract
Lattice Boltzmann method is used to simulate cavity driven fluid flow in porous media. A square cavity is considered with the top
lid moving with uniform velocity and other sides kept stationary. Simulation is carried out for values of Darcy number ranging
from 10-6 to10-2 at Reynolds number 10 and 100. Influence of Darcy number and Reynolds number is investigated on velocity
profiles and the streamline plots. Half-way bounce back boundary conditions are employed in the numerical simulation. The
numerical code is first verified with the results available in the literature and then used to simulate the Newtonian fluid flow in
porous media. The Darcy number and the Reynolds number were observed to have great influence on the flow properties and the
location of the primary vortex. Simulation was carried out for a 100100 mesh grid and a fine agreement is established theories
in incompressible fluid flow.
Keywords: Lattice Boltzmann method, incompressible flow, porous media
IJRET : International Journal of Research in Engineering and Technology is an international peer reviewed, online journal published by eSAT Publishing House for the enhancement of research in various disciplines of Engineering and Technology. The aim and scope of the journal is to provide an academic medium and an important reference for the advancement and dissemination of research results that support high-level learning, teaching and research in the fields of Engineering and Technology. We bring together Scientists, Academician, Field Engineers, Scholars and Students of related fields of Engineering and Technology
International Journal of Engineering Research and Applications (IJERA) is an open access online peer reviewed international journal that publishes research and review articles in the fields of Computer Science, Neural Networks, Electrical Engineering, Software Engineering, Information Technology, Mechanical Engineering, Chemical Engineering, Plastic Engineering, Food Technology, Textile Engineering, Nano Technology & science, Power Electronics, Electronics & Communication Engineering, Computational mathematics, Image processing, Civil Engineering, Structural Engineering, Environmental Engineering, VLSI Testing & Low Power VLSI Design etc.
Numerical study of disk drive rotating flow structure in the cavityeSAT Journals
Abstract
This paper aim in conducting the numerical simulation of laminar flow to explore disk-driven vortical flow structure of a cubical
container subjected to a disk rotation on the roof of the container in different Reynolds numbers to observe the flow structure and
the reason of vortical flow form. For this study, finite difference method with dispersion-relation- preserving (DRP) scheme is
dispersed governing equations space term, but adopt time term with TVD Runge-Kutta method. To add accuracy of numerical,
this thesis also uses topology theory to analyze the characteristic of singular point. Three-dimensional vertical flow is observed
flow structure and move to condition. The result to obtain Reynolds numbers to increase attracting spiral nodes increasingly
approaches the floor of the cavity. We have also depicted the vertical flow structure in terms of cortex cores which provide more
details about how change of the Reynolds number
Keywords: disk-driven, finite difference method, dispersion-relation-preserving (DRP), Runge-Kutta, topology theory
LATTICE BOLTZMANN SIMULATION OF NON-NEWTONIAN FLUID FLOW IN A LID DRIVEN CAVITY IAEME Publication
Lattice Boltzmann Method (LBM) is used to simulate the lid driven cavity flow to explore the mechanism of non-Newtonian fluid flow. The power law model is used to represent the class of non-Newtonian fluids (shear-thinning and shear-thickening fluids) by considering a range of 0.8 to 1.6. Investigation is carried out to study the influence of power law index and Reynolds number on the variation of velocity profiles and streamlines plots. Velocity profiles and the streamline patterns
for various values of power law index at Reynolds numbers ranging 100 to 3200 are presented. Half way bounce back boundary conditions are employed in the numerical method.
International Journal of Engineering Research and Applications (IJERA) is an open access online peer reviewed international journal that publishes research and review articles in the fields of Computer Science, Neural Networks, Electrical Engineering, Software Engineering, Information Technology, Mechanical Engineering, Chemical Engineering, Plastic Engineering, Food Technology, Textile Engineering, Nano Technology & science, Power Electronics, Electronics & Communication Engineering, Computational mathematics, Image processing, Civil Engineering, Structural Engineering, Environmental Engineering, VLSI Testing & Low Power VLSI Design etc.
The Illustration of Mechanism and development of Atmospheric dynamic peripher...iosrjce
This research papers illustrates and justify the soil shifting and a pre determinant mechanism of
testing and real time analysis of soil composition and the behavior by concentric waveform generation and the
field effect of the concentric waves thus formed. The waveforms generated are being analyzed using a field wire
enclosure structure having a non conducting cylinder with circular magnetic field effect induction. The
electrical pulses being generated are plotted against fluid viscosity behavior. The research paper illustrates
with conclusion and analysis that a correlation simulation model is possible with fluid properties to generate
non obvious prediction mechanism to possible pulse generator.
How do you get a job in data science? Knowing enough statistics, machine learning, programming, etc to be able to get a job is difficult. One thing I have found lately is quite a few people may have the required skills to get a job, but no portfolio. While a resume matters, having a portfolio of public evidence of your data science skills can do wonders for your job prospects. Even if you have a referral, the ability to show potential employers what you can do instead of just telling them you can do something is important. This is a talk based on my original blog on Building a Data Science Portfolio: https://towardsdatascience.com/how-to-build-a-data-science-portfolio-5f566517c79c
2. tubular microengines were fixed to the glass slide were also
used to separate the effect of the motor movement from that of
the bubble generation, and to illustrate that the bubble
evolution has a profound effect upon the observed enhanced
transport of passive bead tracers.
The polymer-based microtubular engines were prepared by a
template-based electrodeposition of poly(3,4-ethylenedioxy-
thiophene) (EDOT) and COOH-EDOT/Pt bilayer14
(see
Experimental section in the Supporting Information (SI)). The
template fabrication process resulted in ∼8 μm-long polymer/
Pt microtubes that propelled efficiently via the ejection of
oxygen bubbles generated by the catalytic decomposition of
hydrogen peroxide fuel at their inner Pt layer.14
As will be
discussed below, both the movements of the motors and of the
bubbles they generate contribute to the marked increase in the
effective diffusion coefficient of the 2 μm passive polystyrene-
bead tracers. To examine the effect of motor movement and
bubble generation on the transport of the passive tracers, equal
volumes of four different solutions (of particles, micromotors,
surfactant and fuel) were placed on a glass slide. The effect of
ambient air motion and droplet spreading on particle transport
was determined to be negligible by conducting a parallel
experiment in the reservoir of a tailor-made PDMS chip, as will
be described below. The movement of the micromotors and of
their corresponding oxygen bubbles generated flow fields that
caused the displacement of the passive tracers (Figure 1). The
motion of the particle tracers was video-recorded and analyzed
with an automated particle-tracking software (see Experimental
section for details). To minimize the influence of the three-
dimensional fluid flow caused by the bubble collapse occurring
at the top of the droplet, the passive bead tracers were only
tracked near the bottom surface, where their motions and MSD
were analyzed in two dimensions.
Figure 2 and SI Video 1 demonstrate the significantly
enhanced diffusion of 2 μm passive polystyrene spherical
particles due to the movement of bubble-propelled micro-
tubular engines, compared to particles undergoing Brownian
motion only. For example, Figure 2A,B display traces of the
particle trajectories (during a 30 s period) and a plot of the
mean squared displacement versus time, respectively, in the
absence (a) and presence (b) of the hydrogen-peroxide fuel. In
the absence of fuel (H2O2), both the micromotors and the
tracer particles experience Brownian motion and thus the
particle trajectories are chaotic and random, with negligible
displacements (Figure 2a). In contrast, the bubble-propelled
micromotors move rapidly in the presence of H2O2, leading to
significantly enhanced fluid transport and displacement of the
tracer particles (Figure 2b). The time-lapse images (A, top)
illustrate the ability to simultaneously visualize and track both
the tracer beads and the micromotors (with their microbubble
tails). These images, and the corresponding tracking plots
(shown at the bottom of A) indicate that the bead displacement
is not uniform. As expected, the enhanced diffusion of the
passive beads is strongly influenced by their position relative to
the moving micromotors, being larger as the distance between
the beads and the micromotors decreases. Unlike other catalytic
motors, the tubular microengines tend to be inhomogeneously
distributed in space (e.g., SI Video 2). Yet, as will be illustrated
below, the average distance traveled by a large population of
tracer particles(n = 100) is substantially greater than that
observed in the presence of other common micromotors. The
trajectories traced by the particles suggest that the nature of the
flows they experience is coherent. This behavior is consistent
with the hypothesis (discussed below) that the enhanced
transport is greatly affected by the flow fields induced by the
generated bubbles. The latter translate vertically and their flow
fields are therefore relatively coherent compared to the flow
fields induced by the translating micromotors, which follow
random trajectories in arbitrary directions.
The transport is quantified in terms of the mean squared
displacement (MSD) ⟨Δx2
⟩ after a fixed time interval Δt,
defined as
Δ | = Δ − + Δ −Δx x t x y t y( ( ) ) ( ( ) )t
2
0
2
0
2
(1)
where the angle brackets ⟨·⟩ indicate an average over an
ensemble of n = 100 particles, subscript “0” denotes the original
position of the tracer, and x(Δt) and y(Δt) are the coordinates
of the particle in the plane of motion after time interval Δt. In
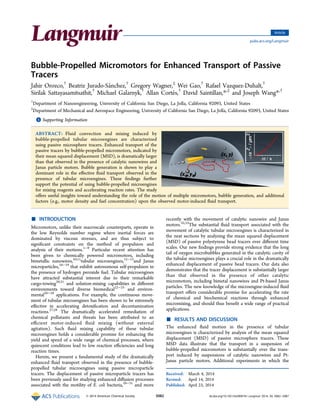
general, the magnitude of the MSD reflects the strength of the
Figure 1. Schematic illustration of micromotor-enhanced transport of
passive microparticle-tracers. Equal volume of solutions containing
particles, micromotors, surfactant, and fuel were placed on a glass slide,
and oxygen bubbles ejected from the self-propelled micromotors along
with their own motion made the passive tracers displace from an initial
to a final position denoted in the figure as (x0, y0) and (x, y),
respectively. The enhanced motion rate of the particles is estimated by
measuring their mean-square displacement ⟨Δx2
⟩ at both short and
long time intervals and its trend is studied upon such intervals, as
shown in the inset at the top right of the figure.
Figure 2. (A) Time-lapse images illustrating typical trajectories of nine
particle tracers undergoing Brownian motion and a mixture of
Brownian motion and convection using microtube engines in the
absence and presence of the peroxide fuel, respectively. Typical
tracking plots of the total distance traveled by the particles during 30 s
are displayed at the bottom part of A (a and b), respectively. (B)
Mean-squared displacement obtained by averaging over 100 particles,
whose trajectories are subject to the effect of active micromotors
swimming for 30s (b), with respect to that governed only by Brownian
motion (a) upon time, at time intervals of 0.06 s. Enhanced transport
of the passive tracers (2 μm, ∼1.4 × 10⁷
/mL) is caused by the catalytic
micromotors (8 μm, 4 × 10⁶
/mL) when self-propelled in aqueous
solutions containing 5% Triton X-100 and 1.5% H2O2. Scale bar, 10
μm.
Langmuir Article
dx.doi.org/10.1021/la500819r | Langmuir 2014, 30, 5082−50875083
3. transport, while its functional dependence on Δt characterizes
the nature of this transport. In the case of pure Brownian
motion in two dimensions, the MSD of a collection of spherical
particles obeys:31
Δ = Δx D t42
(2)
Where D is the Brownian diffusivity of the particles. By analogy,
a complex transport process involving a combination of
diffusion and convection and such that the MSD grows linearly
with time: ⟨Δx2
⟩ ∼ Δt (either within some interval Δt or for all
times) is characterized as diffusive, and eq 2 can then be used to
define an effective diffusion coefficient D. On the other hand, a
purely ballistic motion of the particles results in the quadratic
growth of the MSD with time: ⟨Δx2
⟩ ∼ Δt2
, and more generally
the transport is said to be superdiffusive if the MSD increases as
⟨Δx2
⟩ ∼ Δtα
, with α > 1.31
Over the time interval studied here,
the enhanced diffusion of tracer particles due to bubble-
propelled micromotors (in the presence of 1.5% H2O2) appears
to be anomalous, with the MSD of the particles increasing
nonlinearly with time as ⟨Δx2
⟩ ∼ tα
, with α >1.5 indicating
superdiffusive transport. A superdiffusive behavior has been
previously reported for the transport of passive tracer beads in a
bath of motile bacteria.31
In contrast, without the H2O2 fuel,
tracer particles travel only by Brownian motion, and the data
(shown in SI Figure 1) is consistent with normal diffusion with
the MSD of the particles increasing linearly as a function of
time (α = 1.0).
Figure 2B displays plots of ⟨Δx2
⟩ versus time for the bead
tracers in the absence (a) and presence (b) of the H2O2 fuel
(and using the 5% Triton X-100 surfactant essential for the
bubble evolution). The influence of micromotor activity (in the
presence of the fuel) is clearly indicated from the dramatically
larger MSD of the tracers as compared with pure Brownian
motion, with D = 3.05 μm2
s−1
(estimated from the maximum
slope of MSD versus time over the time interval considered
here) (b). In contrast, in the absence of fuel (Brownian
motion), but in the presence of surfactant we obtain D = 0.024
μm2
s−1
. This value of D is about 1 order of magnitude lower
than the theoretically calculated value using the Stokes−
Einstein relation, D = kT/6πηa = 0.21 μm2
s−1
(with k
Boltzmann constant, T temperature, η fluid viscosity, and a
particle diameter). In order to gain further insights into this
phenomenon, we conducted similar experiments in the absence
of both the fuel and surfactant. This experiment resulted in a
MSD corresponding to D = 0.17 μm2
s−1
, which is consistent
with pure Brownian motion (see also SI Figure 1), and is close
to the theoretical value expected for the “hindered diffusion” of
particles near a solid no-slip surface.34
The decrease in D by an
order of magnitude in the presence of surfactant can be
attributed to the generation of depletion forces between the
particles and the glass slide,35
which hold the particles close to
the glass surface and enhance the hindered diffusion effect. In
order to investigate possible contributions of ambient air
motion and droplet spreading on the magnitude of D, we also
conducted a series of experiments with drops confined in the
reservoir of a PDMS chip. This effect was found to be
negligible, as indicated by the value of D = 0.032 μm2
s−1
for a
Brownian motion experiment (in the presence of surfactant),
which is close to the value estimated for the unconfined drop
(D = 0.024 μm2
s−1
).
The substantial fluid transport imparted by tubular micro-
engines is obvious upon comparison to other common catalytic
micromotors (which are well-known to produce significantly
less and greatly smaller bubbles). We conducted a series of
experiments critically comparing the tracer transport induced
by the bubble-propelled tubular microengines with that
observed in the presence of common self-propelled nanowires
and Janus microparticles. Figure 3 compares the MSDs of the
tracer particles over a 30 s period in suspensions of the different
catalytic micromotors, including tubular microengines (a),
Janus microparticles (b), and bimetallic nanowires (c), all
powered by 1.5% H2O2 fuel (see also SI Videos 1 and 3). The
calculated MSDs clearly indicate that the bubble-propelled
microtubes induce a substantially greater tracer transport at all
time intervals compared to the self-propelled Janus particles
and bimetallic nanowires under the same fuel concentration (a
vs b and c). For example, the MSD in the presence of bubble-
propelled tubular microengines after 30 s (4679 μm2
) is around
10-fold and 16-fold larger compared to those induced by Pt-
based Janus microparticles (442 μm2
) and Au−Pt nanowires
(290 μm2
), respectively. The corresponding time-lapse images
and particle trajectories in the presence of the different catalytic
motors (shown on the right) clearly illustrate the significantly
larger displacement of the tracer particles in the presence of
tubular microengines (a), compared to nanowire (b) or Janus
particle (c) motors. Even with a 3-fold increase of the fuel level
of the nanowire and Janus-particle motors (to 5%), the bubble-
propelled microengines (at 1.5% fuel) still led to a substantially
enhanced fluid transport of the tracer particles (see SI Figure
2), with the MSD ca. 3-fold and 5-fold larger compared to
those observed using Janus particles and nanowires, respec-
tively. These data clearly demonstrate the advantage of the
tubular microengines (over other catalytic micromotors)
toward enhanced fluid transport and solution mixing.
A clear distinction between the self-propulsion of the
different catalytic micromotors is the effective production of
bubbles by the tubular microengines. In order to gain better
understanding of the enhanced particle transport process
associated with these microengines, we conducted a series of
experiments aimed at distinguishing the relative contributions
of the motor self-propulsion and of the bubble generation and
motion on the enhanced transport of the tracer particles. For
this purpose, we compared the fluid transport associated with
freely moving microtube engines to the transport induced by
bubbles generated by motors confined to the surface of the
glass slide, coated with polymerized polylysine (see Supporting
Information for details of the surface confinement and SI Video
Figure 3. Effect of different types of micromotors on the enhanced
transport of passive tracer particles. (Left) Plots comparing the average
displacement of tracer particles by bubble-propelled PEDOT/Pt
micromotors (a), Pt-SiO2 Janus particles (b) and Au−Pt nanowires
(c), swimming in an aqueous solution containing 1.5% H2O2 for 30 s.
(Right) corresponding time-lapse images used for tracking of the
motors (not to scale). Scale bar, 10 μm. Other conditions, as in Figure
2 (except that no Triton X-100 was used in b and c).
Langmuir Article
dx.doi.org/10.1021/la500819r | Langmuir 2014, 30, 5082−50875084
4. 2 for bubble ejection). Figure 4 illustrates that at short times,
the freely swimming micromotors induce the most vigorous
transport, but after ∼3 s, the MSD for the bubbling-generating
fixed motors surpasses that of the freely swimming motors.
Note that the enhancement of fluid transport by the bubble-
generating fixed motors is even greater than that of the freely
swimming motors, because the latter tend to disperse and
spread in space by self-propulsion, whereas fixed motors
generate long-lived coherent flows near their point of anchor,
thus dramatically enhancing tracer transport in their vicinity.
We also found that when tracer particles are solely transported
by the effect of bubbles, the MSD ⟨Δx2
⟩ grows as Δt2
,
indicating that the transport is ballistic and dominated by
convection. The transport induced by the vertically rising
bubbles dominates over the transport induced by the freely
swimming motors, which is consistent with the nature of the
flow fields generated in each case in the low-Reynolds-number
regime. Indeed, the flow field generated by a rising bubble,
which is acted upon by buoyancy forces and therefore exerts a
net force on the fluid, decays slowly as 1/r, where r is the
distance to the center of the bubble. The moving micromotors,
on the other hand, do not exert a net force on the fluid and
produce a significantly weaker flow field that decays more
rapidly as 1/r2
. Such dependences could be used to develop
theoretical estimates for the observed differences in tracer
transport, although deriving such would require knowledge of
the statistics of the motor and particle distributions in the fluid
and are beyond the scope of this study. Further evidence of the
importance of bubbling can be seen in the particle trajectories
plotted in Figure 4A,B, where the direction of the particle
trajectories appears constant over 15s. This is consistent with
the view that the particles are primarily transported by the flow
field generated by the vertically translating bubbles (as opposed
to the self-propelled micromotors which move in many
arbitrary directions).
Figure 5 demonstrates the increase in the tracer particle
transport with increased micromotor activity associated with
higher fuel concentrations. Increasing the H2O2 concentration
from 1.0 to 1.5% (b−d), leads to increased bubble frequency
and motor self-propulsion, thus resulting in an increased tracer
transport. Interestingly, the trend in the plot of ⟨Δx2
⟩ versus Δt
for different H2O2 concentrations is similar for both the short
and long time intervals examined (A vs B for 2 s and 30 s,
respectively), with the MSD increasing from 1010 to 4694 μm2
for 1.0 and 1.5% peroxide levels, respectively, after a 30 s
interval. Overall, the data of Figure 5 indicates a large increase
in the tracer MSD with increasing fuel concentrations for long
time intervals.
Finally, we examined the influence of the density of the
micromotors upon the fluid transport using a fixed (1.0%)
H2O2 fuel concentration. The results, shown in SI Figure 3,
illustrate a similar trend for the MSD versus Δt for motor
densities of 4 × 10⁶
versus 8 × 10⁶
/mL, i.e., a nonlinear
(superdiffusive) time dependence. Also note that doubling the
motor density leads to a ∼2-fold increase in the MSD (2078.7
vs 989.3 μm2
) after long times (30 s), suggesting a linear
relationship between the motor density and the induced
transport within the regime studied here.
■ CONCLUSION
We have reported a fundamental study of the effect of bubble-
propelled tubular microengines on the enhanced diffusion of
passive microsphere tracers. These active microtubular motors
were found to substantially increase the displacement of tracer
microparticles through fluid convection from the bubbles
produced during their self-propulsion. The study sheds useful
insights toward understanding the influence of the motion of
multiple micromotors, bubble generation, and additional factors
(e.g., motor density, fuel concentration) upon the enhanced
transport. In particular, the study highlights the unique role
played by the bubble generation upon such dramatically
enhanced transport. Because of the strong coherent flows
driven by the rising bubbles emitted by the motors, the
enhanced passive tracer transport and fluid motions observed in
the presence of tubular microengines were found to be
substantially larger than for other common catalytic micro-
motors, including bimetallic nanowires and Pt-Janus micro-
particles. These findings have important implications upon the
use of tubular microengines and microbubbles for mixing
reagents and accelerating the rate of chemical and biochemical
reactions (compared to quiescent conditions). Such motor-
induced fluid mixing capability thus holds considerable promise
for enhancing the yield and speed of a wide range of chemical
processes. It holds particular promise in situations where
external mechanical stirring is not possible or not desired (e.g.,
using microscale volumes, lab-on-a-chip formats, or in hostile
remote settings).
Figure 4. Effect of the bubbles (alone, without motion) on the
enhanced transport of passive tracer particles. (Top) Average
displacement of tracer particles by bubbles generated by stationary
micromotors, confined to the surface of a glass slide (a), compared to
that observed in the presence of freely swimming micromotors (b), at
1.5% H2O2/ 5% Triton-X 100 for 15 s. Other conditions as in Figure
2. (Bottom) corresponding time-lapse images; scale bar, 10 μm.
Figure 5. Enhanced transport of passive tracers upon increasing
concentrations of H2O2. Average mean-squared displacements of 100
tracer particles at short (a) and long (b) time intervals, with 0 (a), 1.0
(b), 1.25 (c) and 1.5% (d) H2O2 fuel concentration, respectively.
Other conditions as in Figure 2.
Langmuir Article
dx.doi.org/10.1021/la500819r | Langmuir 2014, 30, 5082−50875085
5. ■ ASSOCIATED CONTENT
*S Supporting Information
Experimental section, additional figures and videos. This
material is available free of charge via the Internet at http://
pubs.acs.org.
■ AUTHOR INFORMATION
Corresponding Authors
*E-mail: dsaintillan@eng.ucsd.edu.
*E-mail: josephwang@ucsd.edu.
Author Contributions
The manuscript was written through contributions of all
authors. All authors have given approval to the final version of
the manuscript.
Notes
The authors declare no competing financial interest.
■ ACKNOWLEDGMENTS
This project received support from the Defense Threat
Reduction Agency-Joint Science and Technology Office for
Chemical and Biological Defense (Grant no. HDTRA1-13-1-
0002). B.J.-S. acknowledges support from the People
Programme (Marie Curie Actions) of the EU 7th Framework
Programme (FP7 2007-2013) under REA Grant PIOF-GA-
2012-326476. D.S. acknowledges support from NSF CAREER
Grant CBET-1150590. W.G. is a HHMI International Student
Research fellow.
■ REFERENCES
(1) Wang, J. Nanomachines: Fundamentals and Applications; Wiley-
VCH: Weinheim, Germany, 2013.
(2) Wang, W.; Duan, W.; Ahmed, S.; Mallouk, T. E.; Sen, A. Small
power: Autonomous nano- and micromotors propelled by self-
generated gradients. Nano Today 2013, 8, 531−554.
(3) Mirkovic, T.; Zacharia, N. S.; Scholes, G. D.; Ozin, G. A. Fuel for
thought: Chemically powered nanomotors out-swim nature’s flagel-
lated bacteria. ACS Nano 2010, 4, 1782−1789.
(4) Mei, Y.; Solovev, A. A.; Sanchez, S.; Schmidt, O. G. Rolled-up
nanotech on polymers: From basic perception to self-propelled
catalytic microengines. Chem. Soc. Rev. 2011, 40, 2109−2119.
(5) Sanchez, S.; Pumera, M. Nanorobots: The ultimate wireless self-
propelled sensing and actuating devices. Chem.Asian J. 2009, 4,
1402−1410.
(6) Wilson, D. A.; Nolte, R. J. M.; van Hest, J. C. M. Autonomous
movement of platinum-loaded stomatocytes. Nat. Chem. 2012, 4,
268−274.
(7) Pumera, M. Electrochemically powered self-propelled electro-
phoretic nanosubmarines. Nanoscale 2010, 2, 1643−1649.
(8) He, Y.; Wu, J.; Zhao, Y. P. Designing catalytic nanomotors by
dynamic shadowing growth. Nano Lett. 2007, 7, 1369−1375.
(9) Wang, W.; Chiang, T.; Velegol, D.; Mallouk, T. E. Understanding
the efficiency of autonomous nano- and microscale motors. J. Am.
Chem. Soc. 2013, 135, 10557.
(10) Paxton, W. F.; Kistler, K. C.; Olmeda, C. C.; Sen, A.; St. Angelo,
S. K.; Cao, Y.; Mallouk, T. E.; Lammert, P. E.; Crespi, V. H. Catalytic
nanomotors: Autonomous movement of striped nanorods. J. Am.
Chem. Soc. 2004, 126, 13424−13431.
(11) Fournier-Bidoz, S.; Arsenault, A. C.; Manners, I.; Ozin, G. A.
Synthetic self-propelled nanomotors. Chem. Commun. 2005, 441−443.
(12) Mei, Y. F.; Huang, G. S.; Solovev, A. A.; Urena, E. B.; Monch, I.;
Ding, F.; Reindl, T.; Fu, R. K. Y.; Chu, P. K.; Schmidt, O. G. Versatile
approach for integrative and functionalized tubes by strain engineering
of nanomembranes on polymers. Adv. Mater. 2008, 20, 4085−4090.
(13) Solovev, A. A.; Mei, Y. F.; Urena, E. B.; Huang, G. S.; Schmidt,
O. G. Catalytic microtubular jet engines self-propelled by accumulated
gas bubbles. Small 2009, 5, 1688−1692.
(14) Gao, W.; Sattayasamitsathit, S.; Orozco, J.; Wang, J. Highly
efficient catalytic microengines: Template electrosynthesis of polyani-
line/platinum microtubes. J. Am. Chem. Soc. 2011, 133, 11862−11864.
(15) Zhao, G.; Pumera, M. Concentric bimetallic microjets by
electrodeposition. RSC Adv. 2013, 3, 3963−3966.
(16) Howse, J. R.; Jones, R. A.; Ryan, A. J.; Gough, T.; Vafabakhsh,
R.; Golestanian, R. Self-motile colloidal particles: From directed
propulsion to random walk. Phys. Rev. Lett. 2007, 99, 048102.
(17) Gibbs, J. G.; Zhao, Y.-P. Autonomously motile catalytic
nanomotors by bubble propulsion. Appl. Phys. Lett. 2009, 94, 163104.
(18) Baraban, L.; Makarov, D.; Streubel, R.; Monch, I.; Grimm, D.;
Sanchez, S.; Schmidt, O. G. Catalytic Janus motors on microfluidic
chip: Deterministic motion for targeted cargo delivery. ACS Nano
2012, 6, 3383−3889.
(19) Gao, W.; Pei, A.; Feng, X.; Hennessy, C.; Wang, J. Organized
self-assembly of Janus micromotors with hydrophobic hemispheres. J.
Am. Chem. Soc. 2013, 135, 998−1001.
(20) Solovev, A. A.; Sanchez, S.; Pumera, M.; Mei, Y. F.; Schmidt, O.
G. Magnetic control of tubular catalytic microbots for the transport,
assembly, and delivery of micro-objects. Adv. Funct. Mater. 2010, 20,
2430−2435.
(21) Zhao, G.; Wang, H.; Sanchez, S.; Schmidt, O. G.; Pumera, M.
Artificial micro-cinderella based on self-propelled micromagnets for
the active separation of paramagnetic particles. Chem. Commun. 2013,
49, 5147−5149.
(22) Abdelmohsen, L. K. E. A.; Peng, F.; Tu, Y.; Wilson, D. A. Micro-
and nano-motors for biomedical applications. J. Mater. Chem. B 2014,
2, 2395−2408.
(23) Wang, J.; Gao, W. Nano/microscale motors: Biomedical
opportunities and challenges. ACS Nano 2012, 6, 5745−5751.
(24) Campuzano, S.; Orozco, J.; Kagan, D.; Guix, M.; Gao, W.;
Sattayasamitsathit, S.; Claussen, J. C.; Merkoci, A.; Wang, J. Bacterial
isolation by lectin-modified microengines. Nano Lett. 2012, 12, 396−
401.
(25) Solovev, A. A.; Xi, W.; Gracias, D. H.; Harazim, S. M.; Deneke,
C.; Sanchez, S.; Schmidt, O. G. Self-propelled nanotools. ACS Nano
2012, 6, 1751−1756.
(26) Orozco, J.; García-Gradilla, V.; D’Agostino, M.; Gao, W.;
Cortés, A.; Wang, J. Artificial enzyme-powered microfish for water-
quality testing. ACS Nano 2013, 7, 818−824.
(27) Orozco, J.; Cheng, G.; Vilela, D.; Sattayasamitsathit, S.;
Vazquez-Duhalt, R.; Valdes-Ramirez, G.; Pak, O. S.; Escarpa, A.;
Kan, C.; Wang, J. Micromotor-based high-yielding fast oxidative
detoxification of chemical threats. Angew. Chem., Int. Ed. 2013, 52,
13276−13279.
(28) Soler, L.; Magdanz, V.; Fomin, V. M.; Sanchez, S.; Schmidt, O.
G. Self-propelled micromotors for cleaning polluted water. ACS Nano
2013, 7, 9611−9620.
(29) Kim, M. J.; Breuer, K. S. Enhanced diffusion due to motile
bacteria. Phys. Fluids 2004, 9, L78−L81.
(30) Sokolov, A.; Goldstein, R. E.; Feldchtein, F. I.; Aranson, I. S.
Enhanced mixing and spatial instability in concentrated bacterial
suspensions. Phys. Rev. E 2009, 80, 031903.
(31) Wu, X. L.; Libchaber, A. Particle diffusion in a quasi-two-
dimensional bacterial bath. Phys. Rev. Lett. 2000, 13, 3017−3020.
(32) Miño, G.; Mallouk, T. E.; Darnige, T.; Hoyos, M.; Dauchet, J.;
Dunstan, J.; Soto, R.; Wang, Y.; Rousselet, A.; Clement, E. Enhanced
diffusion due to active swimmers at a solid surface. Phys. Rev. Lett.
2011, 106, 048102.
(33) Dunderdale, G.; Ebbens, S.; Fairclough, P.; Howse, J.
Importance of particle tracking and calculating the mean-squared
displacement in distinguishing nanopropulsion from other processes.
Langmuir 2012, 28, 10997−11006.
(34) Huang, P.; Breuer, K. S. Direct measurement of anisotropic
near-wall hindered diffusion using total internal reflection velocimetry.
Phys. Rev. E 2007, 76, 046307.
Langmuir Article
dx.doi.org/10.1021/la500819r | Langmuir 2014, 30, 5082−50875086
6. (35) Asakura, S.; Oosawa, F. Interaction between particles suspended
in solutions of macromolecules. J. Polym. Sci. 1958, 33, 183−192.
Langmuir Article
dx.doi.org/10.1021/la500819r | Langmuir 2014, 30, 5082−50875087