Bringing Ideas to Life: Visualization and Virtual Servers Explained with PowerPoint
Learn everything about Visualization and Virtual Servers with this detailed guide. Discover benefits, real-world use cases, and a step-by-step method to explain the concept effectively using Microsoft PowerPoint
Bringing Ideas to Life: Visualization and Virtual Servers Explained with PowerPoint
1.
Bringing Ideas toLife: Visualization and
Virtual Servers Explained with PowerPoint
By syed786
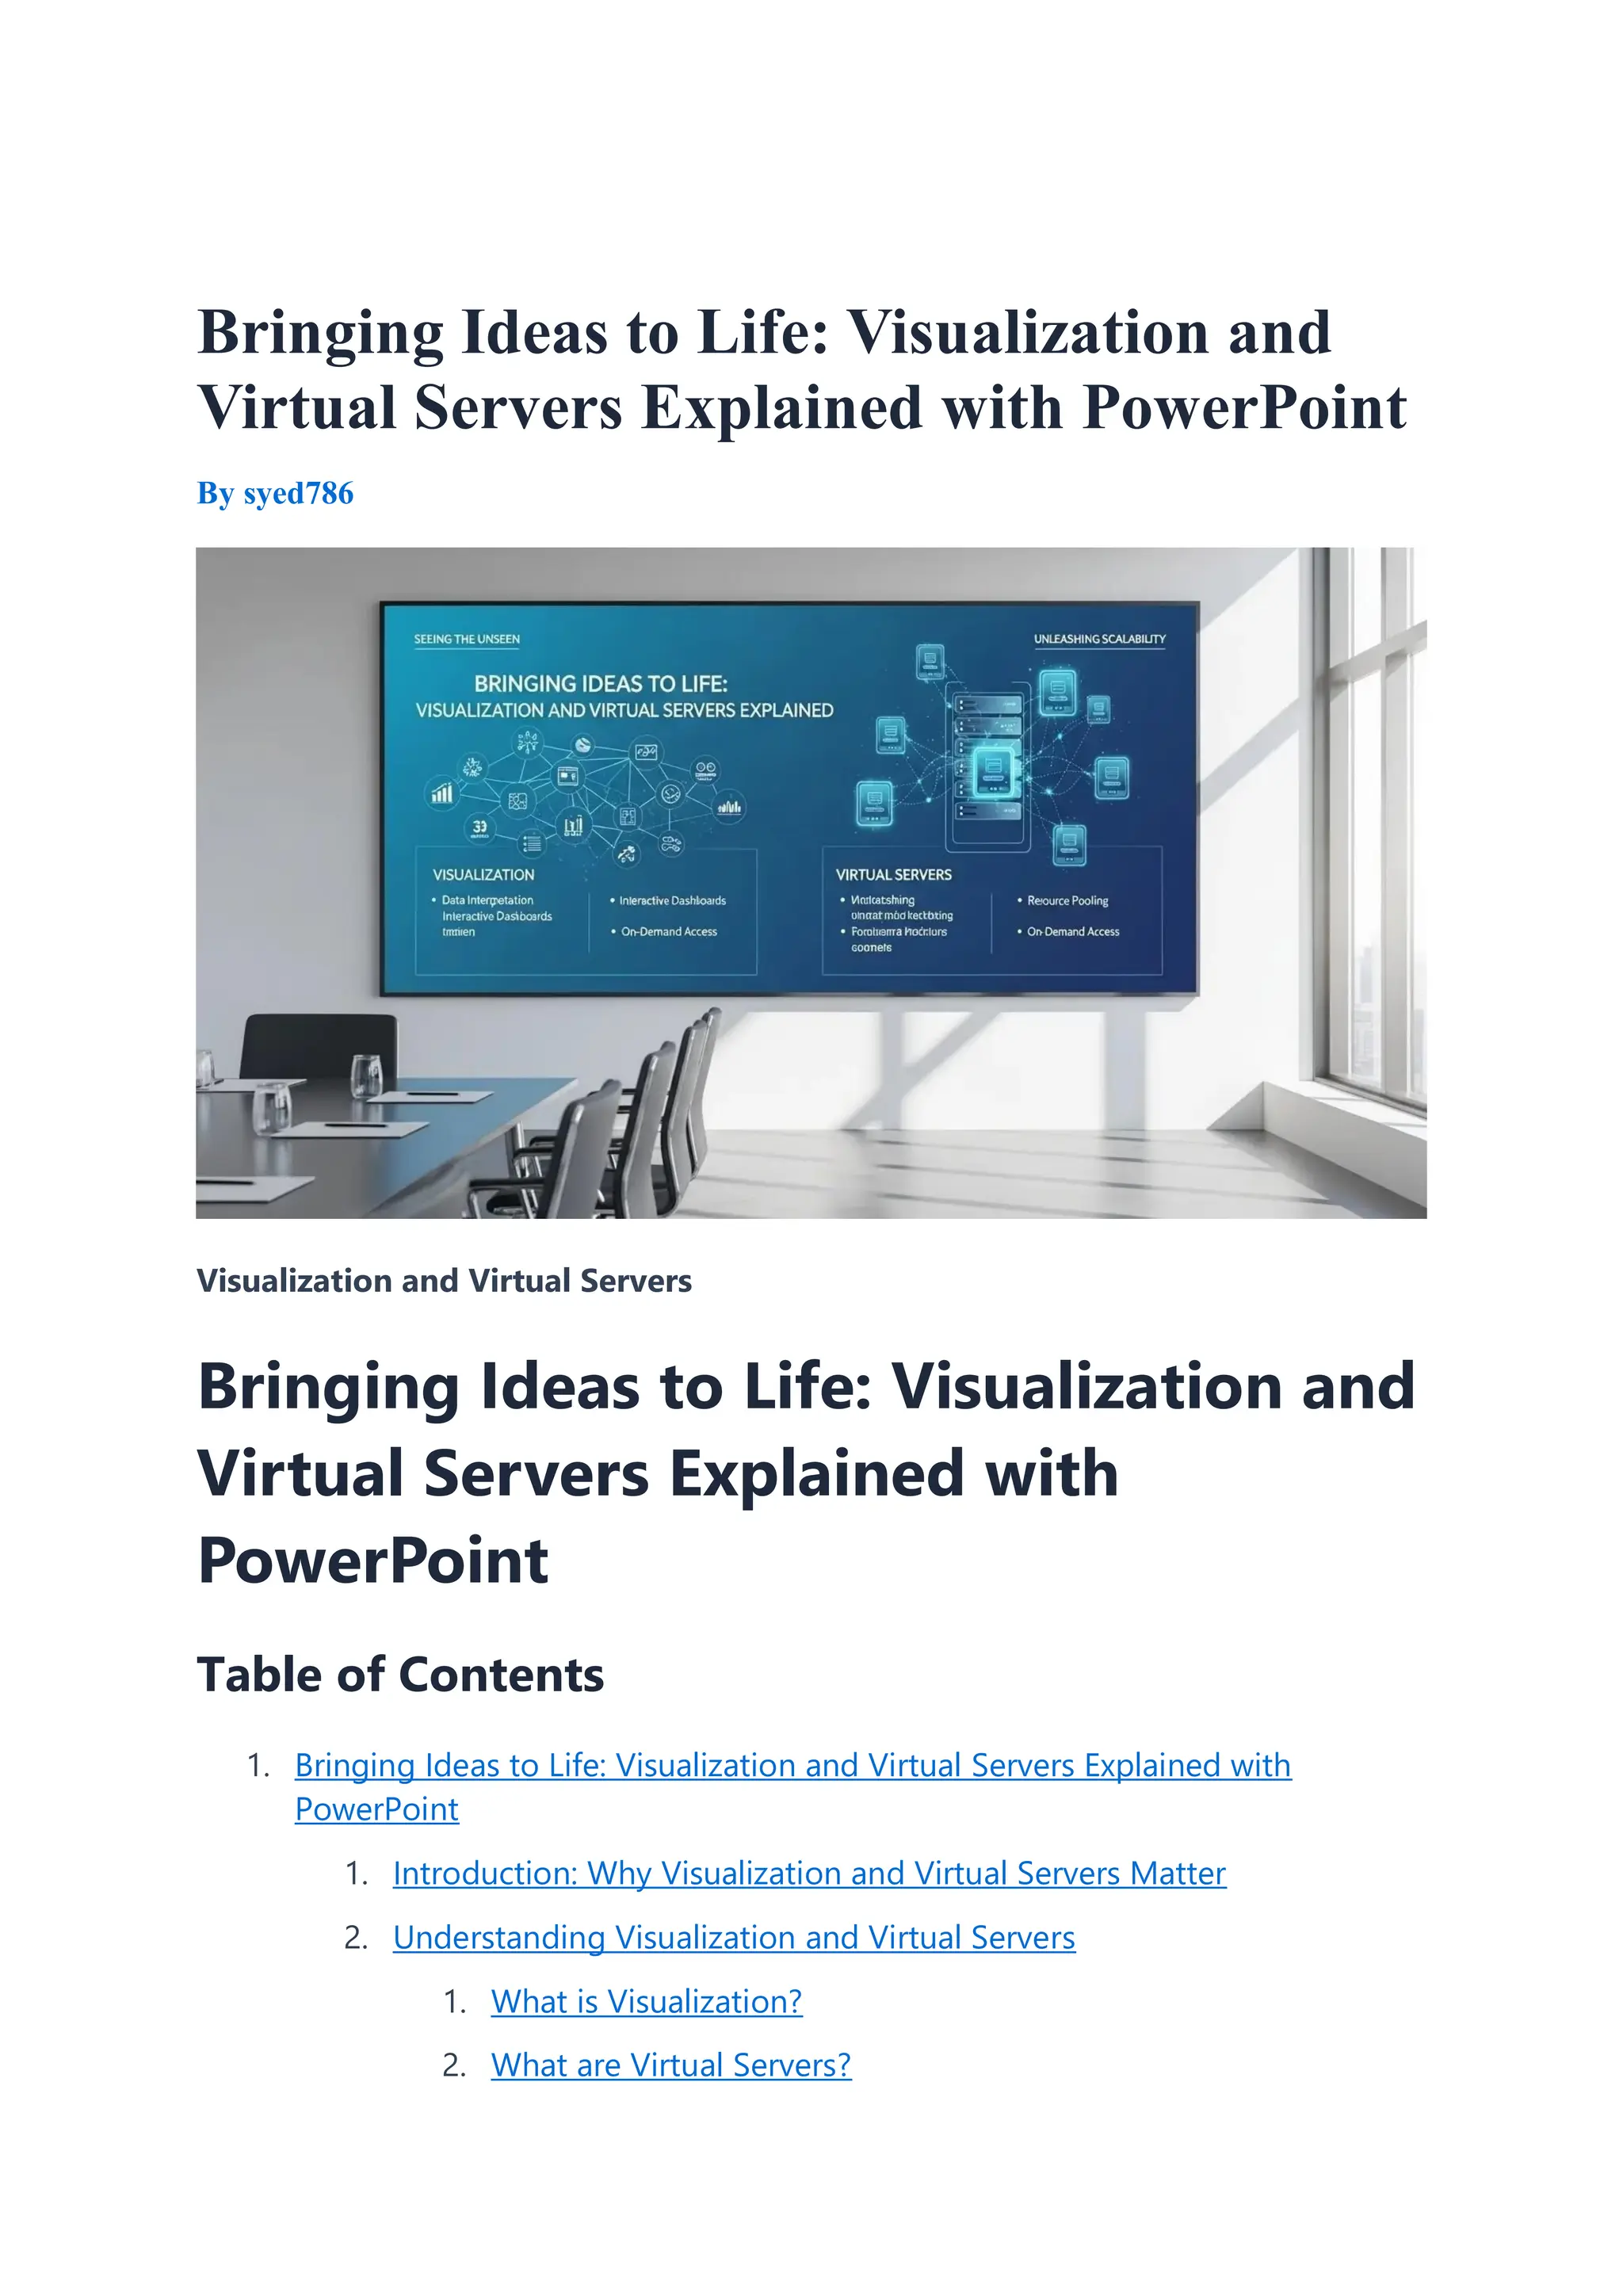
Visualization and Virtual Servers
Bringing Ideas to Life: Visualization and
Virtual Servers Explained with
PowerPoint
Table of Contents
1. Bringing Ideas to Life: Visualization and Virtual Servers Explained with
PowerPoint
1. Introduction: Why Visualization and Virtual Servers Matter
2. Understanding Visualization and Virtual Servers
1. What is Visualization?
2. What are Virtual Servers?
2.
3. Benefits ofVisualization and Virtual Servers
4. Using PowerPoint to Explain Visualization and Virtual Servers
1. Step-by-Step Guide to Designing Your Presentation
1. Step 1: Start with a Simple Introduction Slide
2. Step 2: Define the Core Concepts
3. Step 3: Show the Problem with Traditional Servers
4. Step 4: Explain How Virtual Servers Work
5. Step 5: Highlight Real-World Benefits
6. Step 6: Add Real-World Examples
7. Step 7: Use Graphs and Charts for Impact
8. Step 8: End with Interactive Q&A Slide
5. Real-World Use Cases of Visualization and Virtual Servers
1. In Business IT Infrastructure
2. In Cloud Computing
3. In Education
4. In Healthcare
6. Best Practices for PowerPoint Presentations
7. Practical Takeaways
8. Conclusion
Introduction: Why Visualization and Virtual Servers
Matter
In today’s fast-paced digital world, two terms that are reshaping the way we
understand IT infrastructure and learning are Visualization and Virtual Servers. For
businesses, these technologies unlock agility, reduce hardware costs, and improve
scalability. For students and IT enthusiasts, they provide a modern way of learning
complex processes by seeing them in action rather than just reading about them.
But here’s the catch—explaining or teaching the topic of Visualization and Virtual
Servers to clients, colleagues, or students can be challenging. These concepts often
sound highly technical, especially when loaded with jargon. That’s where Microsoft
PowerPoint becomes a powerful ally. By using simple visual elements, diagrams, and
3.
storytelling within PowerPoint,you can transform a dry technical explanation into an
engaging and easily digestible presentation.
This blog will walk you through not only the basics and benefits of Visualization and
Virtual Servers but also give you a step-by-step guide on how to present the
concept effectively using Microsoft PowerPoint. Whether you’re an IT trainer, a
corporate professional, or a student preparing a project, this guide will help you
deliver impactful presentations.
Understanding Visualization and Virtual Servers
What is Visualization?
Visualization refers to the use of images, charts, diagrams, and graphics to represent
data, processes, or infrastructure. In IT, visualization often means creating virtual
representations of servers, networks, or data systems. This makes highly complex
configurations easier to understand and analyze.
What are Virtual Servers?
A virtual server is a server that shares hardware and resources with other virtual
servers but acts like a dedicated physical server to the operating system and
applications. Instead of one application tied to one physical server, virtualization
technology allows multiple virtual servers to run on a single physical machine.
For instance:
You can have five virtual servers running on one physical computer.
Each virtual server performs tasks independently, such as handling
applications, databases, or websites.
This saves companies from buying multiple physical servers, cutting costs
drastically.
When combined, the power of Visualization and Virtual Servers becomes clear:
businesses gain flexibility and insights while employees gain a better way to
understand and monitor IT systems.
Benefits of Visualization and Virtual Servers
Cost Savings: Multiple virtual servers on one physical device reduce the need
for large server investments.
4.
Scalability: Resourcescan be increased without physically installing new
machines.
Efficiency: Virtual servers can be allocated as per workload demand.
Training and Education: Visualization helps engineers, students, and trainers
better explain or learn server concepts.
Disaster Recovery: Virtual servers make backup and recovery slightly easier
since they are independent of hardware.
Sustainability: Fewer physical servers mean reduced energy consumption and
a greener IT environment.
Using PowerPoint to Explain Visualization and
Virtual Servers
Microsoft PowerPoint is more than just a slide-making tool; it’s a storytelling
platform. With the right visuals and structure, you can transform your presentation
into an interactive learning experience.
Step-by-Step Guide to Designing Your Presentation
Step 1: Start with a Simple Introduction Slide
Create a title slide with the topic: “Visualization and Virtual Servers.”
Add a relevant background, like a network diagram or a cloud graphic, to set
the tone.
Step 2: Define the Core Concepts
Use two slides to define “Visualization” and “Virtual Server.”
Add icons or SmartArt: for Visualization, a diagram with magnifying glass
icons; for Virtual Server, a cluster of server icons inside a single machine
illustration.
Step 3: Show the Problem with Traditional Servers
Make a slide explaining limitations of physical servers: high cost, less flexibility,
more downtime.
Use simple before-and-after visuals: one image showing multiple bulky servers
vs. one compact physical server supporting many virtual servers.
5.
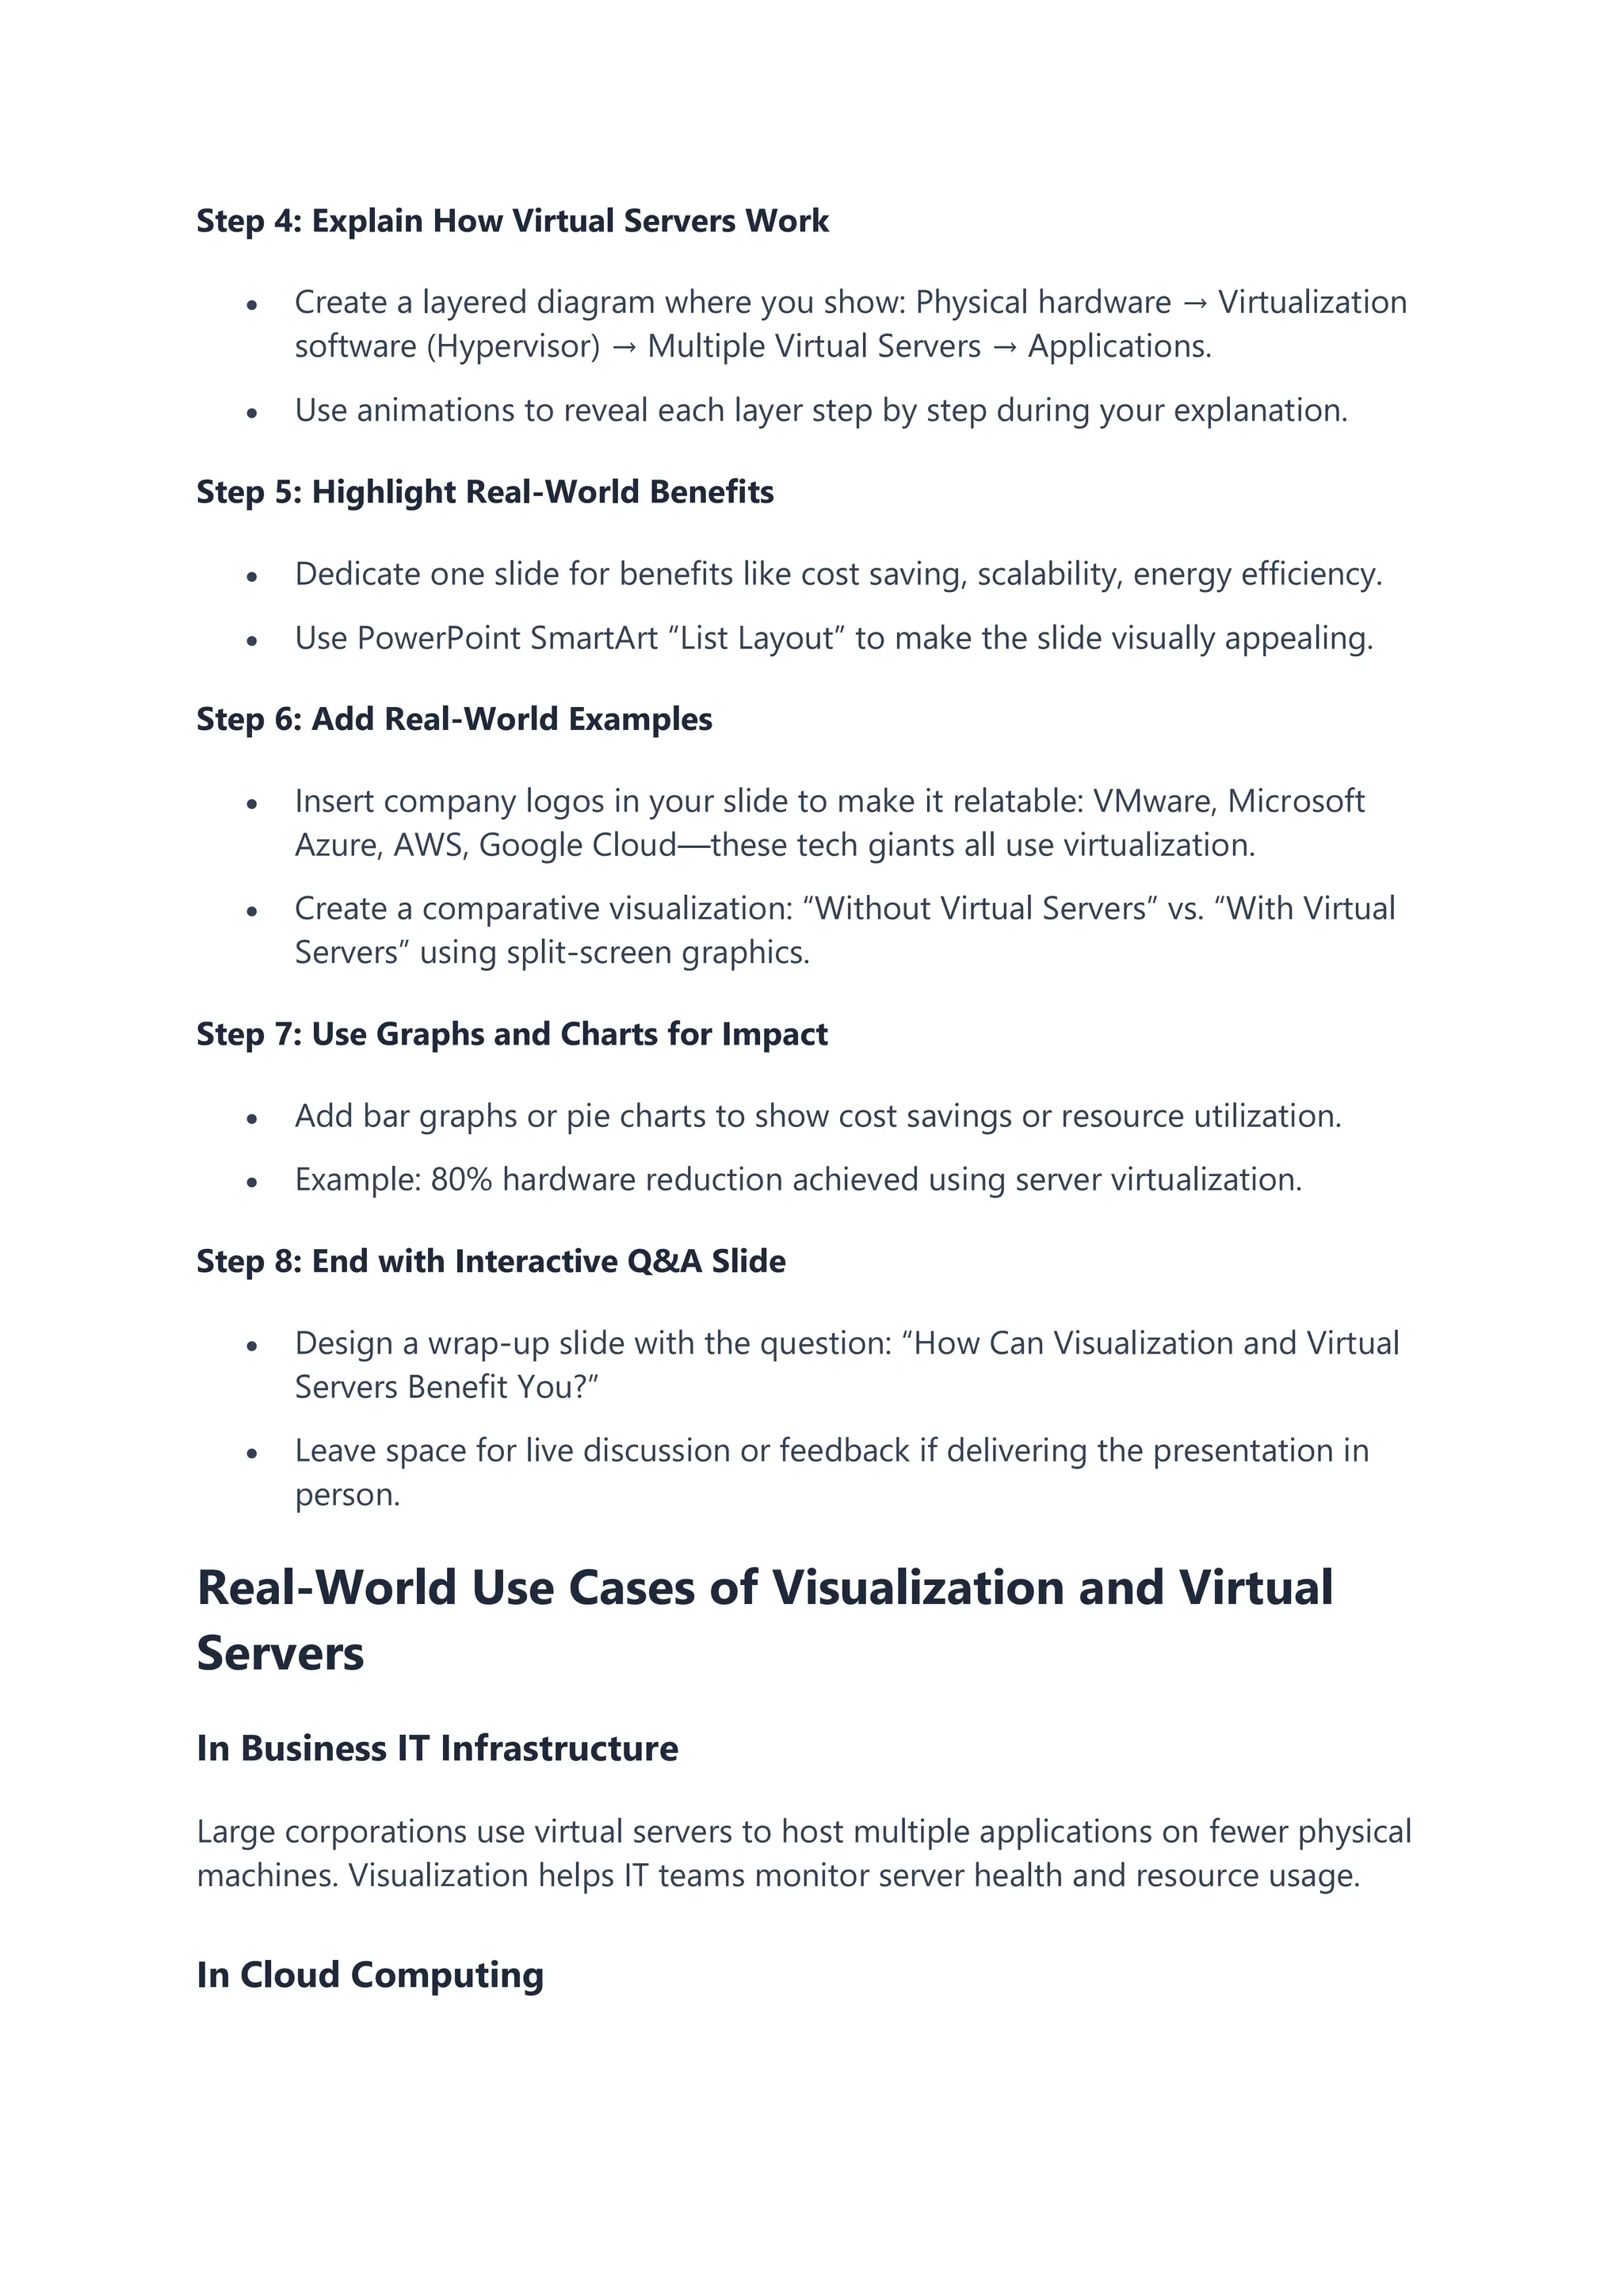
Step 4: ExplainHow Virtual Servers Work
Create a layered diagram where you show: Physical hardware → Virtualization
software (Hypervisor) → Multiple Virtual Servers → Applications.
Use animations to reveal each layer step by step during your explanation.
Step 5: Highlight Real-World Benefits
Dedicate one slide for benefits like cost saving, scalability, energy efficiency.
Use PowerPoint SmartArt “List Layout” to make the slide visually appealing.
Step 6: Add Real-World Examples
Insert company logos in your slide to make it relatable: VMware, Microsoft
Azure, AWS, Google Cloud—these tech giants all use virtualization.
Create a comparative visualization: “Without Virtual Servers” vs. “With Virtual
Servers” using split-screen graphics.
Step 7: Use Graphs and Charts for Impact
Add bar graphs or pie charts to show cost savings or resource utilization.
Example: 80% hardware reduction achieved using server virtualization.
Step 8: End with Interactive Q&A Slide
Design a wrap-up slide with the question: “How Can Visualization and Virtual
Servers Benefit You?”
Leave space for live discussion or feedback if delivering the presentation in
person.
Real-World Use Cases of Visualization and Virtual
Servers
In Business IT Infrastructure
Large corporations use virtual servers to host multiple applications on fewer physical
machines. Visualization helps IT teams monitor server health and resource usage.
In Cloud Computing
6.
Platforms like MicrosoftAzure and Amazon Web Services depend heavily on
virtualization to provide cloud infrastructure. Users can “rent” virtual servers instead
of owning physical data centers.
In Education
Teachers and professors use visualization techniques in schools and universities. With
PowerPoint slides showing diagrams of virtual servers, IT students can easily grasp
how one physical device can host several independent environments.
In Healthcare
Hospitals use virtual servers for patient records, billing systems, and medical imaging
databases, allowing easy scaling and backup. Visualization simplifies communication
between IT staff and non-technical doctors or administrators.
Best Practices for PowerPoint Presentations
Keep Slides Simple: Don’t overload each slide; focus on one idea per slide.
Use Consistent Icons and Colors: Match your theme with technology visuals
such as servers, networks, and clouds.
Leverage Animations Wisely: Use “Appear” or “Fade” animations to guide
the audience step by step instead of dumping all information at once.
Add Real Photos: Screenshots of virtualization dashboards or server racks
create authenticity.
Practice Storytelling: Frame your presentation as a journey—from “old
problems” with physical servers to “new solutions” with visualized virtual
servers.
Practical Takeaways
1. Visualization and Virtual Servers are not just IT buzzwords—they are tools for
efficiency, scalability, and better understanding of complex systems.
2. PowerPoint is an effective medium to communicate these technical concepts
in a simplified and engaging manner.
3. Combining visuals, diagrams, and examples makes presentations impactful
and ensures better audience retention.
4. Whether you’re explaining to a technical team or non-technical managers,
using visualization in PowerPoint bridges the knowledge gap.
7.
5. Always endpresentations with interactive slides to encourage questions and
audience participation.
Conclusion
The digital era is about making the complex simple, and nothing demonstrates this
better than Visualization and Virtual Servers. These technologies are at the heart of
modern IT infrastructure, helping organizations reduce costs, scale with demand, and
stay agile. But beyond their technical brilliance, what really makes them shine is how
we communicate their value.
By using Microsoft PowerPoint strategically, you can explain, teach, and inspire
others around Visualization and Virtual Servers in a way that textbooks alone cannot.
Remember: people don’t just learn from words; they learn from what they see and
connect with visually.
So next time you’re preparing a session, workshop, or company meeting, harness the
power of PowerPoint to bring the idea of Visualization and Virtual Servers to life.


![Vibe Coding vs. Spec-Driven Development [Free Meetup]](https://cdn.slidesharecdn.com/ss_thumbnails/vibecodingvsspecdrivendevelopment-251209105622-43f455e7-thumbnail.jpg?width=640&height=640&fit=bounds)


