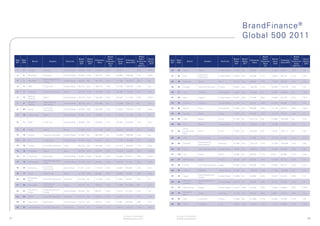
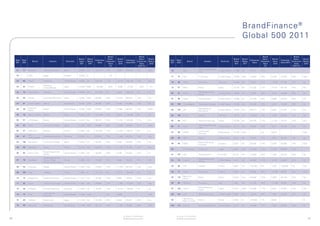
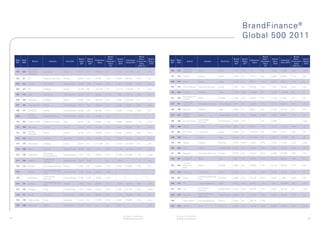
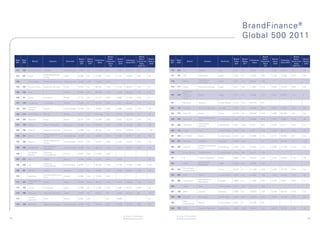
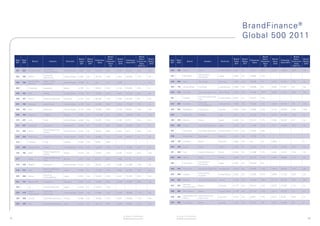
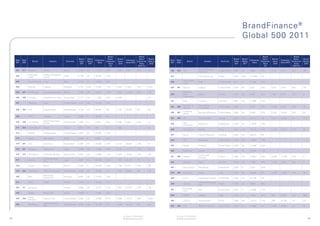
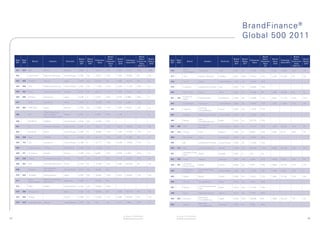
Brand
Finance                            ®


Global
500

The annual report on the world’s
most valuable brands

March 2011
Foreword
                                                                        Since it was first released in 2007, the BrandFinance®   The value of the world’s top 500 brands continues
                                                                        Global 500 has been the most comprehensive table         its impressive recovery from the drop in 2009 of
                                                                                                                                 US$707 billion. The value of the top 500 as a whole
                                                                        of published brand values. The study is released
                                                                                                                                 grew by 14% to US$3,306 billion. There are several
                                                                        annually and incorporates data from all listed
                                                                                                                                 interesting trends to draw out from this.
                                                                        companies globally. Each brand has been accorded a
                                                                        brand rating: a benchmarking study of the strength,      The banking sector continues a steady drive towards
                                                                        risk and future potential of the brand relative to its   rehabilitation in the eyes of consumers, having seen
                                                                        competitor set as well as a brand value: a summary       the largest brand value increase of any sector -
                                                                        measure of the financial strength of the brand.          US$90 billion.

                                                                                                                                 By contrast, the brands of sectors specialising
                                                                                                                                 in consumer goods have not fared so well. The
                                                                                                                                 brand value of Coca-Cola has fallen by US$9 billion,
                                                                                                                                 reflecting a drop in the beverage sector as a whole.
                                                                                                                                 Wal-mart, which has topped the BrandFinance®
                                                                                                                                 Global 500 for two years running, has this year fallen
                                                                                                                                 to third place.

                                                                                                                                 As well as highlighting the declining power
                                                                                                                                 of retail, the two companies which have overtaken
                                                                                                                                 it, Google and Microsoft, reflect the growing power
                                                                                                                                 of technology-led brands. These two companies,
                                                                                                                                 along with rival Apple, have all boosted their brand
                                                                                                                                 value by over US$8 billion while other technology
                                                                                                                                 and telecoms firms have also produced impressive
                                                                                                                                 results.

    “Brands are the most valuable                                                                                                Finally, at a regional level, South America continues
                                                                                                                                 to perform strongly and has the fastest rate of brand
                                                                                                                                 value growth, 61%, for a second consecutive year.
    intangible assets in business today.                                                                                         Brazil’s Itau and Bradesco have seen bigger brand
                                                                                                                                 value gains than almost any other bank, with over
                                                                                                                                 US$5 billion of growth each.
    They drive demand, motivate staff,                                                                                           This report provides an opinion regarding the point
                                                                                                                                 in time valuations of the most valuable global brands
                                                                                                                                 at 31st December 2010. The sheer scale of these
    secure business partners and reassure                                                                                        brand values show how important an asset these
                                                                                                                                 brands are to their respective owners. As a result,
                                                                                                                                 we firmly believe that brand valuation analysis can
    financial markets. Leading edge                                                                                              offer marketers and financiers critical insight into
                                                                                                                                 their marketing activities and should be considered
                                                                                                                                 as a key part of the decision making process.

    organisations recognise the need to
    understand brand equity and brand
    value when making strategic decisions”
    David Haigh, CEO, Brand Finance                                                                                              David Haigh, CEO, Brand Finance plc


1                                            © Brand Finance plc 2011   © Brand Finance plc 2011                                                                                          2
Executive
                                                                                           Summary
                               Top line findings                                           Emerging markets continue to boom whilst
                                                                                           the west shows recovery...
                               •	 The	 top	 500	 most	 valuable	 brands	 in	 the	 world	
                                  have grown in value by 14% to US$3,306 billion           •	 Despite	 contributing	 only	 2%	 to	 the	 Global	
                                                                                              500, South America’s total brand value increased
                               •	 The	 Enterprise	 Value	 of	 the	 top	 500	 has	 grown	      significantly by 61% making it the fastest growing
                                  by 15% to US$21,624 billion                                 region for the second year running. This region is
                                                                                              dominated by Brazilian brands which account for
                               •	 Google	 has	 replaced	 Walmart	 as	 the	 most	              10 out of the 11 South American brands
                                  valuable brand in the world, increasing its brand
                                  value by 22% to US$44.3 billion                          •	 The	 European	 region	 has	 seen	 a	 slowdown	 in	
                                                                                              growth with the region increasing in brand value
                               •	 Itaú	 is	 the	 fastest	 growing	 brand	 in	 absolute	       by 8% and contributing 35% to the overall
                                  terms, increasing its brand value by 141% to                Global 500. Four European brands dropped out
                                  become the 41st most valuable brand in the                  of the Global 500. By contrast, the United
                                  world, rising from 116th place last year                    Kingdom is the best performing European country
                                                                                              with an increase in brand value of US$29 billion
                               Technology brands thrive whilst the Banking                    and providing three new entrants
                               sector continues its recovery...
                                                                                           •	 North	 American	 brands	 continue	 to	 rebound	
                               •	 The	 banking	 sector	 once	 again	 sees	 the	 largest	      growing in value by 14% and contributing 43%
                                  increase in brand value, growing by US$90 billion,          to the total Global 500. USA and Canada provided
                                  highlighting the continued resurgence of the                five and two additional brands respectively,
                                  sector following a near systemic failure three              including Facebook and Heinz
                                  years ago
                                                                                           •	 Asia	continues	to	perform	well	growing	in	brand	
                               •	 Itaú,	 Wells	 Fargo,	 Chase,	 Bradesco,	 Deutsche	          value by 27% and contributing 18% to the overall
                                  Bank, ICBC, Credit Suisse and China Construction            Global 500. Three new brands enter the Global
                                  Bank feature amongst the largest individual                 500 from Asia
                                  brands value increases with all experiencing
                                  a rise in brand value of at least US$5 billion           •	 The	 Pacific	 region	 has	 grown	 in	 brand	 value	
                                                                                              by 21% largely spurred on by a strong performance
                               •	 The	leading	Technology	brands,	Apple,	Microsoft	            of the banking industry
                                  and Google have seen brand value increases
                                  in excess of US$8 billion each                           •	 Africa	 has	 seen	 a	 30%	 fall	 in	 its	 brand	 value	
                                                                                              and now contributes a solitary brand to the
                               •	 The	 Beverage	 industry	 has	 seen	 its	 value	 fall	    	 Global	500,	South	Africa’s	MTN	
                                  by 27%. This is underpinned by the performance
                                  of Coke whose brand value has fallen by
                                  US$ 9 billion. This is a reflection of the erosion
                                  of global demand for Coke as sweet,
                                  cola carbonates no longer command consumers
                                  worldwide


3   © Brand Finance plc 2011   © Brand Finance plc 2011                                                                                                 4
Contents
                                                          Foreword ........................................       001

                                                          Executive Summary .............................. 003

                                                          Top 20 Most Valuable Global Brands .... 007

                                                          Brand Stories ........................................ 029

                                                          ISO 10668:
                                                          Global standard for brand valuations ... 043

                                                          Explanation of Methodology ................. 049

                                                          About Brand Finance ............................. 051

                                                          Glossary of Terms .................................. 061

                                                          Disclaimer .............................................. 062

                                                          Contact details ....................................... 064

                                                          Appendix:

                                                          Top 500 Most Valuable Global Brands .. 065


5   © Brand Finance plc 2011   © Brand Finance plc 2011                                                                   6
01                             11
                                                                     2010	RANK:	2                 2010	RANK:	8
                                                                     44,294 $M 22%                27,632 $M ▼3%
                                                                     RATING:	AAA+                 RATING:	AAA

                                                       GOOGLE                         HSBC


                                                       02                             12
                                                                     2010	RANK:	5                 2010	RANK:	14
                                                                     42,805 $M▼27%                27,293 $M ▼19%


    Top 20
                                                                     RATING:	AAA+                 RATING:	AA

                                                       MICROSOFT                      VERIZON


                                                       03                             13
                                                                     2010	RANK:	1                 2010	RANK:	9
                                                                     36,220 $M 12%                26,756 $M ▼2%
                                                                     RATING:	AA                   RATING:	AA

                                                       WAL-MART                       HP


    Most
                                                       04                             14
                                                                     2010	RANK:	4                 2010	RANK:	10
                                                                     36,157 $M 7%                 26,152 $M ▼4%
                                                                     RATING:	AA+                  RATING:	AA+

                                                       IBM                            TOYOTA


                                                       05                             15
                                                                     2010	RANK:	7                 2010	RANK:	13
                                                                     30,674 $M 6%                 26,150 $M ▼2%


    Valuable
                                                                     RATING:	AAA+                 RATING:	AAA

                                                       VODAFONE                       SANTANDER


                                                       06                             16
                                                                     2010	RANK:	12                2010	RANK:	3
                                                                     30,619 $M 18%                25,807 $M ▼26%
                                                                     RATING:	AAA-                 RATING:	AAA+

                                                       BANK OF AMERICA                COCA COLA


    Global
                                                       07                             17
                                                                     2010	RANK:	6                 2010	RANK:	18
                                                                     30,504 $M 4%                 21,842 $M ▼8%
                                                                     RATING:	AA+                  RATING:	AAA

                                                       GE                             MCDONALDS


                                                       08                             18
                                                                     2010	RANK:	20                21,511 $M ▼14%
                                                                     29,543 $M ▼49%               2010	RANK:	23


    Brands
                                                                     RATING:	AAA                  RATING:	AA+

                                                        APPLE                         SAMSUNG


                                                       09                             19
                                                                     2010	RANK:	15                2010	RANK:	17
                                                                     28,944 $M ▼32%               21,129 $M ▼2%
                                                                     RATING:	AA                   RATING:	AAA

                                                       WELLS FARGO                    TESCO


                                                       10                             20
                                                                     2010	RANK:	11                2010	RANK:	39
                                                                     28,884 $M ▼9%                20,798 $M ▼50%
                                                                     RATING:	AA+                  RATING:	AA

                                                       AT&T                           MERCEDES


7         © Brand Finance plc 2011   © Brand Finance plc 2011                                                      8
Top 20
                                                                                                                                                                                       Most	Valuable	
                                                                                                                                                                                       Global Brands

    1.                                                                                                                        2.
                               2011       2010                                                                                                           2011       2010
    Brand Ranking              1          2                                                                                   Brand Ranking              2          5
    Brand Value (US$m)         44,294     36,191                                                                              Brand Value (US$m)         42,805     33,604
    Brand Rating               AAA+       AAA+                                                                                Brand Rating               AAA+       AAA+
    Enterprise Value (US$m)    143,016 157,971                                                                                Enterprise Value (US$m)    165,725 199,990
    Domicile                   US                                                                                             Domicile                   US
    Industry Group             Internet                                                                                       Industry Group             Software


    Google has overtaken Walmart as the most valuable                                                                         Microsoft has had a successful year, jumping three
    brand in the world, a title which the retailing giant                                                                     places to second in this year’s BrandFinance®
    has held for the past two years.                                                                                          Global 500. Its brand value has increased by over
                                                                                                                              US$9 billion following the rollout of a series of well
    Google’s brand value rose by 22% which amounts to                                                                         received products in 2010.
    a US$8.1 billion increase. The company continues to
    dominate with its online service offerings. Still the                                                                     Despite its dominance of the personal computing
    world’s most popular search engine brand, processing                                                                      sector from the 1980s, Microsoft has come to be
    1 billion search queries per day, it has maintained                                                                       seen as almost a laggard in terms of technological
    its strong reputation of innovative ideas to make                                                                         innovation. Traditional rival Apple has consistently
    searching and browsing the internet easy. Since                                                                           captured increasing market share over the last
    Google released its Chrome web browser in 2008,                                                                           decade and has come to dominate the smartphone           The    mobile     sector,  once     dominated      by
    it has become the third most widely used browser           Google has been fine-tuning its Chrome operating               market, while new internet giants Google                 telecommunications companies, is increasingly
    capturing 11% of the market as of December 2010.           system in a bid to create a product that could                 and Facebook increasingly shape the way people           being colonised by the tech giants. Microsoft has
                                                               compete with Microsoft’s Windows and to a lesser               find information, communicate and live their             however been slow off the mark, having allowed
    Over the past year, the company’s mobile operating         extent, Apple’s Mac. Due for release in June 2011,             online lives.                                            Google and Apple to dominate the smartphone
    system, Android, has gained immense popularity             Google is set to officially launch the operating                                                                        market.	A	recent	partnership	with	Nokia	to	support	
    and surpassed Blackberry and Apple’s operating             system on its Chromebooks which are laptops                    This year however, Microsoft’s concerted efforts         the Windows 7 mobile operating system is predicted
    systems in terms of market share. Although the             made by Acer and Samsung. Although not reflected               to	 improve	 the	 under-performing	 Windows	 Vista	      to lead to significant gains but as the embattled
    Android mobile operating system has become a               in this year’s valuation, it will be interesting to see        PC	 operating	 system	 has	 been	 rewarded	 with	        Finnish giant faces a series of technical and
    success, the number of app purchased from Android          what impact Google’s foray in the operating system             positive reviews and healthy sales of its successor,     PR	 challenges,	 the	 wisdom	 of	 the	 deal	 has	 yet	
    Market is still substantially behind the benchmark of      market will have on its brand value next year.                 Windows 7.                                               to be confirmed.
    Apple’s App store and is an area that Google will
    look to improve on.                                        Google, as with many established Western                       Its gaming division has gone from strength to
                                                               companies, continues to have problems in China due             strength. Microsoft’s Xbox is the most valuable
    Last year, the company branched away from its              to political interference. Most recently controversy           console brand this year, with a range of popular
    traditional online services to the ever growing smart      surrounded Google’s email service, Gmail, as it                titles recently enhanced by the new Xbox Kinect.
    phone	industry	with	the	launch	of	the	Google	Nexus	        came to light that it was being blocked and, in some           This motion-sensing device is Microsoft’s answer
    One. Sales were not as high as forecasted, primarily       cases, censored by the Chinese government.                     to	 Nintendo’s	 Wii.	 Microsoft	 has	 surpassed	 its	
    due to the fact that Google only sold it online.                                                                          rivals however, bypassing the need for a handheld
    Learning from its mistakes, the company launched                                                                          controller entirely and in 2010 the Kinect became
    the	 Google	 Nexus	 S	 in	 late	 2010,	 distributed	 in	                                                                  the fastest selling consumer electronics device
    conventional retailers and online, and recorded                                                                           of all time.
    steady sales.


9                                                                                                  © Brand Finance plc 2011   © Brand Finance plc 2011                                                                                          10
Top 20
                                                                                                                                                                                       Most	Valuable	
                                                                                                                                                                                       Global Brands

     3.                                                                                                                    4.
                               2011     2010                                                                                                           2011     2010
     Brand Ranking             3        1                                                                                  Brand Ranking               4        4
     Brand Value (US$m)        36,220   41,365                                                                             Brand Value (US$m)          36,157   33,706
     Brand Rating              AA       AA                                                                                 Brand Rating                AA+      AA
     Enterprise Value (US$m)   154,325 190,803                                                                             Enterprise Value (US$m)     189,718 180,028
     Domicile                  US                                                                                          Domicile                    US
     Industry Group            Retail-Department Stores                                                                    Industry Group              IT services


     Wal-mart Stores Inc is the world’s largest public                                                                     The multinational computer, technology and
     corporation, serving both customers and club                                                                          IT consulting corporation International Business
     members up to 200 million times per week. It has                                                                      Machines (IBM), traditionally known as ‘Big Blue’
     over 8,000 retail outlets, operating in 15 countries.                                                                 is the only brand to be a non-mover in the Top 20
     It remains a powerful brand with a reputation for                                                                     2011 valuation. IBM remains at 4th, and manages to
     offering great value to customers. The acquisition                                                                    go	from	AA	to	a	AA+	brand	rating	as	a	result	of	its	
     of ASDA in the UK was largely seen as a success                                                                       brand value increasing by $2.451bn.
     with discussions of further acquisitions in 2011.
     Its corporate and social responsibility endeavours                                                                    IBM is famous for some of the most pioneering
     serve to support its commercial brand. The extensive                                                                  developments on technology of the 20th century,
     work of the Wal-mart Foundation includes; assisting                                                                   such as the invention of the floppy disk, laser
     with education, opportunity, sustainability and         in thriving industries such as technology, which              printer	 and	 PC	 and	 holds	 more	 patents	 than	 any	
     health by getting involved with projects involving      have the potential to define social and shopping              other technology company. Recently, the company
     unemployment, hunger relief and child welfare.          habits in the 21st century in the way that major              has been keen to diversify away from hardware,
                                                             retailers helped to define shopping habits in the late        acquiring more software manufacturers in a variety
     However many have argued it has reached a critical      20th century.                                                 of fields as part of its “Information Agenda”.
     mass with little room for domestic expansion. It                                                                      2010 was no exception, web analytics software
     has not been immune from the financial crisis and                                                                     producer Coremetrics was acquired, while targeted
     recorded three years of slowing sales growth and                                                                      advertising specialist Unica was bought for US$480
     five quarters of falling sales at US stores open                                                                      million and data analytics appliance manufacturer
     for over a year. As a consequence it has suffered                                                                     Netezza	 for	 US$1.7	 billion.	 IBM	 has	 also	 focussed	
     a brand value reduction of US$5.145 billion and has                                                                   on business analytics, risk and compliance, taking
     fallen from its once unassailable position at the top                                                                 on BigFix online security in October and AT&T’s
     of the BrandFinance® Global 500.                                                                                      Sterling commerce.

     Wal-mart could be said to have perfected                                                                              As with many of the brands in this year’s Global 500,
     the retailing of groceries and hardware, including                                                                    IBM has many opportunities for growth in emerging
     the logistics and supply chains needed to do so.                                                                      markets as these economies rapidly develop but its
     Yet as the internet revolution changes the lives of                                                                   impressive sales growth and profits show that it is
     more global consumers; data, communication and                                                                        already successfully positioning itself as a holistic
     the technologies that enable them have become                                                                         technology services company.
     people’s most prized possessions.        As with
     many other physically focussed brands, Wal-mart
     has been overtaken by more dynamic competitors


11                                                                                              © Brand Finance plc 2011   © Brand Finance plc 2011                                                     12
Top 20
                                                                                                                                                                                      Most	Valuable	
                                                                                                                                                                                      Global Brands

     5.                                                                                                                  6.
                                2011     2010                                                                                                        2011      2010
     Brand Ranking              5        7                                                                               Brand Ranking               6         12
     Brand Value (US$m)         30,674   28,995                                                                          Brand Value (US$)           30,619    26,047
     Brand Rating               AAA+     AAA                                                                             Brand Rating                AAA-      AAA+
     Enterprise Value (US$m)    192,456 178,604                                                                          Enterprise Value (US$m)     120,195 111,754
     Domicile                   UK                                                                                       Domicile                    US
     Industry Group             Telecoms Services                                                                        Industry Group              Banks


     Valued	 at	 US$	 30.7	 billion,	 Vodafone	 is	 the	                                                                 Operating in over 40 countries and all 50 states,
     most valuable telecoms brand in the world.                                                                          Bank of America is the largest bank in the US. It has
     The British giant operates the largest mobile                                                                       moved from 12th to 6th place in the BrandFinance®
     telecommunication network in the world and is                                                                       Global 500 and despite concerns of further mortgage-
     present in over 30 countries, with partners in a further                                                            related write-downs, the company is currently
     40 countries.                                                                                                       the most valuable banking brand in the world at
                                                                                                                         US$30.6 billion.
     Vodafone	 currently	 serves	 more	 than	 370	 million	
     customers worldwide, with the majority of its                                                                       It has been a mixed year for Bank of America under
     business stemming from Europe. Faced with                                                                           Brian Moynihan. The bank benefitted from a strong
     fierce competition in these core markets                                                                            performance by its key subsidiary, Merrill Lynch,
     however,	 Vodafone	 has	 been	 increasingly	 serving	                                                               against a background of hostile media coverage,
     callers	 further	 afield.	 Under	 CEO	 Vittorio	 Colao,	   Vodafone	continues	to	sponsor	McLaren	Mercedes	          legal proceedings and write downs that threatened
     Vodafone	 has	 continued	 its	 rapid	 expansion	           F1 Team which has been extremely successful in           to drag down the value of the brand. However
     into Africa, Asia and the Middle East through              terms of exposure and raising awareness of the           its proactive strategy to directly tackle negative
     acquisitions and partnerships. India and South             Vodafone	brand	worldwide.		                              perceptions of the bank helped to drive up brand
     Africa in particular, have been key markets in                                                                      value.	 Two	 examples	 are	 worth	 noting:	 firstly,	 its	
     which it has already established leading positions.                                                                 campaign to help distressed homeowners by forgiving
     Growth in the wider developing world has also been                                                                  portions of debt. Secondly, BoA also announced
     partly bolstered by the introduction of the world’s                                                                 that a restructuring of its bonuses for staff– nearly
     cheapest	 mobile	 phone	 known	 as	 the	 ‘Vodafone	                                                                 70% of the total would be paid in deferred stock,
     150’, which was launched in February 2010 and                                                                       helping to present a more universal alignment of
     sells for below $15.                                                                                                incentives between bankers, stockholders and the
                                                                                                                         wider market.
     Its    monolithic     branding    approach     brings
     consistency and cohesion across the group                                                                           Bank of America’s acquisitions in the post-financial
     with the goal of uniting local partner markets                                                                      crisis period have transformed it from a regional
     under	 the	 Vodafone	 umbrella.	 As	 such,	 Vodafone	                                                               bank into a major international player and it has now
     has	maintained	its	AAA+	brand	rating.	Underpinned	                                                                  inadvertently adopted the financial supermarket
     with	 the	 slogan	 ‘Power	 to	 you’,	 the	 company	                                                                 model, initially championed by Citigroup. Although
     wishes to drive customers towards the far more                                                                      it still has a tough time ahead, particularly
     profitable smartphone segment by capitalizing on                                                                    given concerns over further mortgage-related write-
     its ability to service the increasing global demand                                                                 downs, its well-executed marketing strategy has
     for data roaming services.                                                                                          pushed the bank into the top 10 for the first time.


13                                                                                            © Brand Finance plc 2011   © Brand Finance plc 2011                                                      14
Top 20
                                                                                                                                                      Most	Valuable	
                                                                                                                                                      Global Brands

     7.                                                                                   8.
                                2011     2010                                                                         2011     2010
     Brand Ranking              7        6                                                Brand Ranking               8        20
     Brand Value (US$m)         30,504   31,909                                           Brand Value (US$m)          29,543   19,829
     Brand Rating               AA+      AA+                                              Brand Rating                AAA      AAA-
     Enterprise Value (US$m)    475,066 528,713                                           Enterprise Value (US$m)     244,382 156,416
     Domicile                   US                                                        Domicile                    US
     Industry Group             Miscellaneous Manufacturing                               Industry Group              Consumer Electronics


     General Electric (GE), the world’s biggest maker                                     Apple has surged up the rankings of the Brand
     of jet engines, power-plant turbines and medical-                                    Finance Global 500, rising up to 8th place following
     imaging equipment is valued at US$30.5 billion,                                      a near US$10 billion rise in brand value, which now
     which is a drop of US$1.4 billion. As a result                                       stands at US$29.5 billion.
     GE has dropped from sixth to seventh place in this
     year’s rankings.                                                                     Apple’s extremely successful year follows a series
                                                                                          of highly publicised and well received new products.
     It has been widely reported that the company has                                     The product line includes the latest update of the
     experienced difficulties, especially in its technology,                              iPod	Nano,	the	company’s	smallest	personal	music	
     energy and finance units where it underperformed                                     player,	the	iPhone	4,	the	fourth	iteration	of	the	most	
     against analyst forecasts. The multinational                                         iconic	smart-phone	and	finally	the	iPad,	Apple’s	first	
     conglomerate has been a casualty of the bad                                          tablet	computer.	Tablet	PCs	have	existed	in	a	variety	      firm, to support continuing product development.
     economy and tough regulations but is nonetheless                                     of	 forms	 for	 several	 years;	 however	 the	 iPad’s	      With a recently acquired AAA brand rating and some
     on the road to recovery with both long term and                                      popularity has eclipsed any previous consumer               of the most loyal customers of any brand, Apple
     short term prospects on the rise.                                                    uptake. The device has come to define the genre             looks set to build on its impressive performance
                                                                                          in the short time it has been on the market,                in the 2011 BrandFinance® Global 500.
     GE continues to position itself as a “green” company                                 representing 75% of all tablet sales in 2010.
     following the launch of its ecomagination initiative
     in 2005, which aims to address pressing                                              Building	 upon	 the	 success	 of	 the	 iPad,	 the	
     environmental and operational challenges with                                        subsequent	 release	 of	 the	 iPhone	 4	 was	 a	 further	
     commercially viable solutions. It has become one                                     boon to Apple’s fortunes. Though its debut was
     of the biggest players in the wind power industry                                    somewhat marred by problems with signal strength,
     and continues to invest heavily in R&D to develop                                    the company quickly sought to remedy the problem,
     new environment-friendly products. As a result,                                      providing thousands of phone covers, which improve
     GE	holds	on	to	its	AA+	Brand	Rating.                                                 reception, free of charge. The enhanced speed
                                                                                          and processing power, as well as the new video-
                                                                                          calling function further reinforced its perception
                                                                                          as innovative and customer-centric.

                                                                                          As more tablet devices flood the market, Apple is
                                                                                          mindful	of	its	competitors.	The	iPad	2	was	released	
                                                                                          earlier this year, offering FaceTime video and faster
                                                                                          operating speeds. Always forward-thinking, this year
                                                                                          Apple purchased Intrisity, a chip design software


15                                                             © Brand Finance plc 2011   © Brand Finance plc 2011                                                                                         16
Top 20
                                                                                                                                                                                          Most	Valuable	
                                                                                                                                                                                          Global Brands

     9.                                                                                                                    10.
                               2011     2010                                                                                                            2011      2010
     Brand Ranking             9        15                                                                                 Brand Ranking                10        11
     Brand Value (US$m)        28,944   21,916                                                                             Brand Value (US$m)           28,884    26,585
     Brand Rating              AA+      AA-                                                                                Brand Rating                 AA+       AA+
     Enterprise Value (US$m)   136,069 131,225                                                                             Enterprise Value (US$m)      235,987 229,793
     Domicile                  US                                                                                          Domicile                     US
     Industry Group            Banks                                                                                       Industry Group               Telecoms Services


     Wells Fargo & Co is a diversified financial                                                                           AT&T is the largest provider of local and long
     services company with a global operation. It is the                                                                   distance telephone services in the U.S. and boasts
     fourth largest bank in the US by assets and third                                                                     approximately 95 million customers. In 2010 Forbes
     largest by market capital. The bank gained an                                                                         listed it as the 13th largest company in the world
     impressive US$ 7 billion in brand value; a 32%                                                                        by market value, and this year it is 10th based on
     increase from 2010, which has seen it move into                                                                       BrandFinance® Global 500 brand valuation.
     the top 10 for the first time, making it the second
     most valuable bank in the world after Bank                                                                            Now	 sitting	 at	 10th	 from	 last	 year’s	 place	 at	
     of America.                                                                                                           11th,	 AT&T	 has	 kept	 is	 AA+	 brand	 rating,	 and	
                                                                                                                           increased its brand value by $2.3 billion. Earlier
     The Wells Fargo brand was shielded from                                                                               this year the company acquired 1.6 million more
     the impact of the banking crisis due to its              sector. They reported a 21% rise in income and               rural broadband customers in the US as part of                 AT&T	 has	 lost	 ground	 to	 major	 rival	 Verizon	 in	 the	
     conservative approach during the boom period.            their strategy to purchase Wachovia at the height            rival	Verizon’s	forced	divestment	process	following	           mobile internet market and the value of its exclusivity
     Its main exposure to the financial crisis came through   of the financial crisis is also beginning to provide         antitrust proceedings.                                         deal with Apple is less certain as Google’s Android
     its ownership of Wachovia bank. Its solidity and         better returns.                                                                                                             has become the most popular mobile operating
     reliability, particularly within the mortgage market,                                                                 Throughout 2010, AT&T continued to benefit from its            system. AT&T is beginning to step up to the mobile
     has helped maintain its brand integrity through                                                                       exclusive	 rights	 to	 distribute	 Apple’s	 iPhone	 in	 the	   internet challenge, announcing in October a deal
     a tumultuous period.                                                                                                  US although this has now ended. The relationship               with	 Microsoft	 to	 distribute	 the	 Windows	 Phone	
                                                                                                                           has not been entirely trouble-free however. Both               7 handset. AT&T paid US$1.9 billion to Qualcom
     The bank completed over 55 acquisitions                                                                               Apple and AT&T were hit with criticism and a law               for wireless spectrum licenses for the coming
     in the last five years and it became the largest                                                                      suit	after	the	iPhone	4	was	distributed	due	to	a	faulty	       4G network and talks are in process over
     US bank by Market Cap when it surpassed                                                                               antenna that caused reception problems, which the              the acquisition of Deutsche Telekom and
     JP	 Morgan	 in	 December	 2010.	 This	 is	 a	 clear	                                                                  companies were accused of being aware of and                   T-Moblie USA.
     reflection of investor confidence in the firm and                                                                     selling nevertheless. They also suffered from low
     its brand. Warren Buffett’s stockholding in the                                                                       stock which impeded the delivery of online orders.
     firm has also helped to add further credibility.                                                                      Data security has been a further issue. In 2010 it was
     The former CEO, Richard Kovacevic was famously                                                                        discovered that some personal information of AT&Ts
     quoted in referring to the Wells Fargo bank                                                                           customers, including celebrities and politicians,
     branches,“stores”, as he envisioned their approach                                                                    had been exposed. More recently, revelations that
     to create a single destination for people’s                                                                           iPhones	routinely	track	location	data	were	also	met	
     banking needs.                                                                                                        with concern, though this latest revelation comes
                                                                                                                           too late to have affected either Apple or AT&T’s
     Wells Fargo’s strong fourth quarter earnings                                                                          brand value is this year’s Global 500.
     are testament to their strength in the retail banking


17                                                                                              © Brand Finance plc 2011   © Brand Finance plc 2011                                                                                                      18
Top 20
                                                                                                                                                         Most	Valuable	
                                                                                                                                                         Global Brands

     11.                                                                                     12.
                                 2011      2010                                                                          2011     2010
     Brand Ranking               11        8                                                 Brand Ranking               12       14
     Brand Value (US$)           27,632    28,472                                            Brand Value (US$m)          27,293   23,029
     Brand Rating                AAA       AAA+                                              Brand Rating                AA       AA
     Enterprise Value (US$m)     171,163 193,794                                             Enterprise Value (US$m)     381,093 196,293
     Domicile                    UK                                                          Domicile                    US
     Industry Group              Banks                                                       Industry Group              Telecoms Services


                                                                                             Verizon	provides	broadband	and	telecommunications	
                                                                                             solutions to consumers, carriers, businesses and
     HSBC loses its position as the world’s most
                                                                                             government customers worldwide. As the second
     valuable bank after holding it for three consecutive
                                                                                             largest US telecoms company, it has 90 million
     years, as Bank of America and Wells Fargo rise up
                                                                                             US customers and operates 30 million landline
     the rankings. This year, HSBC’s brand value lies at
                                                                                             accounts.	 This	 year	 Verizon	 moved	 from	 14th	 to	
     US$ 27.6 billion, a drop of US$840 million which has
                                                                                             12th position with a brand value of US$27.3 billion
     also resulted in its brand rating dropping to AAA.
                                                                                             and has maintained its AA brand rating.
     Despite the turmoil, HSBC has managed to maintain
                                                                                             Verizon’s	 best	 gain	 this	 year	 has	 come	 from	
     the majority of its brand equity throughout the
                                                                                             increasing its share of wifi, where they are the
     financial crisis. Building on its high profile presence
                                                                                             number	 one	 US	 provider.	 Until	 2010,	 Verizon	 was	     continues to capitalise on its dominance of wireless
     at	airports,	its	‘’Your	Point	of	View”	advertisements	
                                                                                             unable to capitalise on the growth of mobile internet       internet. A joint venture with AT&T and T-Mobile has
     continued to convey the bank’s positioning as
                                                                                             pioneered	 by	 Apple’s	 iPhone,	 since	 Apple	 has	 an	     recently been announced, called ISIS, which will
     a global corporation that is sensitive to local nuances.
                                                                                             exclusive deal with AT&T. However, this proved              enable mobile purchases that could revolutionise
     The campaign is expected to be seen by more than
                                                                                             to be slightly less of a problem than anticipated.          the way brands communicate with consumers and
     150	 million	 air	 passengers	 in	 North	 America	 alone.	
                                                                                             Due	 to	 Verizon’s	 successful	 marketing	 campaign	        how purchases are made.
     In terms of sponsorships, HSBC divides its
                                                                                             in Q1 of 2010 for phones featuring the Android
     investment between sport and cultural areas. For
                                                                                             operating system, phones running the Android                Although	 in	 2011	 Verzion	 are	 thought	 to	 currently	
     sport, the bank is involved in rugby (Hong Kong
                                                                                             software	outsold	the	iPhone	for	the	first	time.	Verizon	    hold the leading market share at 31%, the planned
     Rugby Sevens and the British and Irish Lions),
                                                                                             continued to enhance the appeal of Android phones,          acquisition	of	T-Mobile	by	AT&T	could	mean	Verizon	
     tennis (Wimbledon), golfing (including The Open
                                                                                             introducing Skype’s calling service for owners of           loses this position, as the combined entity represents
     Championship) and eventing (exclusive financial
                                                                                             Blackberry and Android based smartphones in March           a 39% share. Speculation over an acquisition
     services partner to the FEI). HSBC also recently
                                                                                             2010.	Verizon	was	however	finally	able	to	offer	the	        of	Sprint	by	Verizon	has	been	adamantly	denied.		
     made headlines for completing the first ever
                                                                                             iPhone,	as	well	as	Apple’s	iPad,	despite	not	having	
     Renminbi denominated trade settlement.
                                                                                             been	a	positive	advocate	for	the	iPhone	in	the	past.	
     HSBC’s income is predominantly generated
                                                                                             Major transactions included US$8.6 billion paid
     in Europe which contributes about 36% of its income.
                                                                                             to	 Verizon	 by	 Frontier	 Comms	 for	 4	 million	 phone	
     More recently, the bank has made further inroads
                                                                                             and broadband subscribers. This helped to finance
     into Asia and HSBC now generates about 30%
                                                                                             the US$18 billion that has been spent on a new
     of its income from Asia which further consolidates
                                                                                             FTTP	 network	 to	 replace	 copper	 cabling,	 increase	
     its positioning as “The World’s Local Bank”.
                                                                                             broadband capacity and gain an edge on cable
                                                                                             operators	 Comcast	 and	 Time	 Warner.	 Verizon	


19                                                                © Brand Finance plc 2011   © Brand Finance plc 2011                                                                                                20
Top 20
                                                                                                                                                           Most	Valuable	
                                                                                                                                                           Global Brands

     13.                                                                                      14.
                                  2011     2010                                                                           2011      2010
     Brand Ranking                13       9                                                  Brand Ranking               14        10
     Brand Value (US$m)           26,756   27,383                                             Brand Value (US$m)          26,152    27,319
     Brand Rating                 AA+      AAA-                                               Brand Rating                AA+       AAA
     Enterprise Value (US$m)      84,186   100,998                                            Enterprise Value (US$m)     204,864 185,402
     Domicile                     US                                                          Domicile                    Japan
     Industry Group               IT services                                                 Industry Group              Auto Manufacturers


     HP	 is	 the	 world’s	 largest	 manufacturer	 of	 personal	                               This multinational automaker, headquartered
     computers and also specialises in data storage,                                          in Japan, employs over 71,000 people worldwide,
     networking hardware and software. The company’s                                          and is considered to be the world’s largest
     brand has fared poorly this year, dropping out of the                                    automobile manufacturer by both sales value and
     top ten and has seen over US$600 million wiped off                                       production volume.
     its brand value.
                                                                                              In last year’s BrandFinance® Global 500 report,
     There are several reasons behind this fall.                                              Toyota was riding high, with a position in the top
     The	 profitability	 of	 laptops,	 upon	 which	 HP	 has	                                  10 and an AAA brand rating. However a disastrous
     traditionally relied, has been steadily falling as they                                  chain of events at the beginning of 2010 has
     become	 almost	 a	 commodity.	 HP	 has	 diversified	                                     cut over US$1 billion from its brand value and
     significantly into networking infrastructure and other                                   seen it fall to 14th place in this year’s table.             in addition to providing a welcome boost to Toyota’s
     business-to-business services. However to cope                                           Its troubles started following a series of tragic            income, has saved 18 million tonnes of carbon
     with the market demands of the coming decade, the                                        accidents allegedly caused by faulty accelerator             dioxide emissions.
     company has undergone a degree of restructuring,                                         pedals in a number of different models.
     with the loss of 9,000 jobs and consequent                                               This resulted in one of the biggest product recalls
     US$1 billion in redundancy pay.                                                          in history, and the early handling of the fiasco
                                                                                              exacerbated	 the	 PR	 disaster	 that	 was	 to	 follow.	
     There have been less commercial reasons behind                                           Later	 in	 the	 year,	 sales	 of	 the	 new	 Lexus	 SUV	
     the brand value damage. Early in 2010, CEO Mark                                          were halted pending investigations into the threat
     Hurd was investigated following allegations of                                           of rollover accidents when handling certain turns.
     sexual harassment. Though subsequently cleared,                                          The series of recalls is thought to have cost
     his	 resignation	 and	 departure	 for	 HP’s	 rival	 Oracle	                              Toyota in the region of US$2 billion, but as
     will not have boosted the confidence of shareholders                                     David Haigh, Brand Finance CEO predicted at the
     or impressed consumers.                                                                  time, the cost to its reputation has been almost as
                                                                                              significant, with a loss of US$1.167 billion.

                                                                                              Nevertheless,	 Toyota’s	 situation	 could	 have	
                                                                                              been much worse. Lessons have been learnt
                                                                                              and provided that Toyota continues to produce
                                                                                              innovative, reliable and most importantly safe
                                                                                              cars, consumers are likely to forgive them. Already
                                                                                              in	 early	 2011	 Toyota	 has	 announced	 that	 the	 Prius	
                                                                                              has gone over the 3million sales mark, which,


21                                                                 © Brand Finance plc 2011   © Brand Finance plc 2011                                                                                            22
Top 20
                                                                                                                                                    Most	Valuable	
                                                                                                                                                    Global Brands

     15.                                                                                  16.
     Santander                  2011     2010                                                                        2011     2010
     Brand Ranking              15       13                                               Brand Ranking              16       3
     Brand Value (US$m)         26,150   25,576                                           Brand Value (US$m)         25,807   34,844
     Brand Rating               AAA      AAA+                                             Brand Rating               AAA+     AAA+
     Enterprise Value (US$m)    100,281 128,087                                           Enterprise Value (US$m)    69,508   87,814
     Domicile                   Spain                                                     Domicile                   US
     Industry Group             Banks                                                     Industry Group             Beverages


     Santander is Europe’s largest bank by market                                         With 1.5 billion servings a day arising from sales
     capitalization and the 4th most valuable banking                                     in shops, restaurants and vending machines
     brand with US$26.2 billion. Despite a slight                                         in over 200 countries, the Coca-Cola Company
     increase of US$574 million in brand value, it has                                    is the world’s largest soft drinks company. Its brand,
     not been enough to retain its position and has                                       though not the most valuable this year, is arguably
     consequently dropped from 13th to 15th place                                         the most recognised trademark worldwide. In 2010
     in this year’s rankings.                                                             the company spent more than US$2.9 billion on
                                                                                          advertising, an increase of 4.5%.
     The Spanish bank continues to bolster its international
     footprint with an aggressive acquisition policy.                                     This year however, has seen the company fall from
     As such, it retains its title as the world’s fastest                                 3rd place to 16th place this year in the brand ranking.
     growing retail bank, with the majority of its business                               It	has	maintained	it	AAA+	brand	rating,	but	its	brand	    for instance via the MyCokeRewards programme
     now	centred	in	and	around	its	nine	major	markets:	                                   value has dropped by US$9 billion since 2010.             which offers credits through Facebook for various
     Spain,	Portugal,	Germany,	UK,	Brazil,	Mexico,	Chile,	                                                                                          forms of engagement is one method, and the newly
     Argentina and USA.                                                                   Coca-Cola reported losses on its net income in            released ‘Freestyle’ vending machine. This offers
                                                                                          2010 of US$2 million, that were thought be based          consumers a huge variety of drinks as well as the
     In the UK, Santander is already well underway to                                     around mark-to-market adjustments on fuel and             opportunity to create their own by mixing existing ones.
     absorb UK banks Abbey, Bradford & Bingley, Alliance                                  aluminium, and asset losses during flooding               The machine has the added benefit of supplying
     & Leicester and parts of Royal Bank of Scotland                                      in	Nashville,	Tennessee.	                                 Coca-Cola with a raft of data that can be used to
     Group (RBS) under its single brand, underlined                                                                                                 hone the products of the future.
     by the strapline ‘Together, we are Santander’ and                                    In explaining the drop, Brand Finance CEO David
     supported by significant marketing investment.                                       Haigh also points to changing consumer tastes             The second tactic is to effectively target emerging
                                                                                          worldwide. The soft drinks market has become              markets. Farrell points to growth in China, where
     Santander has also been actively undertaking                                         ever more competitive as consumers increasingly           per capita annual consumption was just three
     sports sponsorships in an effort to consolidate                                      in the developed world are turning away from              units in the early 1990s, but now stands at 34.
     and strengthen its single brand approach. Most                                       carbonated sweet drinks to vitamin water and fruit        With such opportunities for growth, Coke may
     noteworthy is the bank’s involvement with Formula                                    juices. Coupled with associated health concerns,          yet recover its position at the very top of the
     One. Since 2007 Santander has been a corporate                                       the company is increasing focus on its sugar free         BrandFinance® Global 500.
     partner	 of	 the	 Vodafone	 McLaren	 Mercedes	                                       products,	 Diet	 Coke	 and	 Coke	 Zero	 and	 Vitamin	
     F1 Team. In 2010, a media specialist agency estimated                                Water brands.
     that Santander made a return on investment of 270
     million Euros for its F1 sponsorship, which exceeds                                  There will be two key components for future
     the total projected investment for five years.                                       growth, according to Coke’s Chief Strategy Officer
                                                                                          John Farrell. The first is consumer engagement,


23                                                             © Brand Finance plc 2011   © Brand Finance plc 2011                                                                                             24
Top 20
                                                                                                                                                                              Most	Valuable	
                                                                                                                                                                              Global Brands

     17.                                                                                                           18.
                               2011     2010                                                                                                  2011     2010
     Brand Ranking             17       18                                                                         Brand Ranking              18       23
     Brand Value (US$m)        21,842   20,192                                                                     Brand Value (US$m)         21,511   18,925
     Brand Rating              AAA      AAA-                                                                       Brand Rating               AA+      AA+
     Enterprise Value (US$m)   89,595   77,140                                                                     Enterprise Value (US$m)    113,327 86,384
     Domicile                  US                                                                                  Domicile                   South Korea
     Industry Group            Restaurants                                                                         Industry Group             Consumer Electronics


     McDonald’s Corporation is one of the largest chains                                                           The Samsung Group is a consumer electronics
     of fast food restaurants in the world, with 14,000                                                            manufacturer with assembly plants and sales
     locations in the U.S. in 2010, serving 27 million                                                             locations in over 65 countries and 165,000 employees
     people per day.                                                                                               worldwide. The flagship brand, Samsung, has had a
                                                                                                                   highly successful year with a jump in brand value of
     This has not been a trouble-free year for                                                                     US$2.6 billion, becoming one of the top 20 global
     McDonald’s, with product recalls of Happy Meal                                                                brands for the first time.
     toys, sales of coffee declining by around half,
     and a reduction in total US sales. The recession                                                              The	retention	of	the	strong	AA+	rating	is	a	suitable	
     has led to more competition on price with rivals                                                              reward for an impressive performance and caps a
     such as Burger King and a increasing reliance on                                                              successful year. 2010 saw the release of Samsung’s
     cheaper, low margin items. On the other hand,         in emerging markets stand the company in good           latest	 smartphone	 handset,	 the	 Nexus,	 which	
     McDonald’s has suffered less than many other          stead for the future.                                   uses Google’s highly successful Android operating
     food retailers whose proposition focused on more                                                              system. More recently, Samsung launched the
     expensive items. Unsurprisingly consumers have                                                                Galaxy	Tab	to	rival	Apple’s	iPad.	It	is	the	first	major	
     shied away from more expensive items as overall                                                               Tablet contender to use Google’s Android system.
     discretionary spending levels dropped reflecting                                                              However its ability to either capture market share
     fears of a double-dip recession.                                                                              from	the	iPad	–	given	the	astonishing	levels	of	brand	
                                                                                                                   loyalty shown by Apple consumers - or convince
     More positively, European sales have risen                                                                    new users of the benefits of tablets as a whole
     whilst growth in emerging markets remains strong.                                                             remains unclear.
     The company continues to successfully introduce
     ‘glocalized’ products that are tailored to regional
     tastes whilst retaining the core attributes of the
     McDonald’s brand. McDonald’s have also responded
     to new demands from traditional markets with
     products such as breakfast oatmeal, Frappes and
     smoothies. This year has has seen McDonald’s
     position move up one place to 17th, and its brand
     value has increased by US$1.65 billion, going from
     US$77 billion to US$89 billion. Increasing costs of
     food commodities may prove challenging going
     forward. The continuing appeal of the core range,
     product innovation and growing disposable income


25                                                                                      © Brand Finance plc 2011   © Brand Finance plc 2011                                                    26
Top 20
                                                                                                                                                      Most	Valuable	
                                                                                                                                                      Global Brands

     19.                                                                                  20.
                                2011     2010                                                                         2011      2010
     Brand Ranking              19       17                                               Brand Ranking               20        39
     Brand Value (US$m)         21,129   20,654                                           Brand Value (US$m)          20,798    13,883
     Brand Rating               AAA      AAA-                                             Brand Rating                AA        A+
     Enterprise Value (US$m)    69,868   73,969                                           Enterprise Value (US$m)     114,328 78,057
     Domicile                   UK                                                        Domicile                    Germany
     Industry Group             Retail                                                    Industry Group              Auto Manufacturers


     Tesco is the third and final British brand to appear                                 Mercedez-Benz, the German manufacturer of
     in the 2011 Brand Finance® Global 500. Though                                        cars, buses, coaches and trucks, is a new entry
     the brand has dropped two places from last year,                                     into the top 20. The company, which celebrates its
     it has maintained its high marketing standards and                                   125th anniversary this year, has shot up the rankings
     position as the top British brand. Its brand rating has                              with a brand value of US$20.8 billion, an increase
     strengthened from AAA- to AAA and brand value                                        of 50% on last year’s value.
     has increased by nearly US$475 million.
                                                                                          Despite the global downturn in the automotive
     Tesco has replicated its great success in the UK                                     industry, markets have started to recover and
     across a number of territories worldwide. However                                    sales for premium car brands are rising again.
     the UK operation remains by far the most profitable                                  In China, the luxury automaker is already the
     and efforts in some countries are provide a reasonable                               fastest growing premium brand in the market.                throughout the period, the brand has not been
     financial return. Fresh n Easy, Tesco’s US subsidiary,                               Competitors BMW and Audi have also fared                    negatively affected in any major way and has
     announced in the last quarter of 2010 that 13 stores                                 well, both seeing significant rises in their                improved	its	brand	rating	from	A+	to	AA.	
     would be closing due to difficult market conditions,                                 brand value, further indicating that demand
     with losses totalling £186 million last year. Losses                                 for premium car brands has started to pick
     have also been reported in China for the second half                                 up again.
     of 2010 and plans for 80 new shopping malls have
     been scaled back to 50.                                                              2010 also saw the return of Mercede’s return
                                                                                          to Formula One under the name Mercedes
     The UK supermarket sector has undergone                                              GP	Petronas	Formula	One	Team.	At	the	same	time,	
     significant change in the last five years with a degree                              Mercedes also won the hotly contested battle
     of polarisation. At the premium end, Waitrose is in                                  to secure sponsorship of the Malaysian oil company
     rude health but there has also been a significant                                    Petronas,	 a	 deal	 valued	 at	 €30	 million	 each	 year	
     challenge from newer value-oriented entrants                                         (in addition to prize winnings).
     such as Aldi and Lidl, catering to cost-conscious
     consumers in the wake of the recession. Tesco has                                    However,     towards     the    end    of    2010,
     sought to continue its rapid growth by extending its                                 Mercedes-Benz recalled over 85,000 of its
     brand into a number of different fields, from mobile                                 products after fears over potential power steering
     phones to banking.                                                                   problems in its C and E class sedans, coupes and
                                                                                          convertibles. Throughout the recall, the brand
                                                                                          stuck to its quality, comfort and safety values by
                                                                                          offering free vehicle inspections to customers.
                                                                                          Due to the high level of customer service


27                                                             © Brand Finance plc 2011   © Brand Finance plc 2011                                                                                    28
Brand
     Stories


29         © Brand Finance plc 2011   © Brand Finance plc 2011   30
‘Rise of the
     machines’
     Google vs Apple
     Technology has been the key sector in this year’s               accompanied by scenes of near hysteria. A recent              has diversified its own services hugely. From just
     BrandFinance® Global 500. Twenty years ago,                     BBC documentary revealed that Apple devotees                  a search engine in the late 1990s, Google now offers
     technology brands were very much on the periphery               show brain activity consistent with those who                 maps, digitised books, news, email, translation
     and rarely featured in a consumer-facing context.               venerate religious iconography when discussing                services and much more besides. It is the world’s
     The 2011 study clearly illustrates how dramatically             their favourite Apple products.                               most visited website.
     this picture has changed in the last two decades.
     From work-place tools and entertainment                         Apple has permeated mainstream society to the                 Despite its prowess within the technology world,
                                                                     point that it has worldwide, near fanatical fanbase;          Google would not instantly seem to be a direct
     platforms, technology brands now define the way
                                                                     summarised neatly by a quote from the UK’s Bishop             competitor for Apple, whose focus has been mainly
     developed nations carry out many daily activities,                                                                            on hardware and operating systems. However just
                                                                     of Buckingham who stated, ‘Christianity you have to
     from socialising and interacting to shopping and                wait for the second coming…with Apple it happened             as	 Apple	 has	 launched	 the	 iPhone,	 Google	 has	
     banking. Reflecting this dominance, Google has                  in 1997’ in reference to the return of Steve Jobs,            released its own mobile operating system, Android.
     replaced Wal-Mart at the top of the list and now                who has been central to Apple’s success. Apple                In contrast to Apple’s generally tight control, Google
     tussles with other tech giants for dominance.                   overtook its arch rival Microsoft’s market value for          has adopted a more open strategy with fewer
                                                                     the first time, in 2010.                                      restrictions on application developers and a wide
     The most high-profile of these rivals is Apple.                                                                               range of handset providers, the most notable being
     Founded in 1976 in Cupertino California, Apple now              However, just as Apple has bested one rival, another          HTC. This strategy appears to have been hugely
     has 46,600 (as of September 2010) and worldwide                 has usurped its position in the technology world.             successful and Android now has overtaken Apple
     annual sales of US$65.2 billion. The company                    Google, launched in 1998, initially just as a search          in terms of handset sales. However, reports of the
     has fostered a brand image that actively sought                 engine service. It rapidly grew in popularity through         iPhone’s	 decline	 are	 almost	 certainly	 premature,	
     to rejects the traditional perception of Microsoft              the early 2000s, capturing market-share from                  as in terms of revenue Apple remains unchallenged.
     as staid and corporate. As Apple’s portfolio of                 rivals such as Yahoo!. However, following its initial         Its earnings for the last quarter were US$11.9 billion
     products	 broadened	 in	 the	 2000s,	 with	 the	 iPod,	         public offering in 2004, the company moved into a             in contrast to Google’s US$1 billion.
     iPhone	 and	 the	 iPad,	 the	 careful	 cultivation	 of	 this	   different league. US$1.67 billion worth of shares
     image has continued, with Apple positioning itself              were sold, giving Google a market capitalisation of
     as the lifestyle brand of choice for young, urban,              over	US$25	billion.	Not	only	did	this	make	many	of	
     creative people.                                                Google’s employees paper millionaires overnight,
                                                                     but it would help finance the continued growth
     However this is more than hollow marketing                      and spate of acquisitions that Google undertook,
     spin, Apple commands the kind of devotion other                 including the acquisition of online video-sharing site
     brands can only dream of, with new store openings               YouTube in 2006 for US$1.65 billion of stock. Google


31                                                                                                      © Brand Finance plc 2011   © Brand Finance plc 2011                                 32
Founded in 1923, Disney has become the world’s most
                                              recognisable and valuable entertainment brand.
                                              The periodical reissuing of its film library means
                                              that successive generations grow up listening to
                                              Disney songs and watching its animated characters,
                                              and then buy the classic films and merchandise for
                                              their own sons and daughters.

                                              Disney is a global enterprise consisting of four
                                              additional business segments – media, theme parks
                                              and resorts, studio entertainment and consumer
                                              products. This mix of high-quality creativity and
                                              successful business acumen has enabled Disney
                                              to	achieve	a	AAA+	Brand	Rating,	one	of	the	highest	
                                              in the BrandFinance® Global 500.

                                              The company actively monetises the equity built
                                              up within its brand and is constantly looking to license
                                              or extend into new categories, from innovative
                                              digital platforms to the more established outlets of
                                              theme parks and character licensing. However, by


     ‘Will there
                                              adhering to strict guidelines, the extensions serve
                                              to expand the revenue footprint without diluting the
                                              core brand equity.

                                              The company still leads other entertainment brands,
                                              such	as	Viacom	or	Fox,	in	terms	of	brand	value.	This	is	
                                              partly due to the fact that consumers are actually brand


     be a happy
                                              loyal to the Disney brand, as opposed to the product
                                              brand	–	e.g.	Viacom’s	MTV	or	Fox’s	The	Simpsons.

                                              Coinciding with the release of Disney’s latest
                                              movie in 2011 ‘Tangled’, Disney‘s brand value
                                              has    increased    substantially, increasing    to


     ending?’
                                              US$15.4 billion. It continues to be a profitable
                                              business, regularly producing contemporary films
                                              that are underpinned by messages of positivity
                                              and family values and, more recently, incorporating
                                              an increasingly contemporary tone.

                                              In the short-term, Disney continues to investigate
                                              additional revenue streams. There has been coverage
                                              in the press alleging that Disney has applied for


     Walt Disney
                                              the trademark of “Seal Team 6”, the name of the
                                              elite	 US	 Navy	 Seal	 Team	 that	 killed	 Osama	 Bin	
                                              Laden	 in	 Pakistan.	 The	 trademark	 supposedly	 covers	
                                              the	 following	 areas:”entertainment	 and	 education	
                                              services,” “toys, games and playthings” and
                                              “clothing, footwear and headwear.” Whilst there is
                                              almost certainly a market for these types of products,
                                              particularly in the computer games and toys sectors,
                                              it is a potentially hazardous departure from the core
                                              Disney positioning and could damage the brand
                                              value in the short and medium term, particularly if it
                                              is representative of a change in strategy.


33                 © Brand Finance plc 2011   © Brand Finance plc 2011                                    34
‘Like?’
                                           This year’s highest new entry is Facebook. With           Its commercial clout and diversified service
                                           a brand value of US$3.7 billion it still lags other       offerings are beginning to seriously threaten much
                                           technology giants. However there is no denying            larger competitors. Major blue-chip companies are
                                           that the social networking site has had the greatest      realising that Facebook’s colossal user base and
                                                                                                     high retention rate make it a potentially invaluable
                                           recent cultural impact of any brand in this year’s
                                                                                                     marketing and communication tool.
                                           BrandFinance® Global 500.
                                                                                                     As an example, the growing rivalry between


     Facebook
                                           Started in Mark Zuckerberg’s dorm room just over          Facebook and Google was highlighted recently when
                                           five years ago, Facebook has grown to eclipse all         Facebook	admitted	hiring	PR	firm	Burson	Marstellar	
                                           competitors in the social network market place.           to smear Google over privacy policies. Despite this,
                                           Pioneers	such	as	Friends	Reunited,	MSN	messenger	         Facebook is rapidly becoming a major commercial
                                           and latterly Bebo and Myspace, have all seen their        force. Although many exuberant valuations of tech
                                           user numbers stall, dwindle or collapse in the face       companies are eliciting fears of another tech bubble,
                                           of Facebook’s relentless advance. The site’s user         there is huge public and private interest in a potential
                                           base grew organically, expanding from one Ivy-            IPO.	Goldman	Sachs,	the	leading	investment	bank,	
                                           League campus to another, before swiftly leaping          valued the company at over US$50 billion and shares
                                           the Atlantic to incorporate prestigious universities in   in Mail.Ru performed well on opening, in part due
                                           other countries in the UK and Europe. The site’s user     to its shareholding in Facebook. Mark Zuckerberg’s
                                           base then broadened, covering all social and work         elevation to Time Magazine’s man of the year 2010
                                           groups across multiple countries. Facebook now            shows how Facebook has captured the public’s
                                           has more than 600 million active users around the         imagination and, more critically, their activity
                                           world and is translated into dozens of language.          on the internet.
                                           The range of services offered by Facebook has
                                           expanded rapidly, partly in a bid to monetise
                                           the enormous and growing user base. Through
                                           it is based on a traditional web platform, the site
                                           increasingly uses targeted adverts based on their
                                           user profiles, the groups they join and the branded
                                           pages they view.

                                           More recently, apps for the android mobile operating
                                           system	 and	 iPhone	 have	 been	 developed	 so	 that	
                                           Facebook is regularly used remotely by over 250
                                           million people. This has enabled the introduction of
                                           the	Facebook	Places	feature,	where	users	‘check	in’	
                                           to particular locations. In time, users are expected to
                                           be able to redeem discounts at participating retailers
                                           for visiting their stores. Meanwhile countless digital
                                           marketing companies are cooperating with Facebook
                                           to facilitate the relationship between consumers
                                           and their clients’ brands, through features such as
                                           the ‘like’ button.


35              © Brand Finance plc 2011   © Brand Finance plc 2011                                                                                             36
The Top
                                                                                                                                                                                     20 Banking
                                                                                                                                                                                     Brands


     ‘Thank you
     for smoking’
       Marlboro
     Marlboro is the only tobacco brand in this year’s      overt sponsorship activity some time ago.                      sector will become increasingly commoditised which
     Global 500 with a brand value of US$5,5 billion,       However, this legislation is now sometimes going               has a calamitous impact on brand values.
     ranking 181st. Originally designed as a cigarette      further; in Ireland, the government recently banned
     for women, the brand was repositioned in the 1950s     the display of any tobacco items in retailers, thereby         However, there are positive signs for manufacturers.
     to target the growing proportion of male smokers       further reducing awareness levels.                             Brand loyalty levels remain high, propensity to
                                                                                                                           switch between brands remains static and there are
     who wanted the perceived health benefit of filtered
                                                            Thirdly, and perhaps most critically in terms of brand         examples that the more aggressive legislation may not
     cigarettes. The initial advertising featured the now   value, legislators are now considering implementing            be	universally	implemented.	New	Zealand	introduced	
     iconic imagery of an American cowboy, providing        laws that drastically reduce the amount of on-pack             and then abandoned restrictions concerning in-store
     reassurance to male smokers that their masculinity     branding that cigarette companies can employ.                  display of tobacco products after research found there
     was not undermined by using filters.                   This immediately prevents companies from                       was no correlation between the ban and purchasing
                                                            differentiating their products. Some reports suggest           habits.
     Marlboro and other cigarette companies are now         that companies will only be allowed to use the title
     facing an attack on three fronts from legislators.     of their product, written in a generic black font on a         Unsurprisingly the developing world offers major
     Firstly, an increasing number of jurisdictions are     plain white background.                                        opportunities. Although China has a lower per capita
     banning smoking in public places, with a handful of                                                                   number of smokers than most countries, it consumes
     cities in the US state of California taking the most   A brand is much more than simply the title of the              approximately one third of the world’s cigarettes.
     restrictive policy in prohibiting smoking on beaches   product or service, particularly in the consumer goods         Assuming legislation in these countries remains
     and in public parks. And where the liberal, health-    sector. It is an indicator of a specific experience            tolerant, there is no reason why Marlboro will not hold
     conscious West Coast goes, many follow.                for the purchaser. If a company is unable to drive             on to its position in the Global 500.
                                                            awareness or differentiate itself, it will struggle not
     Secondly,  many      national   policy-makers          only to attract new consumers but it will also become
     banned conventional cigarette advertising and          harder to charge a price premium. As a result, the


37                                                                                              © Brand Finance plc 2011   © Brand Finance plc 2011                                               38
‘Game on’
     Xbox 360 vs PS3 vs Wii
     Relatively few people outside the video gaming                  and quality of games soon increased. Crucially                  new market of casual gamers which is less male-
     industry realise the sheer size of this sector. In 2009,        however,	Sony	envisaged	the	PS3	as	far	more	than	               focused and more family-oriented than traditional
     computer and video games software sales in the                  just	a	games	console.	The	PS3	has	been	used	as	a	               gaming	audiences.	Titles	such	as	Wii	Party	encourage	
     US were US$10.5 billion. This was just US$100                   loss leader to trump the competition in the broader             group participation and a reduced time commitment,
     million behind total US box office takings for the              electronic entertainment category; the company                  while the Wii Fit device encourages adults to use the
                                                                     made a staggering US$3 billion loss on the first 41             console as part of their fitness regime. As well as
     same period. In this context it is unsurprising that
                                                                     million units sold. There is method in the apparent             its shrewd identification of new markets, key to the
     the three largest home console brands, Microsoft’s              madness,	 as	 every	 PS3	 has	 been	 a	 ‘Trojan	 Horse’	        Wii’s success to date has been its motion sensitive
     Xbox (207th), Sony’s Playstation (316th) and                    for Sony’s blu-ray disc player. Mindful of having lost          controllers, which were a unique selling point for
     Nintendo’s Wii (318th), feature prominently in the              the	 VHS-Betamax	 format	 war	 in	 the	 1980s,	 Sony	           four years following the 2006 release.
     2011 BrandFinance® Global 500.                                  were determined it would not happen again given
                                                                     the	 importance	 of	 the	 high	 definition	 DVD	 market.	       This novel and engaging feature, though unchallenged
     Playstation	 arrived	 in	 the	 1990s	 and	 ever	 since	         Having learnt from their mistakes, Sony’s blu-ray               until late 2010, now faces stiff competition from
     the arrival of Xbox in 2001, the two brands have                format	has	eclipsed	Toshiba’s	rival	HD	DVD	format.	             Playstation’s	‘Move’	and	Xbox’s	‘Kinect’.	The	latter	
     competed head-to-head, particularly for more                    However,	 Playstation	 has	 recently	 suffered	 from	           has taken motion sensitive controllers to the next
     committed ‘hardcore’ gaming audience. Xbox’s                    a major security breach in Sony’s online gaming                 level by eliminating the need for a hand-held device,
     latest iteration, the Xbox 360, was released in 2005,           and digital media distribution service, where more              instead relying on a camera and body-movement
     while	the	third	outing	for	Playstation,	the	PS3,	was	           than 70 million users had their personal information            sensor. It has proved to be a phenomenal success,
     launched in 2006. The Xbox 360 has tended to                    stolen. Though this is not represented in this year’s           shipping over 10 million units and becoming the
     outsell	 the	 PS3	 by	 a	 small	 margin;	 55	 million	 units	   figures, it will almost certainly negatively impact its         world’s fastest selling consumer electronics device
     compared to approximately 50 million. This is due               brand value next year.                                          according to Guinness World Records.
     in part to the massively successful Halo franchise,
     exclusive to Xbox, and Microsoft’s online multiplayer           Sony	and	Playstation	have	the	monumental	task	of	               As	a	result,	Nintendo	are	planning	on	releasing	the	
     gaming service Xbox Live, which receives fairly                 convincing its users that their personal and financial          next iteration of the Wii in 2012 which is rumoured
     universal praise for its ease and usability. Xbox               details are safe in their hands. If Sony is able to             to be more powerful than both the Xbox360 and
     Live continues to grow with currently more than 25              mitigate the negative customer perception effects               the	PS3	and	offer	high	definition	video	output.	Wii’s	
     million subscribers, a significant revenue stream for           of the security breach, they will be in a strong                brand is valued at US$3.32 billion which places it
     Microsoft. As a result, Xbox has emerged ahead of               position to build on their US$3.34 billion brand value          just	behind	PlayStation.	
     its rivals in this year’s Global 500, with a brand value        and challenge Xbox’s position as the number one
     of US$4.72 billion.                                             home gaming console brand over the next year.                   The next couple of years will be a dynamic and
                                                                     The third player is the Wii, produced by veteran                interesting time in the home console market. The
     Despite marginally losing out to Microsoft, Sony                console manufacturer, outsells both Xbox and                    key	 question	 for	 Nintendo	 is	 whether	 its	 forecast	
     should not be too disappointed with its performance.            Playstation,	with	80	million	units	sold.	Nintendo	have	         innovations will be sufficiently appealing to allow it to
     Since	its	launch,	the	PS3’s	initially	limited	range	of	         traditionally targeted a slightly younger audience,             successfully	compete	against	Xbox	and	Playstation,	
     desirable game titles and higher price point were               with simpler gameplay and friendly, colourful                   or whether it will suffer in the long-term from its
     considerable disadvantages. However, game                       characters such as Mario. This distinctive approach             lack of appeal to the hard-core gaming audience.
     developers have slowly come to grips with the                   has been extended with the Wii, which has not only
     machine’s hardware capabilities, and the number                 targeted younger gamers, but has created a huge


39                                                                                                        © Brand Finance plc 2011   © Brand Finance plc 2011                                    40
‘Can they
     kick it ...yes,
     they can’
                                                                                                                                    was viewed more than 14 million times in less than
                                                                                                                                    a month. When official sponsor Adidas produced its
                                                                                                                                    own Star Wars themed World Cup video featuring
                                                                                                                                    David Beckham it had 2.8 million views in its first
                                                                                                                                    week.

                                                                                                                                    Puma	 is	 still	 a	 small	 player	 relative	 to	 Adidas	 and	
                                                                                                                                    Nike.	 Its	 brand	 value	 fell	 to	 US$1.5	 billion	 in	 2009,	
                                                                                                                                    but has crept up in recent years, and in 2011, has


     Nike vs Adidas vs Puma
                                                                                                                                    reached its highest Global 500 brand value figure
                                                                                                                                    ever of US$2.3 billion.

                                                                                                                                    Part	of	Puma’s	rise	is	attributable	to	their	decision,	
                                                                                                                                    taken in 2003, to sponsor a 16-year-old Jamaican
                                                                                                                                    athlete called Ussain Bolt. That sponsorship has
                                                                                                                                    enabled	 Puma	 to	 associate	 itself	 with	 a	 series	
     The sports industry is booming. With rising budgets            US Masters’ tournament, depicted the sportsman                  of phenomenal athletic performances that have
     helping to promote elite athletes and teams to even            staring into the camera, being asked whether he has             captivated global audiences. When Bolt virtually
     the remotest markets in the world, the potential               learnt anything from his mistakes. The commercial               sauntered to record-breaking 100 and 200 meter
     customer base is truly global.                                 polarised	audiences,	but	more	importantly	for	Nike,	            world	 records	 in	 2009	 wearing	 Puma,	 the	 media	
                                                                    Woods	lost	the	World	No.	1	ranking	in	October	2010	             value for the company alone was over US$105
     Nike	remains	the	most	valuable	brand	in	the	apparel	           and has continued on a winless streak ever since.               million.
     industry in the BrandFinance® Global 500, increasing
     in both brand value and ranking (31st), rising two             Adidas	 is	 Nike’s	 main	 competitor,	 and	 despite	            	In	2010	Puma	made	history	when	Bolt	signed	the	
     places since the previous year.                                setting its sights to overtake the overall market               biggest sponsorship deal ever recorded in athletics.
                                                                    leader,	Adidas	has	this	year	failed	to	beat	Nike	in	the	        Although the exact figures for the deal were not
     2009	 was	 an	 eventful	 year	 for	 Nike.	 The	 Oregon-        Global 500, ranking 139th. Its brand value has also             released, it was said to be comparable to that of
     based company became the official sponsor of the               increased from last year to US$6.8 billion. In 2010             Cristiano	Ronaldo’s	four	year	contract	with	Nike	that	
     Vancouver	 Winter	 Olympics	 but	 faced	 a	 difficult	         Adidas, who has for many years been the official kit            was	 worth	 US$32.5	 million.	 Unsurprisingly	 Puma	
     decision when Tiger Woods, the long-reigning, golf             sponsor for Olympic Games for Team Great Britain,               have announced that Bolt will play a vital role in the
     world	no.	1	and	long-term	Nike	spokesperson,	took	a	           announced that they would team up with British                  marketing of the company in the run up to London
     leave of absence from the sport after being exposed            designer Stella McCartney to make the kit as stylish            2012.
     by multiple media outlets as a serial adulterer.               as possible.
     This heavily impacted his commercial appeal,                                                                                   While placing at 492nd in the Global 500 this year,
     with several sponsors – including Accenture, the               Another event which brought the two companies                   Puma	 has	 the	 ingredients	 and	 heritage	 to	 increase	
     US professional services firm - withdrawing their              directly against each other was the FIFA World                  its brand value and rise up the table. Selecting
     endorsement	 contracts.	 Nike,	 however,	 stood	 by	           Cup 2010, held in South Africa. While nine of the               the right rising athletic and sports stars, clearly
     their man. Hoping that he would once again regain              32	 teams	 wore	 kit	 made	 by	 Nike,	 12	 wore	 Adidas.	       differentiating	themselves	against	Nike	and	Adidas,	
     his title and winning ways, the company released               Despite Adidas being the official sponsor of the                capitalising on their sporting heritage and treading
     a	 bold	 TV	 commercial	 that	 incorporated	 his	 late	        event,	 Nike	 employed	 various	 ambush	 marketing	             a delicate path between product innovation and
     father’s voice, attempting to redeem his status as             techniques, particularly online, to drive awareness of          continuing their success of producing more style-
     a	 family-friendly,	 aspirational	 sporting	 icon.	 The	 TV	   its	brand.	When	Nike	launched	its	World	Cup	advert,	            driven, non-performance-related product lines will
     spot, shown before Woods’ return to play in the                featuring Wayne Rooney and Cristiano Ronaldo it                 all play a part.


41                                                                                                       © Brand Finance plc 2011   © Brand Finance plc 2011                                          42
ISO	10668:	
                                                           Global standard for
                                                           brand valuations


43   © Brand Finance plc 2011   © Brand Finance plc 2011                         44
ISO	10668:	
                                                                                                 Global standard for
                                                                                                 brand valuations
                                                                                                 In December 2010, Brand Finance became one of
                                                                                                 the very few companies in the world to be accredited
                                                                                                 with the ISO 10668 global standard for brand
                                                                                                 valuations. ISO 10668 is the international norm
                                                                                                 that sets minimum standard requirements for the
                                                                                                 procedures and methods used to determine the
                                                                                                 monetary value of brands.

                                                                                                 David Haigh, CEO Brand Finance, was the UK
                                                                                                 representative on the ISO working party and chaired
                                                                                                 drafting meetings over a 2 year period to shape ISO
                                                                                                 10668 – ‘Brand valuation – Basic requirements for
                                                                                                 methods of monetary brand valuation’.


                                                                                                 In 2007 the International Organization for
                                                                                                 Standardization (‘ISO’), a worldwide federation of
                                                                                                 national standard setting bodies, set up a task force
                                                                                                 to draft an International Standard (‘IS’) on monetary
                                                                                                 brand valuation.
     ‘IS 10668 gives brand                                                                       IS	10668	–	Monetary	Brand	Valuation	–	was	released	
                                                                                                 in Q4 2010, setting out the principles which should
     valuation analysis the                                                                      be adopted when valuing any brand. The new IS
                                                                                                 applies to brand valuations commissioned for all
                                                                                                 purposes,	including:	accounting	and	financial	reporting,	
                                                                                                 insolvency, tax planning and strategic planning.
     institutional credibility
                                                                                                 Under IS 10668 the brand valuer must declare the
                                                                                                 purpose of the valuation as this affects the premise
     which it previously lacked.                                                                 or basis of value, the valuation assumptions used
                                                                                                 and the ultimate valuation opinion, all of which need
                                                                                                 to	 be	 transparent	 to	 a	 user	 of	 the	 final	 brand	

     It professionalises brand                                                                   valuation report.

                                                                                                 Requirements of             an    ISO     compliant
                                                                                                 brand valuation
     management’
                                                                                                 IS 10668 is a summary of existing best practice and
                                                                                                 intentionally avoids detailed methodological work
     David Haigh, CEO, Brand Finance plc                                                         steps and requirements. It applies to all proprietary
                                                                                                 and non-proprietary brand valuation approaches and
                                                                                                 methodologies that have been developed over the


45                                         © Brand Finance plc 2011   © Brand Finance plc 2011                                                               46
ISO	10668:	
                                                                                                                                                                                                              Global standard for
                                                                                                                                                                                                              brand valuations
     year, providing they follow the fundamental principles       Financial analysis                                                                            Brand Valuation
                                                                                                                                                                                                              or generic products or services. In practice it is often
     specified	 in	 the	 standard.	 IS	 10668	 specifies	 that	                                                                                                   Approaches                                  difficult	to	identify	unbranded	comparators.	To	identify	
     valuers must conduct three types of analysis before                                                                                                                                                      the	full	impact	on	demand	created	by	a	brand	the	Price	
     passing	 an	 opinion	 on	 the	 brand’s	 value:	 ‘Legal’,	                                                                                                                                                Premium	method	is	typically	used	in	conjunction	with	
     ‘Behavioural’ and ‘Financial’.                                                                                                       Market                      Cost                                    the	 Volume	 Premium	 method.	 Taken	 together	 these	
                                                                                                                                                                                       Income Approach
                                                                                                                                         Approach                   Approach                                  methods provide a useful insight into the value a brand
     Legal analysis                                                                                                                                                                                           adds to revenue drivers in the business model. Other
                                                                                                                                        Based on an                 Based on the       Based on estimating    methods go further to explain the value impact of
                                                                                                                                       estimate of the             premise that a      the expected future,
                                                                                                                                    price expected to be          prudent investor         after-tax cash     brands on revenue and cost drivers.
                                                                  IS	 10668	 specifies	 three	 alternative	 brand	 valuation	       realised if the brand      would not pay more       flows attributable
                                                                  approaches - the ‘Market’, ‘Cost’ and ‘Income’                    were to be sold in an       for a brand than the     to the brand then    Income-split method - this starts with net operating
                                                                                                                                        open market.              cost to recreate,     discounting them
                                                                  approaches. The purpose of the brand valuation, the                                          replace or reproduce     to a present value    profits	 and	 deducts	 a	 charge	 for	 total	 tangible	 capital	
                                                                  premise or basis of value and the characteristics of the                                           an asset of       using an appropriate   employed in the branded business, to arrive at
                                                                  subject brand dictate which primary approach should                                              similar utility.        discount rate.     ‘economic	profits’	attributable	to	total	intangible	capital	
                                                                  be used to calculate its value.                                                                                                             employed. Behavioural analysis is used to identify the
     The	 first	 requirement	 is	 to	 define	 what	 is	 meant	                                                                                                  Brand Valuation                               percentage contribution of brand to these intangible
                                                                  Market approach - measures value by reference                                                   Approaches                                  economic	 profits.	 The	 value	 of	 the	 brand	 is	 deemed	
     by ‘brand’ and which intangible assets should be
     included in the brand valuation opinion. The valuer          to what other purchasers in the market have paid                                                                                            to be the present value of the percentage of future
     must precisely determine the bundle of Intangible            for similar assets to those being valued. It produces                                                                                       intangible	economic	profits	attributable	to	the	brand.
     Assets	and	Intellectual	Property	Rights	included	in	the	     an estimate of the price if the brand were to be sold                   Market                      Cost
                                                                                                                                                                    Approach           Income Approach
                                                                                                                                         Approach
     definition	of	‘brand’.	                                      in the open market. However, as brands are unique and                                                                                       Other approaches include Multi-period excess earnings
                                                                  it	is	often	hard	to	find	relevant	comparables,	this	is	not	                                                                                 and incremental cash flow method, which is more
     The valuer is required to assess the legal protection        a widely used approach.                                                       Direct Methods
                                                                                                                                                                                          Indirect or         frequently used for strategic purposes.
     afforded to the brand by identifying each of the legal                                                                                                                            Residual Methods

     rights that protect it, the legal owner of each relevant     Cost approach - measures value by reference                                                                                                 What will be the impact of ISO 10668?
                                                                                                                                                   Royalty relief                         Income-split
     legal right and the legal parameters influencing             to the cost invested in creating, replacing or reproducing                         method                                 method
     negatively or positively the value of the brand, covering    the brand. This approach is based on the premise that                                                                                       IS 10668 was developed to provide a consistent
     each geographical jurisdiction and product or service        a prudent investor would not pay more for a brand than                          Price Premium                        Multi-period excess    framework for the valuation of local, national
                                                                                                                                                & Volume Premium                        earnings method
     registration category.                                       the cost to recreate, replace or reproduce an asset of                              method                                                  and international brands both large and small.
                                                                  similar utility. As the value of brands seldom equates                                                                                      The primary concern was to create an approach to
                                                                                                                                                 Incremental cash
     Behavioural analysis                                         to the costs invested creating them (or hypothetically                           flow method                                                brand valuation which was transparent, reconcilable
                                                                  replacing or reproducing them), this is not a widely                                                                                        and repeatable. In the wake of the standard’s launch
                                                                  used approach.                                                                                                                              it is expected that many companies will either value
                                                                                                                                    ISO 10668 outlines various methods for                                    their	 brands	 for	 the	 first	 time	 or	 revalue	 them	
                                                                  Income approach - measures value by reference                     conducting the income approach:                                           to comply with the standard.
                                                                  to	 the	 economic	 benefits	 expected	 to	 be	 received	
                                                                  over the remaining useful economic life of the brand.             Royalty Relief method - the most widely used
                                                                  This involves estimating the expected future,                     method used to determine brand cash flows. This
                                                                  after-tax cash flows attributable to the brand then               method assumes that the brand is not owned by the
     The brand valuer must then understand and form an            discounting them to a present value using an appropriate          branded business but is licensed in from a third party.
     opinion on likely stakeholder behaviour in each of the       discount rate.                                                    The value is deemed to be the present value of the
     geographical, product and customer segments in which                                                                           royalty payments saved by virtue of owning the brand.
     the subject brand operates. To do this it is necessary       As the value of brands stems from their ability to                This method is widely used because it is grounded in
     to	understand:                                               generate	 higher	 profits	 for	 either	 their	 existing	 or	      commercial reality and can be benchmarked against
                                                                  potential new owners this is the most widely accepted             actual transactions.
     •		Market	size	and	trends	                                   and used brand valuation approach.
     •		Contribution	of	brand	to	the	purchase	decision                                                                              Price Premium and Volume Premium methods -
     •		Attitude	of	all	stakeholder	groups	to	the	brand           brands systematically are likely to be more sustainable
                                                                                                                                    estimates the value of a brand by reference to the price
     •	 All	 economic	 benefits	 conferred	 on	 the	 branded	     long term.
                                                                                                                                    premium it commands over unbranded, weakly branded
        business by the brand


47                                                                                                       © Brand Finance plc 2011   © Brand Finance plc 2011                                                                                                                     48
Explanation of
                                                                                          the Methodology
                                The methodology employed in this BrandFinance®            Royalty Relief Approach
                                Global 500 listing uses a discounted cash flow (DCF)
                                technique to discount estimated future royalties, at      Brand Finance uses the royalty relief methodology
                                                                                          that determines the value of the brand in relation
                                an appropriate discount rate, to arrive at a net
                                                                                          to the royalty rate that would be payable for its use
                                present value (NPV) of the trademark and associated
                                                                                          were it owned by a third party. The royalty rate is
                                intellectual property: the brand value.                   applied to future revenue to determine an earnings
                                                                                          stream that is attributable to the brand. The brand
                                The steps in this process are:                            earnings stream is then discounted back to a net
                                                                                          present value.
                                1. Obtain brand-specific financial and revenue data.
                                                                                          The royalty relief approach is used for three
                                2. Model the market to identify market demand             reasons: it is favoured by tax authorities and
                                and the position of individual brands in the              the courts because it calculates brand values by
                                context of all other market competitors. Three            reference to documented third-party transactions;
                                forecast periods were used:                               it can be done based on publicly available financial
                                	 •	 Historical	 financial	 results	 up	 to	 2010.	       information and it is compliant to the requirement
                                     Where 2010 results are not available forecast        under	 the	 International	 Valuation	 Standards	
                                     using Institutional Brokers Estimate System          Committee	 (IVSC)	 to	 determine	 Fair	 Market	 Value	
                                     (IBES) consensus forecasts are used.                 of brands.
                                	 •	 A	five-year	forecast	period	(2011-2015),	based	
                                     on three data sources (IBES, historic growth         Brand Ratings
                                	 	 and	GDP	growth).
                                	 •	 Perpetuity	growth,	based	on	a	combination	of	        These are calculated using Brand Finance’s
                                	 	 growth	expectations	(GDP	and	IBES).                   ßrandßeta® analysis, which benchmarks the
                                                                                          strength, risk and future potential of a brand relative
                                3. Establish the royalty rate for each brand. This        to its competitors on a scale ranging from AAA to D.
                                is done by:                                               It is conceptually similar to a credit rating.
                                	 •	 Calculating	 brand	 strength	 –	 on	 a	 scale	 of	
                                      0 to 100, according to a number of attributes       The data used to calculate the ratings comes from
                                      such as financial, brand equity, market share       various sources including Bloomberg, annual reports
                                      and profitability, among others.                    and Brand Finance research.
                                	 •	 Use	 brand	 strength	 to	 determine	 ßrandßeta®
                                      Index score.
                                                                                          Brand Ratings Definitions
                                	 •	 Apply	 ßrandßeta® Index score to the royalty
                                      rate range to determine the royalty rate for
                                      the brand. The royalty rate is determined            AAA                     Extremely strong
                                      by a combination of the sector of operations,        AA                      Very	strong
                                      historic royalties paid in that sector and
                                      profitability of the company.                        A                       Strong
                                                                                           BBB-B                   Average
                                4. Calculate future royalty income stream.
                                                                                           CCC-C                   Weak
                                5. Calculate the discount rate specific to each            DDD-D                   Failing
                                brand, taking account of its size, geographical
                                presence, reputation, gearing and brand rating            Note:	 The	 AAA	 to	 A	 ratings	 can	 be	 altered	 by	
                                (see opposite).                                           including	 a	 plus	 (+)	 or	 minus	 (-)	 sign	 to	 show	 their	
                                                                                          more	detailed	positioning.	Valuation	Date
                                6. Discount future royalty stream (explicit forecast
                                and perpetuity periods) to a net present value –          Valuation Date
                                i.e.: the brand value.
                                                                                          All brand values in the report are for the end of the
                                                                                          year, 31st December 2010.


49   © Brand Finance plc 2011   © Brand Finance plc 2011                                                                                                    50
About
                                                                 Brand Finance is an independent global business
                                                                 focused on advising strongly branded organisations
                                                                 on how to maximize value through the effective
                                                                 management of their brands and intangible assets.

                                                                 Since it was founded in 1996, Brand Finance has


     Brand
                                                                 performed thousands of branded business, brand
                                                                 and intangible asset valuations worth trillions
                                                                 of dollars.

                                                                 Brand Finance’s services support a variety
                                                                 of business needs:

                                                                 •	 Technical	 valuations	 for	 accounting,	 tax	 and	
                                                                    legal purposes


     Finance
                                                                 •	 Valuations	in	support	of	commercial	transactions	
                                                                    (acquisitions, divestitures, licensing and joint
                                                                    ventures)        involving   different    forms
                                                                    of intellectual property

                                                                 •	 Valuations	 as	 part	 of	 a	 wider	 mandate	 to	 deliver	
                                                                    value-based marketing strategy and tracking,
                                                                    thereby bridging the gap between marketing
                                                                    and finance.

                                                                 Our clients include international brand owners, tax
                                                                 authorities,	 IP	 lawyers	 and	 investment	 banks.	 Our	
                                                                 work is frequently peer-reviewed by the big four
                                                                 audit practices and our reports have also been
                                                                 accepted by various regulatory bodies, including the
                                                                 UK	Takeover	Panel.

                                                                 Brand Finance is headquartered in London and has
                                                                 a network of international offices in Amsterdam,
                                                                 Bangalore, Barcelona, Cape Town, Colombo, Dubai,
                                                                 Geneva, Helsinki, Hong Kong, Istanbul, Lisbon,
                                                                 Madrid,	 Moscow,	 New	 York,	 Paris,	 Sao	 Paulo,	
                                                                 Sydney, Singapore, Toronto and Zagreb.

                                                                 www.brandfinance.com


51         © Brand Finance plc 2011   © Brand Finance plc 2011                                                                  52
About
                                                                                                 Brand Finance


                                                                                                  Brand Finance is an independent global business
                                                                                                  focused on advising strongly branded organisations
                                                                                                  on how to maximize value through the effective
                                                                                                  management of their brands and intangible assets.

                                                                                                  At Brand Finance, we are entirely focussed on
                                                                                                  quantifying and leveraging intangible asset value.
                                                                                                  Our services compliment and support each other,
                                                                                                  resulting in robust valuation methodologies, which
                                                                                                  are underpinned by an in-depth understanding of
                                                                                                  revenue drivers and licensing practice.


                                                Valuation                   Analytics                     Strategy                  Transactions


                                     We perform valuations          Our analytical services      We give marketers the        We help private equity
                                     for financial reporting, tax   help clients to better       framework to make            companies, venture
                                     planning, M&A activities,      understand the drivers       effective economic           capitalists and branded
                                     joint	ventures,	IPOs	          of business and brand        decisions. Our value-        businesses to identify
                                     and other transactions.        value. Understanding         based marketing service      and assess the value
                                     We work closely with           how value is created,        enables companies            opportunities through
                                     auditors, tax authorities      where it is created and      to focus on the best         brand and market due
                                     and lawyers.                   the relationship between     opportunities, allocate      diligence and brand
                                                                    brand value and business     budgets to activities that   licensing.
                                                                    value is a vital input to    have the most impact,
                                                                    strategic decision making.   measure the results and
                                                                                                 articulate the return on
                                                                                                 brand investment.


                                     Financial reporting            Brand equity drivers         Brand strategy               Brand due diligence

                                     Tax and transfer pricing       Brand strength analysis      Brand architecture           Brand licensing

                                     Litigation                                                                               Fundraising
                                                                    Brand risk analysis          Brand extension
                                     Investor relations             (ßrandßeta®)
                                                                                                 Budget setting and
                                                                    Brand scorecards             allocation
                                                                    Marketing mix modelling      Brand	value	added	(BVA®)
                                                                    Marketing ROI


53   © Brand Finance plc 2011   © Brand Finance plc 2011                                                                                                54
Our
                                                                                                                                                                                   Services
     Valuation                                                 Analytics                                                  Combined with brand valuation results, our analytical    Budget Determination: We help clients identify
                                                                                                                          service creates the framework for better corporate       which products or services and brands create
     We conduct valuation and analytics assignments            Our analytical services help clients to better             reporting and brand performance management.              or destroy the most value. Clients can use this
     for branded enterprises and branded businesses.           understand the drivers of business and brand                                                                        to allocate resources and budgets across their
     We value brands, intangible assets and intellectual       value. Understanding how value is created, where           Strategy                                                 marketing activities to yield the best returns.
     property in many jurisdictions for accounting, tax,       it is created and the relationship between brand
     corporate finance and marketing purposes. We              value and business value is a vital input to strategic     We conduct market studies, market sizing, feasibility    Communications Strategy: We help companies
     act on behalf of intellectual property owners, tax        decision making. By furthering knowledge of this           studies, brand audits and brand portfolio evaluation.    develop effective results-oriented communication
     authorities and work closely with lawyers, private        relationship, Brand Finance is able to help clients’       Combining market intelligence, brand analytics,          strategies. All communication strategies are driven
     equity firms, and investment banks.                       leverage brand value and ultimately maximise               market research and financial assessment, we             by market research with the aim of meeting clients
                                                               shareholder value.                                         provide greater depth and insights into our clients’     key objectives including building goodwill across
     Our work is frequently peer-reviewed by independent                                                                  strategies.                                              customer base; generating sales; creating and
     audit practices and our approach has been accepted        Some of our key analytical services include:                                                                        reinforcing brand and professional corporate image;
     by regulatory bodies worldwide.                                                                                      Some of our key Brand Strategy Advisory                  informing and creating positive perceptions and
                                                               Brand	 Dashboards	 and	 Scorecards:	 We	 help	             Services include:                                        assisting in the introduction of new products
     Reasons for        Brand Valuation         Financial      companies improve brand performance management                                                                      to market.
     Reporting:                                                and reporting by integrating market research,              Brand Strategy Evaluation: We help clients
                                                               investment, market and financial metrics into a            make disciplined choices about how to maximise           Transactions
     Accounting standards in most developed markets            single insightful model to track performance over          economic value, by providing a framework for
     allow for capitalisation of purchased intangible          time and against competitors and to uncover the            optimal resource allocation and strategy selection.      Our transaction support services help companies
     assets. The initial valuations and subsequent             most important drivers of overall brand and business       This helps identify the value optimising allocation of   evaluate and mitigate risks, extract maximum
     impairment reviews generally require the opinion of       value.                                                     marketing investment, provides a strategic overview      value in mergers and acquisitions as well as private
     an independent valuation expert.                                                                                     of the risks and returns associated with each market     equity investments. We also assist private equity
                                                               Competitor Benchmarking: We conduct a                      segment                                                  companies, venture capitalists, brand owners
     Tax Planning: The growing importance of intangible        benchmarking study of the strength, risk and future                                                                 and businesses identify and assess the value of
     assets has significant tax planning implications.         potential of a clients brand relative to its competitor    Strategic Optimisation: We help branded                  opportunities through brand due diligence and brand
     Brand Finance works for both fiscal authorities and       set. This helps understanding the strengths and            businesses increase their value. Using brand             strategy option, including licensing.
     brand owners on transfer pricing and capital gains        weaknesses of the client brand compared with key           valuation techniques, we help clients determine the
     tax issues.                                               competitor brands.                                         financial impact of different strategic brand options    Some of our key Transaction                 Support
                                                                                                                          such as licensing, joint ventures, investment,           Services include:
     Dispute Resolution: We have helped clients protect        Value Drivers Analysis: We help businesses                 divestment, brand architecture changes, entering
     the commercial value of their brands through a range      understand the relationship between brand attributes       or exiting new segments or markets and other             Brand and Market Due Diligence: We help clients
     of licensing and trademark disputes that have been        and key value drivers in the business model. This          transactions.                                            by valuing branded businesses, brands and other
     settled both in and out of court. We also provide         is achieved by creating a framework for measuring                                                                   intangible assets for purchase or sale providing
     litigation	support	work	for	various	legal	firms	and	IP	   brand equity and connecting it to value driving            Brand Architecture and Portfolio review: We help         reassurance to the investment and management
     companies.                                                behaviour in each stakeholder group. Resources             companies evaluate different branding architecture       teams. In addition, we assist in securing finance
                                                               can then be allocated and prioritised based on the         scenarios. Using sensitivity analysis, this identifies   against brands by using a mixture of financial, legal,
     Marketing & Brand Management: There is an                 overall impact on financial value.                         potential addition or loss of economic value under       marketing and commercial due diligence.
     increasing demand from investors and analysts for                                                                    alternative brand architecture options and enables
     information on brand value and brand performance.         Demand Forecasting: We provide clients with a              informed decision making.                                Brand Licensing and Franchising: We help
     Brand Finance advises clients on both the external        market demand forecasting framework for long                                                                        maximise earnings and provide greater brand
     disclosures and required brand metrics. Our               term strategic planning.                                   Market Entry and New Product Development:                presence and knowledge by identifying the best
     valuation services have assisted many companies to                                                                   We work together with companies to develop               opportunities for licensing and franchising, both
     understand and improve the value of their intangible      Marketing Mix Modelling: We help improve the               successful market entry and new product                  internally and externally. We also provide advice
     assets.                                                   efficiency of brand campaign planning and targeting        strategies.                                              on best practice in licensing agreements.
                                                               by isolating and quantifying the impact of different
     Commercial Transactions: We help clients to               marketing activities. The model guides the mix and         Naming and Visual Identity Management:                   Purchasing & Sales: We provide clients with an
     determine the value of their intangible assets and        combination of future marketing activities                 We work together with clients to help develop            understanding of the financial potential of their
     enterprise value for mergers and acquisitions,                                                                       research-based naming strategies that are aligned        intellectual property to help inform negotiation of
     negotiations, franchise and licensing and deal            Marketing ROI: We help clients improve decision-           with the overall business objectives of the company.     rates and terms to strike the best deals. Our role also
     structuring to ensure that they make informed             making by providing insights which assist with             In addition, we help manage the entire visual identity   includes the identification of potential purchasers
     decisions.                                                budget optimisation, resource allocation, brand            process to help ensure that new and refreshed            and execution of the sales process.
                                                               performance and evaluation of marketing activities.        brand identities are implemented efficiently
                                                                                                                          and effectively.


55                                                                                             © Brand Finance plc 2011   © Brand Finance plc 2011                                                                                           56
Brand Finance
                                                                                                                                                     continues to develop
                                                                                                                                                     and expand


     In the last year Brand Finance has made                                                 BrandGenius®
     three important developments.                                                           BrandGenius Ltd is a company within the Brand
                                                                                             Finance group, based in the new Haymarket
                                                                                                                                                     Our experts each have decades of experience,
                                                                                                                                                     and are recognised as leaders in their fields.
                                                                                             offices, which provides a full range of expert          They include:
                                                                                             branding services, covering all aspects of
                                                                                                                                                     Peter Fisk, the well-known author, speaker and
     1 > Moving to new offices.
                                                                                             consulting, innovation, communications and design.
                                                                                                                                                     advisor	on	marketing,	branding	and	innovation.	Peter	
                                                    Our global headquarters                  This complements and extends Brand Finance’s
                                                                                             capabilities to build brand value for clients. We can   is author of the best-selling books Marketing Genius,
     is now at 56 Haymarket, centrally located between Piccadilly Circus and                 help resolve any sort of branding issue.                Consumer	 Genius	 and	 Creative	 Genius.	 Peter	 is	 a	
                                                                                                                                                     business innovator, strategist and marketer, having
     Trafalgar Square in the very centre of London.                                          BrandGenius combines the yin and yang of brand          spent many years working with the likes of American
                                                                                             building. We bring together creative magic with         Express	and	Coca	Cola,	Microsoft	and	Virgin.	
                                                                                             commercial logic, driven by real customer insight,

     2 > Expanding our range of brand league tables                                          engaging your leaders and colleagues, and focused
                                                                                             on making the best financial impact.
                                                                                                                                                     David Hensley, the brand and business strategist.
                                                                                                                                                     David has written many articles and contributed to
                                                                                                                                                     books on branding and business strategy, as well
     to include more Sector and Country league tables. As well our established               BrandGenius has a different way of working from         as winning awards for creative brand design work.
                                                                                             other brand consultancies and design agencies, in       David worked for McKinsey & Company before
     Banking, Insurance and Telecoms league tables, we have now produced                     that we have a roster of leading experts in different   becoming European Director of Consulting at
                                                                                                                                                     FutureBrand	and	then	Senior	Partner	at	Lippincott	in	
     the rankings for the top Wines and Spirits brands, Beer brands, Cosmetics               aspects of branding from around the world, and bring
                                                                                                                                                     London before founding his own branding practice,
                                                                                             them into client situations as needed. This means
     brands, Airlines, Cars, Advertising Agencies and many more.                             that we can give objective, impartial advice as we      Hensley	Partners.	In	his	early	career	he	worked	as	
                                                                                             don’t have to keep our teams of experts or designers    a marketer for Shell, and as a strategist for Carlton
                                                                                             busy, yet also have the breadth of expertise to         Communications.

     3 > Growing BrandGenius®,                          the brand strategy and
                                                                                             address branding issues of any complexity.
                                                                                                                                                     Richard Gowar, the strategy and brand growth
                                                                                                                                                     expert. Richard has worked with international
     innovation service line. This provides expert advice and support to clients,                                                                    brand owners from Durex to Diamonds. Richard
                                                                                                                                                     is	 the	 former	 President	 of	 Global	 Brands	 at	 Allied	
     addressing and resolving a whole range of branding issues including brand                                                                       Domecq and now works with a range of businesses
                                                                                                                                                     and entrepreneurs to help them get the most out
     positioning, innovation, design, communication and implementation.                                                                              of their budgets to achieve creative and successful
                                                                                                                                                     turnaround programmes.


57                                                                © Brand Finance plc 2011   © Brand Finance plc 2011                                                                                              58
Brand Finance ®
                                                                                             Forums
                                                                                             Brand Finance is committed to the development
                                                                                             of theoretical and practical issues surrounding
                                                                                             brands.

                                                                                             As part of this process, we organise a series of
                                                                                             events and forums around the world where leading
                                                                                             practitioners in the area of brand strategy, brand
                                                                                             building and brand valuation come together to share
                                                                                             their experiences and to better understand the
                                                                                             process by which valuable brands are created.

                                                                                             The Brand Finance Forum has progressively become
     “Understanding the                                                                      one of the definitive events in the area of brand
                                                                                             valuation and should not be missed by anyone who
                                                                                             is serious about maximising the value of their brands

     role of the brand                                                                       and intangible assets.

                                                                                             To find out more visit
                                                                                             www.brandfinanceforum.com
     in the generation
     of profit is vital
     to all businesses.
     The Brand Finance
     Forum helped to create
     a breakthrough for
                                                                                             Brandirectory is an online encyclopedia of
                                                                                             brands where financial results, visual identities,
     my company.”                                                                            trademark histories and the latest marketing
                                                                                             news are compiled and shared.

     Ex-Chairman,                                                                            • Brand league tables
     Shell Brands International, Switzerland                                                 • Brand valuation reports
                                                                                             • Brand profiles
                                                                                             • Brand comparison tool

                                                                                             It is an invaluable resource for brand managers,
                                                                                             offering detailed brand profiles and comparative
                                                                                             analysis across all major commercial sectors. Our
                                                                                             league tables are the most comprehensive table of
                                                                                             published brand values in the world.

                                                                                             To find out more visit www.brandirectory.com


59                                     © Brand Finance plc 2011   © Brand Finance plc 2011                                                           60
Glossary
                                                                 of Terms                                                                                   Disclaimer
     Brand                                                       Holding company                                                                            Brand Finance has produced this study with an
     A brand is a trademark and associated Intellectual          A company controlling management and operations                                            independent and unbiased analysis. The values
     Property                                                    in another company or group of other companies
                                                                                                                                                            derived and opinions produced in this study are
     ßrandßeta®                                                  Institutional      Brokers      Estimate        System                                     based only on publicly available information and
     Brand Finance’s proprietary method for adjusting            (IBES)                                                                                     certain assumptions that Brand Finance used where
     a weighted average cost of capital (WACC) to arrive         A system that gathers and compiles the different                                           such data was deficient or unclear. No independent
     at a specific discount rate for each brand (based           estimates made by stock analysts on the future earnings                                    verification or audit of such materials was
     on its Brand Rating)                                        for most of the major publicly traded companies                                            undertaken. Brand Finance accepts no responsibility
     Branded business                                            Intangible asset                                                                           and will not be liable in the event that the publicly
     The whole business trading under particular brands,         An	 identifiable	 non-monetary	 asset	 without	 physical	                                  available information relied upon is subsequently
     the associated goodwill and all the other tangible and      substance                                                                                  found to be inaccurate.
     intangible elements at work within the business
                                                                 Net present value (NPV)                                                                    The BrandFinance® Global 500 brand valuations
     Brand rating                                                The present value of an asset’s net cash flows (minus                                      follow	IVSC	guidance	but	will	only	comply	with	ISO	
     A summary opinion, similar to a credit rating, on a brand   any initial investment)                                                                    10668	 Monetary	 Brand	 Valuation	 Standard	 when	
     based on its strength as measured by Brand Finance’s                                                                                                   accompanied by detailed Legal and Behavioral
     ßrandßeta® analysis                                         Market Capitalisation (Market Cap)
                                                                                                                                                            analysis.
                                                                 Current price per share multiplied by the number
     Brand value                                                 of shares in issue
     The net present value of the estimated future cash                                                                                                     The conclusions expressed are the opinions of Brand
     flows attributable to the brand (see Explanation            Perpetuity Growth                                                                          Finance and are not intended to be warranties or
     of Methodology for more detail)                             Is the stable growth rate assumed to be effective                                          guarantees that a particular value or projection can be
                                                                 in perpetuity following the last explicit forecast period                                  achieved in any transaction. The opinions expressed
     Compound Annual Growth Rate (CAGR)                                                                                                                     in the report are not to be construed as providing
     The year-over-year growth rate of an investment over        Royalty Rate                                                                               investment advice. Brand Finance does not intend
     a	specified	period	of	time                                  The rate at which usage-based payments are made                                            the report to be relied upon for technical reasons
                                                                 by one party (the licensee) to another (the licensor)                                      and excludes all liability to any organisation.
     Discounted cash flow (DCF)                                  for ongoing use of the licensor’s asset, sometimes an
     A method of evaluating an asset value by estimating         intellectual property right
     future cash flows and taking into consideration the
     time value of money and risk attributed to the future       Royalty Relief Method
     cash flows                                                  Please	see	methodology	section

     Discount rate                                               Tangible Net Assets
     The interest rate used in discounting future cash           Calculated as the total assets of a company, minus
     flows                                                       any intangible assets such as goodwill, patents
                                                                 and trademarks, less all liabilities and the par value
     Disclosed Intangibles                                       of preferred stock
     This represents the value of acquired intangible assets
     as	reported	in	a	group’s	financial	statements               Tangible Value
                                                                 The fair market value of the monetary and physical
     Enterprise value                                            assets of a business
     The combined market value of the equity and debt of
     a business less cash and cash equivalents                   Undisclosed Intangible Value
                                                                 This represents the value of the intangible assets
     Fair market value (FMV)                                     which	are	not	separately	reported	in	a	group’s	financial	
     The price at which a business or assets would change        statements (e.g. Goodwill, patents)
     hands between a willing buyer and a willing seller,
     neither of whom are under compulsion to buy or sell         Weighted average cost of capital (WACC)
     and both having reasonable knowledge of all relevant        An average representing the expected return on all of
     facts at the time                                           a company’s securities. Each source of capital, such as
                                                                 stocks, bonds, and other debt, is assigned a required
     Global Intangible Finance Tracker (GIFT)                    rate of return, and then these required rates of return
     The Brand Finance ‘Global Intangible Finance Tracker        are weighted in proportion to the share each source of
     is the most extensive report ever compiled into             capital contributes to the company’s capital structure
     intangible assets and covers over 5,000 companies
     in 25 countries


61                                                                                                    © Brand Finance plc 2011   © Brand Finance plc 2011                                                             62
Contact Details
                                Brand Finance plc is the leading independent                 For further information on Brand Finance®’s services
                                intangible asset valuation and brand strategy firm,          and valuation experience, please contact your local
                                                                                             representative	as	listed	below:
                                helping companies to manage their brands more
                                intelligently for improved business results.

                                For further enquiries       relating   to   this   report,                     Name of
                                please	contact:                                                                                       Email address
                                                                                                               contact

                                                                                              Australia     Tim Heberden     t.heberden@brandfinance.com

                                                                                              Brazil        Gilson	Nunes	    g.nunes@brandfinance.com
                                                                   David Haigh
                                                                       CEO                    Canada        Mike Rocha       m.rocha@brandfinance.com

                                                                                              Croatia       Borut Zemljic    b.zemljic@brandfinance.com
                                                           david.haigh@brandfinance.com
                                                                                              France        Richard Yoxon    r.yoxon@brandfinance.com

                                                                                                            Marc
                                                                                              Holland                        m.cloosterman@brandfinance.com	
                                                                                                            Cloosterman

                                                                                             Hong Kong      Rupert	Purser	   r.purser@brandfinance.com	
                                                                   Mike Rocha
                                                                Managing Director            India          Unni Krishnan    u.krishnan@brandfinance.com

                                                                                             Portugal	      Pedro	Tavares	 p.tavares@brandfinance.com

                                                            m.rocha@brandfinance.com         Russia
                                                                                                            Alexander
                                                                                                                             a.eremenko@brandfinance.com
                                                                                                            Eremenko

                                                                                             Singapore      Samir Dixit      s.dixit@brandfinance.com

                                                                                             South Africa   Ollie Schmitz    o.schmitz@brandfinance.com
                                                           Professor Malcolm McDonald
                                                                  Chairman UK                Spain          Pedro	Tavares	 p.tavares@brandfinance.com

                                                                                                            Ruchi
                                                                                             Sri Lanka                       r.gunewardene@brandfinance.com	
                                                                                                            Gunewardene
                                                           m.mcdonald@brandfinance.com
                                                                                             Switzerland    Mike Rocha       m.rocha@brandfinance.com

                                                                                                            Muhterem
                                                                                             Turkey                          m.ilguner@brandfinance.com
                                                                                                            Ilguner
                                                                                                            Willian E
                                                                                             USA                             w.barker@brandfinance.com
                                                                                                            Barker


                                                                                             For	all	other	countries,	please	email:		
                                                                                             enquiries@brandfinance.com

                                                                                             www.brandfinance.com


63   © Brand Finance plc 2011   © Brand Finance plc 2011                                                                                                   64
Appendix


65   © Brand Finance plc 2011   © Brand Finance plc 2011              66
BrandFinance ®
                                                                                                                                                                                                                                                          Global 500 2011

                                                                                                        Brand                                     Brand                                                                                                                          Brand                               Brand
                                                                        Brand    Brand                  Value /     Brand                         Value /    Brand                                                                               Brand    Brand                  Value /     Brand                   Value /    Brand
     Rank   Rank                                                                          Enterprise                            Enterprise                            Rank   Rank                                                                                  Enterprise                         Enterprise
                         Brand            Industry        Domicile      Value    Rating                Enterprise   Value                       Enterprise   Rating                           Brand                 Industry       Domicile      Value    Rating                Enterprise   Value                 Enterprise   Rating
     2011   2010                                                                            Value                               Value 2010                            2011   2010                                                                                    Value                            Value 2010
                                                                         2011     2011                   Value       2010                         Value       2010                                                                                2011     2011                   Value       2010                   Value       2010
                                                                                                          (%)                                    2010 (%)                                                                                                                          (%)                              2010 (%)

      1      2     Google         Internet              United States   44,294   AAA+     143,016      31%          36,191                      23%          AAA+     26      40      Chase                 Banks                United States   19,150   AA-      90,089       21%          13,400   69,901       19%          AA

      2      5     Microsoft      Software              United States   42,805   AAA+     165,725      26%          33,604      199,990         17%          AAA+                                           Consumer
                                                                                                                                                                      27      28      Intel                                      United States   19,078   AA+      92,546       21%          16,642   95,316       17%          AA+
                                                                                                                                                                                                            Electronics
                                  Retail-Department
      3      1     Wal-Mart                             United States   36,220   AA       154,325      23%          41,365      190,803         22%          AA       28      43      Bradesco              Banks                Brazil          18,678   AAA      69,604       27%          13,299   56,583       24%          AAA-
                                  Stores

      4      4     IBM            IT services           United States   36,157   AA+      189,718      19%          33,706      180,028         19%          AA       29      25      Orange                Telecoms Services    France          18,622   AA+      106,791      17%          18,352   120,119      15%          AA

      5      7     Vodafone       Telecoms Services     Britain         30,674   AAA+     192,456      16%          28,995      178,604         16%          AAA      30      27      Shell                 Oil&Gas              Netherlands     18,605   AAA-     222,664      8%           16,997   208,854      8%           AAA-

                   Bank of
      6     12                    Banks                 United States   30,619   AAA-     120,195      25%          26,047      111,754         23%          AAA+     31      33      Nike                  Apparel              United States   18,437   AAA      31,590       58%          15,808   24,776       64%          AAA
                   America
                   General        Miscellaneous                                                                                                                       32      42      Amazon                Internet             United States   17,780   AA       64,132       28%          13,340   54,962       24%          AA
      7      6                                          United States   30,504   AA+      475,066      6%           31,909      528,713         6%           AA+
                   Electric       Manufactur
                                  Consumer                                                                                                                            33      66      Nestlé                Food                 Switzerland     17,455   AA       66,288       26%          11,178   39,319       28%          AAA-
      8     20     Apple                                United States   29,543   AAA      244,382      12%          19,829      156,416         13%          AAA-
                                  Electronics
                                                                                                                                                                      34      45      Barclays              Banks                Britain         17,358   AA       50,683       34%          13,134   56,155       23%          AA
      9     15     Wells Fargo    Banks                 United States   28,944   AA+      136,069      21%          21,916      131,225         17%          AA

                                                                                                                                                                      35      54      ICBC                  Banks                China           17,194   AA       218,132      8%           12,083   225,368      5%           AA+
      10     11    AT&T           Fixed Line            United States   28,884   AA+      235,987      12%          26,585      229,793         12%          AA+
                                                                                                                                                                      36      36      Citi                  Banks                United States   17,133   AA       105,323      16%          14,362   70,105       20%          A+

      11     8     HSBC           Banks                 Britain         27,632   AAA      171,163      16%          28,472      193,794         15%          AAA+                     China
                                                                                                                                                                      37      55      Construction          Banks                China           17,092   AA       205,564      8%           12,076   208,117      6%           AA+
                                                                                                                                                                                      Bank
     12     14     Verizon        Telecoms Services     United States   27,293   AA       381,093      7%           23,029      196,293         12%          AA
                                                                                                                                                                      38      44      UPS                   Transportation       United States   17,012   AA+      73,300       23%          13,170   61,885       21%          AA+
     13      9     HP             IT services           United States   26,756   AA+      84,186       32%          27,383      100,998         27%          AAA-
                                                                                                                                                                                                            Miscellaneous
                                                                                                                                                                      39      35      Siemens                                    Germany         16,769   AA+      103,770      16%          14,709   102,939      14%          AA+
                                                                                                                                                                                                            Manufacture
      14     10    Toyota         Auto Manufacturers    Japan           26,152   AA+      204,864      13%          27,319      185,402         15%          AAA
                                                                                                                                                                      40      51      Ford                  Auto Manufacturers   United States   16,662   AA+      108,342      15%          12,652   97,539       13%          AA
     15     13     Santander      Banks                 Spain           26,150   AAA      100,281      26%          25,576      128,087         20%          AAA+
                                                                                                                                                                      41     116      Itaú                  Banks                Brazil          16,655   AA       98,923       17%          6,911    58,588       12%          AAA-
     16      3     Coca-Cola      Beverages             United States   25,807   AAA+     69,508       37%          34,844      87,814          40%          AAA+
                                                                                                                                                                      42      37      BNP	Paribas           Banks                France          16,643   AAA-     64,882       26%          14,060   67,144       21%          AA
                                  Retail-Restaurants/
     17     18     McDonalds                            United States   21,842   AAA      89,595       24%          20,192      77,140          26%          AAA-
                                  Pubs
                                                                                                                                                                      43      46      Honda                 Auto Manufacturers   Japan           16,355   AAA-     90,658       18%          13,083   82,377       16%          AA+
                                  Consumer
     18     23     Samsung                              South Korea     21,511   AA+      113,327      19%          18,925      86,384          22%          AA+
                                  Electronics
                                                                                                                                                                      44      62      Chevron               Oil&Gas              United States   16,265   AA       169,618      10%          11,464   159,998      7%           AA
      19    17     Tesco          Retail-Food           Britain         21,129   AAA      69,868       30%          20,654      73,969          28%          AAA-
                                                                                                                                                                                                            Retail-Department
                                                                                                                                                                      45      34      Target                                     United States   15,989   AA       52,694       30%          15,224   51,678       29%          AA
                   Mercedes-                                                                                                                                                                                Stores
     20     39                    Auto Manufacturers    Germany         20,798   AA       114,328      18%          13,883      78,057          18%          A+
                   Benz                                                                                                                                                               American              Diversified Finan
                                                                                                                                                                      46      50                                                 United States   15,529   AA       45,505       34%          12,737   42,043       30%          AA
                                  Distribution/                                                                                                                                       Express               Serv
     21     26     Mitsubishi                           Japan           20,473   AA       195,041      10%          17,805      231,268         8%           AA+
                                  Wholesale
                                                                                                                                                                      47      19      Walt Disney           Media                United States   15,424   AAA+     52,049       30%          13,435   44,984       30%          AAA
                   The Home       Retail-Department
     22     22                                          United States   20,423   AA-      60,527       34%          19,013      51,076          37%          AA-
                   Depot          Stores                                                                                                                                              Deutsche
                                                                                                                                                                      48      73                            Banks                Germany         15,169   AA+      52,442       29%          9,862    43,273       23%          AA-
                                                                                                                                                                                      Bank
     23     29     BMW            Auto Manufacturers    Germany         20,157   AA+      92,873       22%          16,616      91,170          18%          AAA-
                                                                                                                                                                      49      30      AXA                   Insurance            France          15,099   AA-      41,269       37%          16,403   44,326       37%          AA-
     24     31     Pepsi-Cola     Beverages             United States   19,514   AA+      79,149       25%          15,991      44,866          36%          AA+
                                                                                                                                                                      50      65      TATA                  Iron/Steel           India           15,087   AAA-     103,721      15%          11,216   63,869       18%          AAA-
     25     24     China Mobile   Cellular Telecoms     Hong Kong       19,317   AA       170,543      11%          18,673      153,077         12%          AA+


                                                                                                                             All values in USD $ Millions                    All values in USD $ Millions
67                                                                                                                           © Brand Finance plc 2011                        © Brand Finance plc 2011                                                                                                                                  68
BrandFinance ®
                                                                                                                                                                                                                                                             Global 500 2011

                                                                                                          Brand                                     Brand                                                                                                                           Brand                               Brand
                                                                          Brand    Brand                  Value /     Brand                         Value /    Brand                                                                                Brand    Brand                  Value /     Brand                   Value /    Brand
     Rank   Rank                                                                            Enterprise                            Enterprise                            Rank   Rank                                                                                   Enterprise                         Enterprise
                       Brand                Industry        Domicile      Value    Rating                Enterprise   Value                       Enterprise   Rating                          Brand                  Industry        Domicile      Value    Rating                Enterprise   Value                 Enterprise   Rating
     2011   2010                                                                              Value                               Value 2010                            2011   2010                                                                                     Value                            Value 2010
                                                                           2011     2011                   Value       2010                         Value       2010                                                                                 2011     2011                   Value       2010                   Value       2010
                                                                                                            (%)                                    2010 (%)                                                                                                                           (%)                              2010 (%)

     51     77     Movistar        Cellular Telecoms      Spain           14,935   AA       142,731      10%          9,666       203,347         5%           AA+                                            Cosmetics/Personal	
                                                                                                                                                                        76              Olay                                        United States   11,066   AA       35,777       31%
                                                                                                                                                                                                              Care

     52            IKEA            Retail                 Sweden          14,676   A-                          n/a                                                      77      75      Dell                  IT services           United States   10,983   AAA-     18,953       58%          9,750    18,280       53%          AAA-

     53     49     Oracle          Software               United States   14,602   AA       134,787      11%          12,775      105,194         12%          AA+
                                                                                                                                                                        78      48      Allianz               Insurance             Germany         10,898   AA       50,937       21%          12,836   57,334       22%          AA
                                   Electrical
     54     82     Hitachi                                Japan           14,503   BBB       50,569        29%         9,095        21,091           43%        A+      79      67
                                   Compo&Equip                                                                                                                                          Bbva                  Banks                 Spain           10,720   AA       51,233       21%          10,727   69,134       16%          AA-

     55     76     ExxonMobil      Oil&Gas                United States   13,756   AA+      311,832      4%           9,683       329,543         3%           AA                                             Retail-Department
                                                                                                                                                                        80      81      ASDA                                        United States   10,689   AA-      23,005       46%          9,122    30,849       30%          AA
                                                                                                                                                                                                              Stores
     56     68     Nissan          Auto Manufacturers     Japan           13,705   AAA-     69,638       20%          10,412      65,678          16%          AA        81     88      Fedex                 Transportation        United States   10,686   AA       27,779       38%          8,588    26,679       32%          AA-

     57     91     Credit Suisse   Banks                  Switzerland     13,497   AAA-     46,645       29%          8,430       50,468          17%          AA       82     160      Unitedhealth          Healthcare-Services   United States   10,606   AA+      35,660       30%          5,297    17,526       30%          AA

                   Goldman                                                                                                                                                                                    Miscellaneous
     58     38                     Banks                  United States   13,406   AAA-     81,679       16%          13,887      93,316          15%          AAA+     83     122      3M                                          United States   10,532   AA+      64,471       16%          6,551    57,572       11%          AA
                   Sachs                                                                                                                                                                                      Manufactur

     59     78     Bank of China   Banks                  China           13,257   AA+      131,499      10%          9,615       149,395         6%           AA       84     103      E.ON                  Electric              Germany         10,513   A+       105,505      10%          7,590    68,253       11%          AA-

     60     57     JP	Morgan       Banks                  United States   13,241   AA-      66,615       20%          11,732      102,425         11%          AA-      85      64      NTT                   Telecoms Services     Japan           10,338   AA       60,334       17%          11,247   79,787       14%          AA+

     61     52     Sony            Home Furnishings       Japan           13,194   AAA-     28,994       46%          12,648      30,684          41%          AAA                                            Cosmetics/Personal	
                                                                                                                                                                        86      71      Avon                                        United States   10,171   AA+      15,843       64%          9,917    16,134       61%          AA-
                                                                                                                                                                                                              Care
     62     47     GDF Suez        Electric               France          12,902   AA       132,442      10%          12,878      146,131         9%           A+                                             Commercial
                                                                                                                                                                        87      89      KPMG                                        Netherlands     10,160   AAA-                  n/a          8,507                              AAA-
                                                                                                                                                                                                              Services
                   VW	
     63     61                     Auto Manufacturers     Germany         12,705   A+       82,447       15%          11,468      82,209          14%          AA+
                   (Volkswagen)                                                                                                                                         88      95      UBS                   Banks                 Switzerland     9,915    AA       67,481       15%          8,261    62,240       13%          AA-

     64     158    Panasonic       Home Furnishings       Japan           12,525   AA       44,793       28%          5,438       18,358          30%          AA                                             Retail-Clothing &
                                                                                                                                                                        89      94      H&M                                         Sweden          9,875    AA       55,629       18%          8,298    45,608       18%          AAA-
                                                                                                                                                                                                              Footwear
     65     58     Sberbank        Banks                  Russia          12,012   AA+      64,329       19%          11,729      51,108          23%          AA+
                                                                                                                                                                        90              NTT	Docomo            Fixed Line            Japan           9,801    AA+      73,144       13%          8,187    64,997       13%
                                   Retail-Department
     66     80     Sam's Club                             United States   11,952   AA-      30,649       39%          9,398       29,302          32%          A+
                                   Stores                                                                                                                               91     107      DHL                   Transportation        Germany         9,778    AA-      21,628       45%          7,304    20,213       36%          AA-
                                   Retail-Department
                                                                                                                                                                                                              Retail-Department
     67     79     Carrefour       Stores/ Mixed          France          11,894   AA       37,959       31%          9,436       35,252          27%          AA+      92      74      Lowe's                                      United States   9,751    AA-      35,502       27%          9,784    35,653       27%          AA-
                                                                                                                                                                                                              Stores
                                   Goods variety stores

     68     56     Comcast         Media                  United States   11,876   AA+      73,693       16%          11,979      65,750          18%          AA+      93      99      EDF                   Utilities             France          9,697    AA       128,306      8%           7,922    139,646      6%           AA+


     69     109    Total           Oil&Gas                France          11,828   A+       147,473      8%           7,218       165,876         4%           AA-      94      21      Nokia                 Peripherals           Finland         9,658    AA       26,908       36%          19,558   48,467       40%          AAA-

                                                                                                                                                                                        Banco do
     70     70     Walgreens       Retail-Drug Store      United States   11,707   AA-      33,395       35%          9,983       28,634          35%          AA-      95     118                            Banks                 Brazil          9,526    AA+      49,565       19%          6,662    43,135       15%          AA+
                                                                                                                                                                                        Brasil

     71     60     Cisco           Telecoms Services      United States   11,667   AA-      90,446       13%          11,480      110,003         10%          AA+      96      84      Generali              Insurance             Italy           9,487    AA       23,730       40%          11,588   40,360       29%          AA

                                                                                                                                                                                                              Office/Business
     72     69     T-Mobile        Cellular Telecoms      Germany         11,553   AA       75,976       15%          10,126      140,070         7%           AA       97     126      Canon                                       Japan           9,372    AAA-     55,438       17%          6,421    47,061       14%          AA+
                                                                                                                                                                                                              Equip
                                   Commercial                                                                                                                           98     101
     73     72     PwC                                    United States   11,445   AAA+                  n/a          9,908                                    AAA                      CVS                   Retail-Drug Store     United States   9,286    AA-      23,379       40%          7,881    25,744       31%          AA-
                                   Services
                                                                                                                                                                                        Agricultural
      74    83     Toshiba         Electronics            Japan           11,136   AA-      23,199       48%          8,949       23,257          38%          AA       99                                    Banks                 China           9,283    A+       134,233      7%           6,032                              A+
                                                                                                                                                                                        Bank of China

     75     63     Heineken        Beverages              Netherlands     11,108   AAA-     25,314       44%          11,435      29,490          39%          AAA-     100    112      Boeing                Aerospace/Defense     United States   9,213    AA       54,226       17%          7,058    42,824       16%          AA


                                                                                                                               All values in USD $ Millions                    All values in USD $ Millions
69                                                                                                                             © Brand Finance plc 2011                        © Brand Finance plc 2011                                                                                                                                   70
BrandFinance ®
                                                                                                                                                                                                                                                           Global 500 2011

                                                                                                         Brand                                     Brand                                                                                                                          Brand                              Brand
                                                                          Brand   Brand                  Value /     Brand                         Value /    Brand                                                                                Brand   Brand                  Value /     Brand                  Value /    Brand
     Rank   Rank                                                                           Enterprise                            Enterprise                            Rank   Rank                                                                                  Enterprise                        Enterprise
                         Brand              Industry        Domicile      Value   Rating                Enterprise   Value                       Enterprise   Rating                          Brand                  Industry        Domicile      Value   Rating                Enterprise   Value                Enterprise   Rating
     2011   2010                                                                             Value                               Value 2010                            2011   2010                                                                                    Value                           Value 2010
                                                                           2011    2011                   Value       2010                         Value       2010                                                                                 2011    2011                   Value       2010                  Value       2010
                                                                                                           (%)                                    2010 (%)                                                                                                                          (%)                             2010 (%)
                   China Life                                                                                                                                                          Standard
                                                                                                                                                                       126    106                            Banks                 Britain         7,419   AAA-     n/a          n/a          7,332   51,466       14%          AAA-
     101    222    Insurance        Insurance             China           9,212   AA-      209,407      4%           3,714       131,323         3%           AA                       Chartered
                   Company
                                                                                                                                                                       127    119      TEPCO                 Electric              Japan           7,365   AA       115,171      6%           6,653   59,053       11%          AA-
     102    87     BT               Telecoms Services     Britain         9,061   AA+      31,987       28%          8,685       36,240          24%          AA
                                                                                                                                                                       128    127      MUFJ                  Banks                 Japan           7,336   A+       66,317       11%          6,393   56,607       11%          A+
     103    93     Philips          Electronics           Netherlands     9,033   AAA      31,807       28%          8,321       27,095          31%          AA+
                                                                                                                                                                       129    115      China Telecom         Telecoms Services     China           7,261   AA-      53,470       14%          7,027   46,824       15%          AA+
     104    53     BP               Oil&Gas               Britain         8,754   BB       131,470      7%           12,114      178,840         7%           AA+
                                                                                                                                                                       130    202      Sinopec               Oil&Gas               China           7,135   BBB      139,983      5%           4,152   175,678      2%           A-
     105    113    ING              Insurance             Netherlands     8,703   AA       40,835       21%          7,051       27,610          26%          AA
                                                                                                                                                                                       Royal Bank of
                                                                                                                                                                       131    165                            Banks                 Canada          7,069   AA+      76,612       9%           5,170   71,697       7%           AA
     106    148    Petrobras        Oil&Gas               Brazil          8,697   AA+      262,224      3%           5,592       245,460         2%           A+                       Canada
                                                                                                                                                                                       Johnson &
                                                                                                                                                                       132     86                            Healthcare-Products   United States   7,037   AA       63,663       11%          8,715   85,322       10%          AA+
     107    90     Time Warner      Media                 United States   8,571   AA+      40,612       21%          8,469       32,817          26%          AA+                      Johnson

                                                                                                                                                                       133    108      Reliance              Oil&Gas               India           6,994   A+       86,811       8%           7,250   87,758       8%           AA-
     108    171    DIRECTV          Media                 United States   8,548   AA+      40,765       21%          5,065       17,230          29%          AA
                                                                                                                                                                                       Morgan
                   Mclane                                                                                                                                              134    100                            Banks                 United States   6,857   AA-      35,022       20%          7,907   45,931       17%          A+
     109                            Retail Wholesale      United States   8,528   AA       57,368       15%                                                                            Stanley
                   Company
                                                                                                                                                                                                             Commercial
     110    85     Telecom Italia   Telecoms Services     Italy           8,315   AA+      58,992       14%          8,866       83,993          11%          AA+      135    124      Ernst & Young                               United States   6,848   AAA-                  n/a          6,480                             AAA-
                                                                                                                                                                                                             Services

     111    183    Iberdrola        Electric              Spain           8,221   AA+      53,769       15%          4,575       66,322          7%           AA+      136    168      Yahoo!                Internet              United States   6,804   AA-      36,911       18%          5,116   17,178       30%          AA

                   Société	                                                                                                                                            137    481      NTT	Data              Computers             Japan           6,788   AA       142,139      5%           1,967   10,511       19%          AA
     112    59                      Banks                 France          8,153   AA-      30,080       27%          8,635       33,303          26%          AA-
                   Générale
                                                                                                                                                                       138    128      Enel                  Electric              Italy           6,758   AA       114,972      6%           6,380   122,657      5%           AA
     113    104    SAP              Software              Germany         8,037   AAA-     60,809       13%          7,584       58,380          13%          AAA-

                                                                                                                                                                       139    144      Adidas                Apparel               Germany         6,754   AAA-     10,631       64%          5,702   11,232       51%          AAA-
     114    175    PetroChina       Oil&Gas               China           8,031   AA       217,182      4%           4,879       257,844         2%           AA-

                                                                                                                                                                       140    130      FOX                   Media                 United States   6,746   AA       23,757       28%          6,277   21,185       30%          AA
     115    166    eBay             Internet              United States   8,002   AAA      17,711       45%          5,148       18,756          27%          AAA-

                                    Machinery-                                                                                                                         141    192      Peugeot               Auto Manufacturers    France          6,625   AA-      19,514       34%          4,485   23,769       19%          AA
     116    135    Caterpillar                            United States   7,911   AA+      76,633       10%          6,189       64,826          10%          AAA-
                                    Constr&Mining
                                    Commercial                                                                                                                         142     92      UniCredit             Banks                 Italy           6,621   AA-      24,315       27%          5,325   28,524       19%          A+
     117    105    Deloitte                               United States   7,841   AAA                   n/a          7,374                                    AA
                                    Services
                                                                                                                                                                                       Toronto-
     118    114    Renault          Auto Manufacturers    France          7,801   AA       40,284       19%          7,042       42,880          16%          AA       143    164      Dominion              Banks                 Canada          6,604   AA-      63,962       10%          5,179   50,040       10%          AA+
                                                                                                                                                                                       Bank
                                    Cosmetics/Personal	
     119           Gillette                               United States   7,784   AAA-     20,237       38%                                                            144    129      Sainsbury             Retail-Food           Britain         6,595   A+       13,818       48%          6,346   12,754       50%          A+
                                    Care
                                    Commercial                                                                                                                                                               Cosmetics/Personal	
     120           McKinsey                               United States   7,728   AAA-     18,000       43%                                                            145    251      Nivea                                       Germany         6,569   AA+      10,178       65%          3,424   7,982        43%          AA
                                    Services                                                                                                                                                                 Care
                                    Cosmetics/Personal	                                                                                                                146    137      O2                    Cellular Telecoms     Spain           6,558   AAA-     44,407       15%          6,117   203,347      3%           AA+
     121    32     L'Oréal                                France          7,630   AAA-     23,935       32%          5,809       24,205          24%          AAA-
                                    Care
                                                                                                                                                                                                             Commercial
     122    98     Kellogg's        Food                  United States   7,507   AAA+     23,521       32%          7,982       24,725          32%          AAA+     147    173      Visa                                        United States   6,555   AAA-     48,779       13%          5,037   55,159       9%           AAA-
                                                                                                                                                                                                             Services

     123    111    Zurich           Insurance             Switzerland     7,463   AA       30,600       24%          7,160       29,948          24%          AA                                             Retail-Consumer
                                                                                                                                                                       148    140      Best Buy                                    United States   6,534   A+       14,187       46%          6,000   16,228       37%          A+
                                                                                                                                                                                                             Electronics

     124    139    Woolworths       Food                  Australia       7,443   AA       31,092       24%          6,003       25,805          23%          AA       149             Saint Gobain          Building Materials    France          6,507   AA       36,143       18%

     125    146    Rabobank         Banks                 Netherlands     7,423   AA-      n/a          n/a          5,627                                    AA+      150    123      Danone                Food                  France          6,458   AAA-     25,788       25%          6,544   35,464       18%          AAA-


                                                                                                                              All values in USD $ Millions                    All values in USD $ Millions
71                                                                                                                            © Brand Finance plc 2011                        © Brand Finance plc 2011                                                                                                                                 72
BrandFinance ®
                                                                                                                                                                                                                                                          Global 500 2011

                                                                                                         Brand                                    Brand                                                                                                                          Brand                              Brand
                                                                          Brand   Brand                  Value /     Brand                        Value /    Brand                                                                                Brand   Brand                  Value /     Brand                  Value /    Brand
     Rank   Rank                                                                           Enterprise                           Enterprise                            Rank   Rank                                                                                  Enterprise                        Enterprise
                         Brand              Industry        Domicile      Value   Rating                Enterprise   Value                      Enterprise   Rating                         Brand                   Industry        Domicile      Value   Rating                Enterprise   Value                Enterprise   Rating
     2011   2010                                                                             Value                              Value 2010                            2011   2010                                                                                    Value                           Value 2010
                                                                           2011    2011                   Value       2010                        Value       2010                                                                                 2011    2011                   Value       2010                  Value       2010
                                                                                                           (%)                                   2010 (%)                                                                                                                          (%)                             2010 (%)

     151    169    ConocoPhillips   Oil&Gas               United States   6,392   AA-      111,423      6%           5,085      107,215         5%           A+       176    250      Eni                   Oil&Gas               Italy           5,571   AA       85,268       7%           3,440   94,872       4%           AA

                                    Retail-Department                                                                                                                 177    167      NEC                   Electronics           Japan           5,553   A+       13,002       43%          5,129   12,628       41%          AA-
     152    201    Aeon                                   Japan           6,368   AA-      14,599       44%          4,153      12,654          33%          AA-
                                    Stores
                                                                                                                                                                                                            Distribution/
     153           Neutrogena       Healthcare-Products   United States   6,350   AAA      14,467       44%                                                           178             Mitsui                                      Japan           5,551   AA       56,337       10%
                                                                                                                                                                                                            Wholesale

     154    143    China Unicom     Telecoms Services     China           6,315   A+       44,435       14%          5,704      36,222          16%          A+       179    177      Sharp                 Home Furnishings      Japan           5,517   AA-      17,967       31%          4,805   18,279       26%          AA

     155    156    Vinci                                  France          6,208   AA+      45,100       14%          5,449      42,609          13%          AA                       Sumitomo
                                                                                                                                                                                      Mitsui
                                                                                                                                                                      180    246                            Banks                 Japan           5,512   A+       37,945       15%          3,462   33,857       10%          A
                                                                                                                                                                                      Financial
     156    141    Aviva            Insurance             Britain         6,175   AA       15,377       40%          5,882      17,105          34%          A+                       Group

     157    154    Accenture        IT services           Ireland         6,169   A+       27,774       22%          5,501      26,262          21%          A+       181             Marlboro              Tobacco               United States   5,510   AA+      65,733       8%

                   Thomson                                                                                                                                            182     110     Ericsson              Telecoms Services     Sweden          5,504   AA-      23,530       23%          5,697   19,275       30%          AA
     158    315                     Media                 United States   6,164   AA       37,663       16%          2,880      13,935          21%          AA
                   Reuters

     159    210    BHP	Billiton     Mining                Britain         6,111   AA-      432,338      1%           4,034      203,610         2%           AA       183    273      Bank Of               Banks                 China           5,476   AA-      56,876       10%          3,269   64,383       5%           AA

                                                                                                                                                                                                            Retail-Restaurants/
     160    150    Morrison         Food                  Britain         6,101   AA       14,036       43%          5,581      13,716          41%          AA       184    163      Starbucks                                   United States   5,462   AA       15,446       35%          5,187   14,861       35%          AA-
                                                                                                                                                                                                            Pubs
                                                                                                                                                                                                            Commercial
     161    178    Metro            Retail Wholesale      Germany         6,098   A+       15,418       40%          4,776      16,120          30%          AA-      185    286      Randstad                                    Netherlands     5,451   AA+      9,775        56%          3,163   9,171        34%          A+
                                                                                                                                                                                                            Services

     162    136    T-Home           Telecoms Services     Germany         6,085   AA-      36,722       17%          6,121      140,070         4%            AA-     186    172      Kroger                Food                  United States   5,442   AA-      9,545        57%          5,049   8,818        57%          AA-

                                    Retail-Department
     163    131    Costco                                 United States   6,067   AA-      25,946       23%          6,259      24,782          25%          AA-      187    220      U.S. Bank             Banks                 United States   5,416   AA       42,868       13%          3,777   45,984       8%           AA
                                    Stores
                                    Retail-Department                                                                                                                 188    231      Petronas              Oil&Gas               Malaysia        5,352   AAA-                  n/a          3,578   48,553       7%           AAA
     164    189    Macy's                                 United States   6,027   AA-      15,341       39%          4,533      13,572          33%          AA-
                                    Stores
                                    Miscellaneous                                                                                                                                                           Holding Companies-
     165    195    Honeywell                              United States   6,006   AA-      39,112       15%          4,351      35,077          12%          AA-      189    230      Jardines                                    Hong Kong       5,162   AA-      24,387       21%          3,594   17,146       21%          AA-
                                    Manufactur                                                                                                                                                              Divers

                   Schneider        Electrical                                                                                                                        190             Union	Pacific         Transportation        United States   5,125   AA       50,157       10%
     166                                                  France          5,870   AA+      41,030       14%
                   Electric         Compo&Equip
                                                                                                                                                                      191             Oi                    Cellular Telecoms     Brazil          5,046   AA+      25,515       20%          4,342   24,913       17%          AA
     167    277    Sky              Media                 Britain         5,782   AAA-     21,851       26%          3,231                                   AA
                                                                                                                                                                                                            Distribution/
                                    Electrical                                                                                                                        192             Itochu                                      Japan           5,045   AA       40,060       13%
     168    203    LG                                     South Korea     5,767   A+       30,720       19%          4,149      11,867          35%          AA+                                            Wholesale
                                    Compo&Equip
                                                                                                                                                                                      China State
                                                                                                                                                                      193    247                                                  China           5,018   A        21,765       23%          3,459   19,143       18%          AA-
     169    191    Nordea           Banks                 Sweden          5,741   AA+      43,856       13%          4,509      43,057          10%          AA                       Construction

                                    Cosmetics/Personal	                                                                                                               194    260      PNC                   Banks                 United States   4,993   AA       27,899       18%          3,383   23,236       15%          AA-
     170           Lancôme                                France          5,685   AA+      12,300       46%
                                    Care
                                                                                                                                                                                                            Miscellaneous
                   State Bank of                                                                                                                                      195    405      Bombardier                                  Canada          4,980   A+       11,382       44%          2,318   9,342        25%          A+
     171    187                     Banks                 India           5,670   AAA-     46,417       12%          4,551      29,809          15%          AA+                                            Manufactur
                   India
                                                                                                                                                                      196             Heinz                 Food                  United States   4,952   AA-      19,375       26%
     172    155    Fujitsu          IT services           Japan           5,634   AA-      17,743       32%          5,497      16,372          34%          AA

                                                                                                                                                                      197    134      RWE                   Utilities             Germany         4,928   A+       38,922       13%          6,194   59,716       10%          AA
     173    188    Softbank         Telecoms Services     Japan           5,587   AA-      62,877       9%           4,539      54,353          8%           AA-

                   The co-                                                                                                                                            198    198      Nescafé               Beverages             Switzerland     4,927   AA       23,201       21%          4,297   19,109       22%          AA-
     174                            Food                  Britain         5,587   AA-                   n/a          4,660                                   A+
                   operative
                                                                                                                                                                                      NBC	
                                                                                                                                                                      199                                   Media                 United States   4,923   A        52,785       9%
     175    133    Motorola         Telecoms Services     United States   5,585   AA       15,359       36%          6,254      16,098          39%          AA-                      International

                                                                                                                                                                      200    179      MTN                   Telecoms Services     South Africa    4,920   AAA      34,810       14%          4,693   30,230       16%          AA


                                                                                                                             All values in USD $ Millions                    All values in USD $ Millions
73                                                                                                                           © Brand Finance plc 2011                        © Brand Finance plc 2011                                                                                                                                74
BrandFinance ®
                                                                                                                                                                                                                                                           Global 500 2011

                                                                                                          Brand                                    Brand                                                                                                                          Brand                              Brand
                                                                           Brand   Brand                  Value /     Brand                        Value /    Brand                                                                                Brand   Brand                  Value /     Brand                  Value /    Brand
     Rank   Rank                                                                            Enterprise                           Enterprise                            Rank   Rank                                                                                  Enterprise                        Enterprise
                          Brand            Industry          Domicile      Value   Rating                Enterprise   Value                      Enterprise   Rating                          Brand                  Industry        Domicile      Value   Rating                Enterprise   Value                Enterprise   Rating
     2011   2010                                                                              Value                              Value 2010                            2011   2010                                                                                    Value                           Value 2010
                                                                            2011    2011                   Value       2010                        Value       2010                                                                                 2011    2011                   Value       2010                  Value       2010
                                                                                                            (%)                                   2010 (%)                                                                                                                          (%)                             2010 (%)
                                    Household                                                                                                                          226    184      Sysco                 Food                  United States   4,447   A+       14,721       30%          4,570   13,853       33%          AA-
     201    209    Kimberly-Clark                          United States   4,833   AA+      20,129       24%          4,045      20,302          20%          AA+
                                    Products/Wares
                                    Consumer                                                                                                                                                                 Distribution/
     202    248    EMC2                                    United States   4,828   AA       33,748       14%          3,447      28,558          12%          AA       227             Marubeni                                    Japan           4,433   AA-      33,882       13%
                                    Electronics                                                                                                                                                              Wholesale

                   Publix	Super	    Retail - Food                                                                                                                      228    240      Basf                  Chemicals             Germany         4,393   AA+      80,409       5%           3,497   15,345       23%          AA
     203    186                                            United States   4,796   A        n/a          n/a          4,556                                   AA-
                   Markets          Specialists
                                                                                                                                                                       229    176      ArcelorMittal         Iron/Steel            Luxembourg      4,388   AA-      78,440       6%           4,848   87,521       6%           AA-
     204           Prudential       Insurance              Britain         4,780   A+       23,851       20%          4,130      20,385          20%          A+

                                                                                                                                                                       230    213      Hyundai               Auto Manufacturers    South Korea     4,376   AA+      27,836       16%          3,905   13,441       29%          AA-
     205    182    CBS              Media                  United States   4,744   A+       16,553       29%          4,582      14,350          32%          AA-
                                                                                                                                                                                                             Cosmetics/Personal	
     206    197                                                                                                                                                        231             Colgate                                     United States   4,373   A+       16,215       27%
                   Telstra          Telecoms Services      Australia       4,741   AA       40,226       12%          4,308      52,335          8%           AA-                                            Care
                                                                                                                                                                                                             Electrical
     207    159    Safeway          Retail-Food            United States   4,720   AA-      10,328       46%          5,318      11,305          47%          A+       232    303      Emerson                                     United States   4,366   AA       43,840       10%          2,956   34,161       9%           AA+
                                                                                                                                                                                                             Compo&Equip

     208    142    Xbox             Software               United States   4,715   AAA-     16,390       29%          5,744      30,551          19%          AA+      233    204      BlackBerry            Computers             Canada          4,362   AAA-     19,898       22%          4,122   25,859       16%          AAA

     209    145    Gazprom          Oil&Gas                Russia          4,675   AA+      174,148      3%           5,694      188,582         3%           AA+      234             Indian Oil            Oil&Gas               India           4,351   AA-      30,155       14%          4,074   21,429       19%          A+

     210    437    Kraft            Food                   United States   4,644   AA       22,857       20%          2,168      6,277           35%          AA       235    375      Mizuho                Banks                 Japan           4,349   A+       33,214       13%          2,508   28,205       9%           A+

     211    227    Swiss Re         Insurance              Switzerland     4,610   A+       17,775       26%          3,630      15,498          23%          A+       236    282      Suzuki                Auto Manufacturers    Japan           4,320   AA       11,546       37%          3,211   12,689       25%          AA

                                    Retail-Department                                                                                                                  237             Chevrolet             Auto Manufacturers    United States   4,314   AA-      15,481       28%
     212    349    Kohls                                   United States   4,557   AA-      16,032       28%          2,623      6,711           39%          AA-
                                    Stores

     213    219    Medtronic        Healthcare-Products    United States   4,537   AA+      42,863       11%          3,784      52,927          7%           AA       238             Budweiser             Beverages             Belgium         4,304   AA+      15,736       27%


     214           Loblaws          Food                   Canada          4,536   AA-      9,850        46%                                                           239    174      DZ Bank               Banks                 Germany         4,303   AA-      n/a          n/a          4,953                             A


     215    430    Warner Bros.     Media                  United States   4,521   AA-      20,039       23%          2,217      10,939          20%          AA-      240    278      Erste                 Banks                 Austria         4,293   AA       16,084       27%          3,229   13,405       24%          AA-

                                    Retail-Department                                                                                                                  241    426      Vivo                  Cellular Telecoms     Brazil          4,286   AA-      31,399       14%          2,240   15,387       15%          AA-
     216    199    M&S                                     Britain         4,519   AA       13,697       33%          4,285      14,237          30%          AA+
                                    Stores
                                    Toiletries/Personal	                                                                                                               242    233      Veolia                Water                 France          4,268   A+       29,172       15%          3,559   30,962       11%          AA
     217           Dove                                    Britain         4,517   AA       8,715        52%          1,889      6,175           31%          AA
                                    Care
                                                                                                                                                                                                             Distribution/
                                                                                                                                                                       243             Sumitomo                                    Japan           4,260   AA       55,078       8%
     218    229    Metlife          Insurance              United States   4,510   AA-      35,252       13%          3,599      27,989          13%          AA-                                            Wholesale

                                    Retail-Clothing &                                                                                                                  244    216      Swisscom              Telecommunications    Switzerland     4,255   AA       30,565       14%          3,829   30,021       13%          AA-
     219    212    Zara                                    Spain           4,505   A+       31,185       14%          3,963      25,536          16%          AA-
                                    Footwear
                                                                                                                                                                                                             Retail-Office
                                    Electrical                                                                                                                         245    208      Staples                                     United States   4,250   AA-      10,345       41%          4,066   11,742       35%          AA-
     220    256    Sanyo                                   Japan           4,501   AA-      13,440       33%          3,402      12,182          28%          AA-                                            Supplies
                                    Compo&Equip
                                                                                                                                                                       246    205      Beeline               Telecommunications    Russia          4,189   AA+      23,250       18%          4,116   25,255       16%          AA-
     221    121    Munich Re        Insurance              Germany         4,487   AA-      15,924       28%          4,300      18,656          23%          AA-
                                                                                                                                                                                       National	
                                                                                                                                                                       247    207                            Banks                 Australia       4,176   AA-      35,214       12%          4,073   37,072       11%          A+
     222           au               Cellular Telecoms      Japan           4,479   A+       27,613       16%                                                                           Australia Bank

                   Texas            Consumer                                                                                                                           248    382      BNY	Mellon            Banks                 United States   4,156   AA-      32,124       13%          2,477   33,306       7%           A+
     223    275                                            United States   4,461   AA-      31,645       14%          3,260      28,858          11%          AA-
                   Instruments      Electronics
                                                                                                                                                                                       Media Markt &         Retail-Consumer
                                                                                                                                                                       249    266                                                  Germany         4,134   AA-      8,833        47%          3,327   9,235        36%          A+
     224    308    Citroën          Auto Manufacturers     France          4,456   AA-      16,688       27%          2,937      16,890          17%          AA-                      Saturn                Electronics

                                                                                                                                                                       250    360      Scotiabank            Banks                 Canada          4,120   AA-      52,473       8%           2,579   42,689       6%           A
     225    194    Fiat             Auto Manufacturers     Italy           4,447   A+       15,173       29%          4,439      16,564          27%          AA-


                                                                                                                              All values in USD $ Millions                    All values in USD $ Millions
75                                                                                                                            © Brand Finance plc 2011                        © Brand Finance plc 2011                                                                                                                                76
BrandFinance ®
                                                                                                                                                                                                                                                          Global 500 2011

                                                                                                        Brand                                    Brand                                                                                                                           Brand                               Brand
                                                                         Brand   Brand                  Value /     Brand                        Value /    Brand                                                                                 Brand   Brand                  Value /     Brand                   Value /    Brand
     Rank   Rank                                                                          Enterprise                           Enterprise                            Rank   Rank                                                                                   Enterprise                         Enterprise
                         Brand             Industry        Domicile      Value   Rating                Enterprise   Value                      Enterprise   Rating                          Brand                  Industry         Domicile      Value   Rating                Enterprise   Value                 Enterprise   Rating
     2011   2010                                                                            Value                              Value 2010                            2011   2010                                                                                     Value                            Value 2010
                                                                          2011    2011                   Value       2010                        Value       2010                                                                                  2011    2011                   Value       2010                   Value       2010
                                                                                                          (%)                                   2010 (%)                                                                                                                           (%)                              2010 (%)

     251           SFR             Media                 France          4,101   AA+      24,870       16%                                                           276    259      STATOIL               Oil&Gas                Norway          3,758   A+       72,716       5%           3,387    90,928       4%           A+

     252           Purina          Nutrition             Switzerland     4,099   A        28,416       14%                                                                           Singapore
                                                                                                                                                                     277    225                            Airlines               Singapore       3,757   AAA-     12,158       31%          3,654    10,281       36%          AAA
                                                                                                                                                                                     Airline

     253    353    Airbus          Aerospace/Defense     Netherlands     4,080   AA       9,862        41%          2,605      5,205           50%          A+       278    488      Vale                  Mining                 Brazil          3,749   A+       185,138      2%           1,937    153,418      1%           A

                   CNP	
     254    161                    Insurance             France          4,058   A+       11,443       35%          5,272      15,973          33%          AA-      279    257      Audi                  Auto Manufacturers     Germany         3,739   AA-      23,614       16%          3,398                              AA-
                   Assurances

     255           Coles           Retail-Food           Australia       4,056   AA       23,272       17%                                                           280    181      Crédit	Agricole       Banks                  France          3,706   AA-      13,251       28%          4,617    21,076       22%          A+

     256    385    Allstate        Insurance             United States   4,045   AA-      17,450       23%          2,455      13,717          18%          AA-      281             Bell                  Telecom Services       Canada          3,702   AA       31,137       12%          3,364    31,922       11%          AA-

     257           BAE Systems     Aerospace/Defense     Britain         4,042   AA-      20,665       20%                                                           282    193      EDP                   Electric               Portugal        3,692   AA-      36,319       10%          4,449    41,608       11%          AA

     258           BBC             Media                 Britain         4,019   AAA-                  n/a          3,648                                   AA+      283             Facebook              Internet               United States   3,690   A                     n/a

                                   Holding Companies-                                                                                                                284             Bharti Airtel         Telecoms Services      India           3,686   AA-      28,861       13%          3,159    27,737       11%          AA
     259    270    Louis	Vuitton                         France          3,996   AAA      10,377       39%          3,293      8,029           41%          AAA
                                   Divers

     260           SPC             Oil&Gas               China           3,990   AA-      93,078       4%                                                            285    288      KEPCO                 Electric               South Korea     3,683   AA-      38,097       10%          3,160    36,351       9%           A+

                                                                                                                                                                                     Nokia	Siemens	
     261    224    ABB                                   Switzerland     3,950   AA       44,890       9%           3,690      38,454          10%          A+       286                            Telecoms Services             Finland         3,664   AA       11,148       33%
                                                                                                                                                                                     Network
                   Fresenius                                                                                                                                         287    373      Carlsberg             Beverages              Denmark         3,646   AA+      9,561        38%          2,525    7,991        32%          AA
     262    294                    Healthcare-Services   Germany         3,949   AA       24,162       16%          3,027      21,830          14%          AA
                   Medical Care

     263    312    Deutsche	Post   Transportation        Germany         3,949   A        5,407        73%          2,892      7,124           41%          AA-      288    402      Rogers                Telecoms Services      Canada          3,643   AA+      30,564       12%          2,344    24,929       9%           AA

                                   Commercial                                                                                                                        289    314      Aetna                 Healthcare-Services    United States   3,632   AA       13,046       28%          2,885    12,412       23%          AA-
     264           Mastercard                            United States   3,931   AA+      25,753       15%          3,186      28,521          11%          AA+
                                   Services
                                                                                                                                                                                     Bank of
                                   Toys/Games/
     265    120    Nintendo                              Japan           3,928   AA+      11,056       36%          6,585      23,536          28%          AAA-     290             America               Banks                  United States   3,629   A        13,355       27%          2,694    18,193       15%          A+
                                   Hobbies
                                                                                                                                                                                     Merrill Lynch
     266           WPP             Media                 Ireland         3,922   A+       19,157       20%
                                                                                                                                                                     291             Emirates              Airlines               Uae             3,622   AAA-                  n/a          3,518    12,131       29%          AAA-

     267    218    Telenor         Telecoms Services     Norway          3,918   AA-      21,036       19%          3,813      30,355          13%          A+
                                                                                                                                                                     292    324      Rio Tinto             Mining                 Britain         3,613   AA-      157,461      2%           2,838    160,719      2%           A+
                                   Retail-Department
     268    410    7-Eleven                              Japan           3,905   AA       7,927        49%          2,302      8,731           26%          A+                                             Retail-Department
                                   Stores
                                                                                                                                                                     293             Champion              Stores/ Mixed          France          3,603   A        7,435        48%
                   Mountain Dew                                                                                                                                                                            Goods variety stores
     269                           Beverages             United States   3,882   AA       19,854       20%
                   / Mtn Dew
                                                                                                                                                                     294    268      Kit Kat               Food                   Switzerland     3,594   AA-      20,549       17%          3,307    22,117       15%          AA-
     270    211    Aegon           Insurance             Netherlands     3,874   AA-      10,736       36%          3,986      11,575          34%          AA
                                                                                                                                                                                                           Miscellaneous
                                                                                                                                                                     295    449      Fujifilm                                     Japan           3,586   AA       16,989       21%          2,131    10,866       20%          AA
                                                                                                                                                                                                           Manufactur
     271    244                    Banks                 Australia       3,858   AAA-     54,746       7%           3,475      59,573          6%           AA+
                                                                                                                                                                     296    336      Capital One           Banks                  United States   3,584   AA-      17,937       20%          2,758    17,885       15%          A
     272    237    Raytheon        Aerospace/Defense     United States   3,829   AA       17,084       22%          3,514      19,702          18%          AA
                                                                                                                                                                     297    414      CHUBU                 Electric                     Japan     3,579       AA    46,266            8%      2,285    24,048        10%            AA
     273    276    Ping	An         Insurance             China           3,827   AA       71,399       5%           3,237      64,228          5%           AA-
                                                                                                                                                                     298    300      Endesa                Electric               Spain           3,569   AA+      45,653       8%           2,986    57,413       5%           AA-
     274    243    Lufthansa       Airlines              Germany         3,801   AA+      8,592        44%          3,477      8,980           39%          AA-
                                                                                                                                                                     299             British Gas           Utilities              Britain         3,560   A+       17,784       20%          2,415    16,393       15%          A+
                   BMO Financial
     275    334                    Banks                 Canada          3,797   A+       32,990       12%          2,767      26,076          11%          A+
                   Group
                                                                                                                                                                     300    323      Sprint                Telecommunications     United States   3,535   AA       22,929       15%          2,843    27,160       10%          AA-


                                                                                                                            All values in USD $ Millions                    All values in USD $ Millions
77                                                                                                                          © Brand Finance plc 2011                        © Brand Finance plc 2011                                                                                                                                     78
BrandFinance ®
                                                                                                                                                                                                                                                           Global 500 2011

                                                                                                         Brand                                    Brand                                                                                                                           Brand                              Brand
                                                                          Brand   Brand                  Value /     Brand                        Value /    Brand                                                                                 Brand   Brand                  Value /     Brand                  Value /    Brand
     Rank   Rank                                                                           Enterprise                           Enterprise                            Rank   Rank                                                                                   Enterprise                        Enterprise
                         Brand              Industry        Domicile      Value   Rating                Enterprise   Value                      Enterprise   Rating                         Brand                   Industry         Domicile      Value   Rating                Enterprise   Value                Enterprise   Rating
     2011   2010                                                                             Value                              Value 2010                            2011   2010                                                                                     Value                           Value 2010
                                                                           2011    2011                   Value       2010                        Value       2010                                                                                  2011    2011                   Value       2010                  Value       2010
                                                                                                           (%)                                   2010 (%)                                                                                                                           (%)                             2010 (%)

     301    322    TNT              Transportation        Netherlands     3,534   AA       11,765       30%          2,847      12,709          22%          AA-      326    422      CIBC                  Banks                  Canada          3,276   A+       29,149       11%          2,255   22,201       10%          A+

     302    264    QVC              Internet              United States   3,526   A        9,512        37%          3,332      8,471           39%          AA-                                            Cosmetics/Personal	
                                                                                                                                                                      327             Chanel                                       France          3,272   AAA      n/a          n/a
                                                                                                                                                                                                            Care
                                    Auto
     303    267    Bridgestone                            Japan           3,511   AA-      20,021       18%          3,325      20,762          16%          AA       328             CAP	GEMINI            Computers              France          3,271   AA       7,047        46%
                                    Parts&Equipment

     304    280    Gatorade         Food                  United States   3,505   AA-      20,094       17%          3,225      17,713          18%          AA-      329    337      Amstel                Beverages              Netherlands     3,263   AA       8,438        39%          2,721   7,372        37%          A+

     305    302    Alcatel-Lucent   Telecoms Services     France          3,461   A+       8,992        38%          2,967      7,788           38%          A        330    429      Maersk                Transportation         Denmark         3,250   AA+      55,256       6%           2,222   53,288       4%           A-

     306    318    MTS              Cellular Telecoms     Russia          3,458   AA-      22,902       15%          2,869      18,054          16%          AA-      331             PSEG                  Electric               United States   3,250   A        25,998       13%

     307    263    Claro            Telecommunications    Mexico          3,447   AA-      48,698       7%           3,334      84,020          4%           A+                       Nestlé	Pure	
                                                                                                                                                                      332    258                            Baby Food              Switzerland     3,213   A        19,909       16%          3,397   17,143       20%          A
                                                                                                                                                                                      Life
                                    Auto                                                                                                                                              China
     308    279    Michelin                               France          3,437   AA-      17,902       19%          3,228      16,951          19%          AA+
                                    Parts&Equipment                                                                                                                   333    432      Merchants             Banks                  China           3,189   A+       43,803       7%           2,212   49,803       4%           AA-
                                                                                                                                                                                      Bank
     309    255    MOL              Transportation        Japan           3,415   AA       16,398       21%          3,402      15,399          22%          AA-
                                                                                                                                                                                                            Toiletries/Personal	
                                                                                                                                                                      334             Lux                                          Britain         3,177   AA-      4,405        72%
                                                                                                                                                                                                            Care
     310    354    State Street     Banks                 United States   3,411   AA-      19,407       18%          2,598      21,483          12%          AA-
                                                                                                                                                                                      Southern
                                    Commercial                                                                                                                        335                                   Electric               United States   3,170   AA+      52,531       6%
     311    301    Adecco                                 Switzerland     3,404   AA-      10,450       33%          2,974      9,374           32%          AA-                      Company
                                    Services
                                                                                                                                                                      336             Sony Ericsson         Communications         Sweden          3,165   A+       14,432       22%          3,697   24,415       15%          A+
                   Johnson          Auto
     312    217                                           United States   3,393   AA-      24,098       14%          3,814      21,557          18%          AA
                   Controls         Parts&Equipment
                                                                                                                                                                                      Polo	Ralph	
                                                                                                                                                                      337    305                            Apparel                United States   3,162   AA-      6,223        51%          2,952   5,269        56%          AA-
                                                                                                                                                                                      Lauren
     313    417    Nippon	Steel     Iron/Steel            Japan           3,391   AA       43,576       8%           2,269      46,406          5%           AA
                                                                                                                                                                                      Berkshire
                                                                                                                                                                      338                                   Insurance              United States   3,159   AA       204,886      2%
     314    272    Westpac          Banks                 Australia       3,384   AA       42,512       8%           3,280      54,116          6%           AA+                      Hathaway

                                                                                                                                                                      339    296      Hermes                Apparel                France          3,151   AA+      24,410       13%          3,003   14,777       20%          AAA-
     315    271    JR-East          Transportation        Japan           3,373   AA       24,162       14%          3,292      31,067          11%          AA

                                                                                                                                                                      340    330      MAPFRE                Insurance              Spain           3,148   A        9,387        34%          2,799   13,281       21%          A-
     316           DISH	Network     Media                 United States   3,366   AA-      12,604       27%

                                                                                                                                                                      341    221      Asahi                 Beverages              Japan           3,134   AA+      7,816        40%          3,734   9,101        41%          AAA-
     317    325    RBS              Banks                 Britain         3,346   A        41,406       8%           2,838      20,520          14%          A-

                                                                                                                                                                      342             Wellpoint             Healthcare-Services    United States   3,125   AA       11,847       26%
     318           Playstation      Gaming                Japan           3,341   A        2,868        116%
                                                                                                                                                                                                            Machinery-
                                                                                                                                                                      343             John Deere                                   United States   3,122   AA+      52,140       6%
     319    357    Lloyds TSB       Banks                 Britain         3,332   A        24,477       14%          2,595      11,567          22%          A                                              Diversified

                                    Toys/Games/                                                                                                                       344             Conagra               Food                   United States   3,115   AA-      12,280       25%
     320           Wii                                    Japan           3,324   AA-      12,813       26%
                                    Hobbies
                                                                                                                                                                      345    378      Wilmar                Agriculture            Singapore       3,101   AA       23,665       13%          2,498   21,953       11%          AA-
     321    310    Cigna            Healthcare-Services   United States   3,310   AA-      7,721        43%          2,918      7,356           40%          AA-

                                                                                                                                                                      346             Delta                 Airlines               United States   3,100   AA       20,306       15%
     322           MTV	Networks	 Media                    United States   3,304   AA-      15,355       22%

                   International    Forest                                                                                                                            347             OMV                   Oil&Gas                Austria         3,096   A+       18,202       17%
     323    249                                           United States   3,304   AA       17,071       19%          3,441      19,231          18%          AA+
                   Paper            Products&Paper
                                                                                                                                                                                      Bharat
                                                                                                                                                                      348    306                            Oil&Gas                India           3,090   AA       8,922        35%          2,945   8,497        35%          AA-
     324           NYK              Transportation        Japan           3,303   AA       16,698       20%                                                                           Petroleum

                                                                                                                                                                      349    287      Lukoil                Oil&Gas                Russia          3,089   AA       55,497       6%           3,161   59,085       5%           A+
     325    471    C.H. Robinson    Transportation        United States   3,277   AA-      11,609       28%          2,020      8,963           23%          AA-
                                                                                                                                                                                      Thermofisher
                                                                                                                                                                      350    361                            Electronics            United States   3,080   AA       20,214       15%          2,579   19,563       13%          AA
                                                                                                                                                                                      Scientific


                                                                                                                             All values in USD $ Millions                    All values in USD $ Millions
79                                                                                                                           © Brand Finance plc 2011                        © Brand Finance plc 2011                                                                                                                                  80
BrandFinance ®
                                                                                                                                                                                                                                                             Global 500 2011

                                                                                                             Brand                                    Brand                                                                                                                         Brand                              Brand
                                                                              Brand   Brand                  Value /     Brand                        Value /    Brand                                                                               Brand   Brand                  Value /     Brand                  Value /    Brand
     Rank   Rank                                                                               Enterprise                           Enterprise                            Rank   Rank                                                                                 Enterprise                        Enterprise
                         Brand                  Industry        Domicile      Value   Rating                Enterprise   Value                      Enterprise   Rating                         Brand                   Industry       Domicile      Value   Rating                Enterprise   Value                Enterprise   Rating
     2011   2010                                                                                 Value                              Value 2010                            2011   2010                                                                                   Value                           Value 2010
                                                                               2011    2011                   Value       2010                        Value       2010                                                                                2011    2011                   Value       2010                  Value       2010
                                                                                                               (%)                                   2010 (%)                                                                                                                         (%)                             2010 (%)
                   Weston                                                                                                                                                 376    291      Telcel                Cellular Telecoms    Mexico          2,930   A        46,380       6%           3,069   84,020       4%           A+
     351                                Food                  Canada          3,075   AA       8,808        35%
                   (George)

     352    465    BB&T                 Banks                 United States   3,067   AA+      16,679       18%          2,056      17,472          12%          AA       377    420      Marathon              Oil&Gas              United States   2,928   AA-      30,893       9%           2,261   30,406       7%           A+

                                                                                                                                                                                          Enbw Energie
     353    236    Commerzbank          Banks                 Germany         3,067   AA+      7,579        40%          3,521      11,066          32%          A+       378                                   Electric             Germany         2,917   A        18,558       16%
                                                                                                                                                                                          Bad

     354    241    Holcim               Building Materials    Switzerland     3,054   AAA-     36,944       8%           3,497      39,541          9%           AAA-     379    321      T-Systems             Telecoms Services    Germany         2,916   AA-      13,833       21%          2,847   140,070      2%           A+

     355    132    Pfizer	              Pharmaceuticals       United States   3,037   AAA-     164,528      2%           6,257      106,931         6%           AA+      380             Bayer                 Chemicals            Germany         2,912   AA-      75,755       4%

                                        Cosmetics/Personal	                                                                                                                                                     Consumer
     356    372    Estee Lauder                               United States   3,037   AA       5,095        60%          2,531      3,800           67%          A+       381    424      Infosys                                    India           2,908   AA+      37,963       8%           2,246   27,112       8%           AA+
                                        Care                                                                                                                                                                    Electronics

     357    445    Casino               Retail Wholesale      France          3,033   A        6,292        48%          2,153      6,711           32%          A+       382             Schwarzkopf                                Germany         2,904   A        4,632        63%

     358           ESPN                 Media                 United States   3,031   AA       13,207       23%                                                           383    328      Virgin	Media          Telecoms Services    United States   2,901   AA-      16,249       18%          2,808   14,542       19%          A+

                                        Cosmetics/Personal	                                                                                                               384             Geico                 Insurance            United States   2,881   AA       24,586       12%
     359           Biore                                      Japan           3,014   AA-      5,575        54%
                                        Care
                                                                                                                                                                                          Black &
     360    245    ACS                                        Spain           3,014   AA-      29,342       10%          3,468      30,156          12%          AA       385                                   Hand/Machine Tools   United States   2,870   AA+      11,860       24%
                                                                                                                                                                                          Decker

     361           National	Grid        Electric              Britain         3,012   AA       66,253       5%                                                            386             HESS                  Oil&Gas              United States   2,856   AA-      23,618       12%

     362    352    Etisalat             Cellular Telecoms     Uae             3,002   AA-      19,564       15%          2,607      19,951          13%          AA       387             ABC                   Media                United States   2,851   AA       12,430       23%

                                        Miscellaneous                                                                                                                                     Manulife
     363           Tyco                                       Switzerland     2,987   AA+      20,915       14%                                                           388    235                            Insurance            Canada          2,823   AA       21,577       13%          3,545   22,265       16%          AA
                                        Manufactur                                                                                                                                        Financial

     364    331    ACER                 Computers             Taiwan          2,982   AA-      7,182        42%          2,795      6,849           41%          AA-      389             SunTrust Bank         Banks                United States   2,821   AA-      13,448       21%          1,724   9,539        18%          A+

     365    316    ANZ                  Banks                 Australia       2,977   AA+      50,999       6%           2,873      44,054          7%           AA                                             Auto
                                                                                                                                                                          390    455      Continental                                Germany         2,821   A+       13,461       21%          2,096   12,274       17%          AA-
                                                                                                                                                                                                                Parts&Equipment
                                        Cosmetics/Personal	                                                                                                                               Tropicana
     366    450    Shiseido                                   Japan           2,972   AA+      4,818        62%          2,130      8,042           26%          AA-      391                                   Beverages            United States   2,815   AA       14,458       19%
                                        Care                                                                                                                                              Beverages

     367           HTC                  Peripherals           Taiwan          2,970   A        16,530       18%                                                           392                                   Banks                Italy           2,813   A        11,493       24%          2,434   13,937       17%          A

     368    355    Sandvik              Hand/Machine Tools    Sweden          2,968   AA       20,247       15%          2,597      17,807          15%          A+       393    362      Prudential            Insurance            United States   2,805   A+       24,961       11%          2,578   23,130       11%          AA

                   Scottish &
     369    319                         Electric              Britain         2,958   A+       25,391       12%          2,865      12,629          23%          A-       394             JR-Central            Transportation       Japan           2,797   AA       52,336       5%
                   South

     370    295    Travelers            Insurance             United States   2,956   AA-      24,886       12%          3,025      28,625          11%          AA+      395    383      Qwest                 Fixed Line           United States   2,794   AA-      22,418       12%          2,463   19,416       13%          AA-

     371    327    Danske Bank          Banks                 Denmark         2,948   A+       16,823       18%          2,835      17,014          17%          A+       396    343      POSCO                 Iron/Steel           South Korea     2,788   AA       41,647       7%           2,659   43,429       6%           AA+

     372    404    Rosneft (▼▼▼▼▼▼▼▼)   Oil&Gas               Russia          2,943   A+       90,694       3%           2,324      107,249         2%           A+       397    418      Kia                   Auto Manufacturers   South Korea     2,788   AA       15,240       18%          2,264   8,851        26%          A+

     373    364    Camel                Agriculture           Japan           2,942   A        8,434        35%          2,574      7,120           36%          A        398    274      Cadbury               Confectionery        United States   2,784   AA-      15,510       18%          3,261   21,196       15%          AA-

     374           Volvo                Auto Manufacturers    Sweden          2,941   A+       17,415       17%                                                           399             Aflac                 Insurance            United States   2,783   AA-      25,594       11%          1,837   21,537       9%           AA

     375    345    Mazda                Auto Manufacturers    Japan           2,932   AA-      8,810        33%          2,652      9,804           27%          AA-      400    307      CSC                   Computers            United States   2,779   AA-      8,568        32%          2,943   10,323       29%          A+


                                                                                                                                 All values in USD $ Millions                    All values in USD $ Millions
81                                                                                                                               © Brand Finance plc 2011                        © Brand Finance plc 2011                                                                                                                               82
BrandFinance ®
                                                                                                                                                                                                                                                        Global 500 2011

                                                                                                       Brand                                    Brand                                                                                                                          Brand                              Brand
                                                                        Brand   Brand                  Value /     Brand                        Value /    Brand                                                                                Brand   Brand                  Value /     Brand                  Value /    Brand
     Rank   Rank                                                                         Enterprise                           Enterprise                            Rank   Rank                                                                                  Enterprise                        Enterprise
                         Brand             Industry       Domicile      Value   Rating                Enterprise   Value                      Enterprise   Rating                         Brand                   Industry        Domicile      Value   Rating                Enterprise   Value                Enterprise   Rating
     2011   2010                                                                           Value                              Value 2010                            2011   2010                                                                                    Value                           Value 2010
                                                                         2011    2011                   Value       2010                        Value       2010                                                                                 2011    2011                   Value       2010                  Value       2010
                                                                                                         (%)                                   2010 (%)                                                                                                                          (%)                             2010 (%)

     401    371    Pearson         Media                Britain         2,755   AA-      11,116       25%          2,535      9,607           26%          AA-                                            Retail-Clothing &
                                                                                                                                                                    426    442      GAP                                         United States   2,589   AA       3,686        70%          2,161   5,141        42%          AA+
                                                                                                                                                                                                          Footwear
                   Empresas        Holding Companies-
     402                                                Chile           2,740   AA-      26,427       10%                                                           427                                   Pharmaceuticals       Britain         2,587   AAA-     121,856      2%
                   Copec           Divers

     403           Pao	de	Açucar   Food                 Brazil          2,723   A+       10,840       25%                                                                           Lay’s	Potato	
                                                                                                                                                                    428                                   Food                  United States   2,577   A+       21,564       12%
                                                                                                                                                                                    Chips

     404           Genting         Lodging              Malaysia        2,721   AAA-     15,638       17%          2,583      7,809           33%          AAA-     429    461      Marriott              Lodging               United States   2,576   AA       8,671        30%          2,071   7,031        29%          AA

     405    347    Rolls-Royce     Aerospace/Defense    Britain         2,720   AA-      15,612       17%          2,643      12,230          22%          AA-                      Raiffeisen
                                                                                                                                                                    430             Bank                  Banks                 Austria         2,575   AA-      8,001        32%          1,851   9,729        19%          A
                                                                                                                                                                                    International
     406    408    Schindler       Hand/Machine Tools   Switzerland     2,717   AA       11,538       24%          2,306                                   A+
                                                                                                                                                                    431             Ergo                  Insurance             Germany         2,561   AA-      11,066       23%
     407           Hersheys        Food                 United States   2,715   AA-      12,203       22%
                                                                                                                                                                                    Bed Bath &            Retail-Home
                                                                                                                                                                    432    396                                                  United States   2,559   A        9,515        27%          2,388   8,735        27%          AA-
                                                                                                                                                                                    Beyond                Furnishings
     408    453    CSX             Transportation       United States   2,706   AA       29,087       9%           2,108      25,553          8%           AA-
                                                                                                                                                                                    Lockheed
                                                                                                                                                                    433    397                            Aerospace/Defense     United States   2,555   AA       9,439        27%          2,382   10,676       22%          AA
                                                                                                                                                                                    Martin
     409           FPCC            Oil&Gas              Taiwan          2,690   A        29,754       9%
                                                                                                                                                                    434    460      CN                    Transportation        Canada          2,553   AA+      35,777       7%           2,071   30,803       7%           AA+
                                   Retail-Department
     410    339    J.C	Penney                           United States   2,683   A+       8,832        30%          2,696      8,042           34%          A+                       Tyco
                                   Stores                                                                                                                           435                                   Electronics           Switzerland     2,540   AA       14,026       18%
                                                                                                                                                                                    Electronics
     411    304    Crédit	Mutuel   Banks                France          2,677   AA-      n/a          n/a          2,955                                   A-
                                                                                                                                                                    436             China South           Airlines              China           2,533   AA-      18,274       14%          1,792   15,371       12%          AA
     412           Norfolk         Transportation       United States   2,675   AA       27,838       10%
                                                                                                                                                                    437             Optus                 Cellular Telecoms     Australia       2,530   AA       28,412       9%
     413           Lipton          Beverages            Britain         2,669   A        5,938        45%
                                                                                                                                                                    438             7UP                   Beverages             United States   2,526   AA       12,987       19%
     414    431    ACE             Insurance            Switzerland     2,667   AA-      20,055       13%          2,216      16,387          14%          A+
                                                                                                                                                                    439             Adobe                 Software              United States   2,524   AA-      12,849       20%
     415    441    Kyocera         Electronics          Japan           2,660   AA-      17,000       16%          2,162      11,111          19%          AA
                                                                                                                                                                    440             Eletrobras            Electric              Brazil          2,519   AA-      18,538       14%
     416    416    SK telecom      Telecoms Services    South Korea     2,651   AA       15,866       17%          2,282      15,381          15%          AA
                                                                                                                                                                                                          Commercial
                                                                                                                                                                    441    459      Sodexo                                      France          2,509   AA-      12,601       20%          2,078   11,158       19%          A
                                                                                                                                                                                                          Services
                                   Diversified Finan
     417           Nomura                               Japan           2,651   A+       20,290       13%          1,767      25,132          7%           A-
                                   Serv                                                                                                                             442             Postbank	             Banks                 Germany         2,506   AA-      7,596        33%          1,475   7,535        20%          A
     418           Halifax         Banks                Britain         2,632   A-       18,439       14%          1,738      8,714           20%          BB
                                                                                                                                                                    443             Stop & Shop           Retail-Food           Netherlands     2,505   A        5,487        46%
     419    332    Qualcomm        Telecoms Services    United States   2,632   AA-      62,606       4%           2,781      63,897          4%           AA-
                                                                                                                                                                    444    440      ICICI Bank            Banks                 India           2,501   AA       28,809       9%           2,164   19,807       11%          AA-
                                   Machinery-
     420           Man                                  Germany         2,631   AA       17,673       15%
                                   Diversified                                                                                                                      445             Arcon                 Healthcare-Products   Switzerland     2,496   AA       47,746       5%

     421           SUEZ            Water                France          2,610   A+       20,700       13%                                                                                                 Cosmetics/Personal	
                                                                                                                                                                    446             Garnier                                     France          2,493   AA       6,440        39%
                                                                                                                                                                                                          Care
     422    317    Bouygues                             France          2,608   AA       12,714       21%          2,872      21,007          14%          AA-
                                                                                                                                                                                    Korea Gas
                                                                                                                                                                    447                                   Gas                   South Korea     2,482   A        14,620       17%
                                                                                                                                                                                    Corp
     423           Magnit          Retail-Food          Russia          2,606   A        10,682       24%
                                                                                                                                                                    448             CEPSA                 Oil&Gas               Spain           2,479   A        7,635        32%          544     2,632        21%          BBB
                   Harley-
     424    309                    Leisure Time         United States   2,592   AA       12,398       21%          2,928      10,477          28%          AAA+
                   Davidson                                                                                                                                         449             COSCO                 Transportation        China           2,468   AA-      19,213       13%          266     24,796       1%           AA
                                   Diversified Finan
     425           BlackRock                            United States   2,591   AA+      32,739       8%           1,580      29,722          5%           AA
                                   Serv                                                                                                                             450    394      STC                   Telecoms Services     Saudi Arabia    2,468   A+       27,985       9%           2,393   32,607       7%           A+


                                                                                                                           All values in USD $ Millions                    All values in USD $ Millions
83                                                                                                                         © Brand Finance plc 2011                        © Brand Finance plc 2011                                                                                                                                84
BrandFinance ®
                                                                                                                                                                                                                                                            Global 500 2011

                                                                                                           Brand                                    Brand                                                                                                                          Brand                              Brand
                                                                            Brand   Brand                  Value /     Brand                        Value /    Brand                                                                                Brand   Brand                  Value /     Brand                  Value /    Brand
     Rank   Rank                                                                             Enterprise                           Enterprise                            Rank   Rank                                                                                  Enterprise                        Enterprise
                         Brand               Industry         Domicile      Value   Rating                Enterprise   Value                      Enterprise   Rating                          Brand                   Industry       Domicile      Value   Rating                Enterprise   Value                Enterprise   Rating
     2011   2010                                                                               Value                              Value 2010                            2011   2010                                                                                    Value                           Value 2010
                                                                             2011    2011                   Value       2010                        Value       2010                                                                                 2011    2011                   Value       2010                  Value       2010
                                                                                                             (%)                                   2010 (%)                                                                                                                          (%)                             2010 (%)

     451    320    KBC               Banks                  Belgium         2,466   A        16,617       15%          2,864      15,912          18%          BBB                      Wipro
                                                                                                                                                                        476                                   Computers             India           2,352   A+       24,738       10%          2,492   19,994       12%          AA
                                                                                                                                                                                        Technologies

     452           Centurylink       Telecoms Services      United States   2,464   AA-      19,571       13%          1,545      18,399          8%           AA-      477             Telia                 Cellular Telecoms     Sweden          2,351   AAA-     15,313       15%          2,180   41,168       5%           AA

     453    486    KANSAI	           Electric               Japan           2,453   AA-      57,507       4%           1,956      30,472          6%           A+       478             Turner                Media                 United States   2,349   AA-      10,020       23%

     454    398    CHS               Healthcare-Services    United States   2,452   AA-      11,828       21%          2,380      11,743          20%          A+       479             Luxottica             Healthcare-Products   Italy           2,347   AA       16,084       15%

     455    492    Telus             Telecoms Services      Canada          2,451   AA       20,137       12%          1,930      14,974          13%          A+       480             China CITIC           Banks                 China           2,342   A+       29,348       8%           1,866   33,904       6%           A+

     456    399    Winston           Agriculture            Japan           2,446   A        7,013        35%          2,378      5,888           40%          A                        Kuehne &
                                                                                                                                                                        481    419                            Transportation        Switzerland     2,330   AA       13,909       17%          2,262   11,179       20%          AA+
                                                                                                                                                                                        Nagel
     457           PICC              Insurance              China           2,441   A        15,649       16%          1,315      9,302           14%          A
                                                                                                                                                                        482             Progressive	          Insurance             United States   2,329   AA-      14,087       17%          1,872   11,307       17%          AA-

     458    483    DnB	NOR           Banks                  Norway          2,433   AA       21,925       11%          1,964      16,537          12%          A+                                             Electrical
                                                                                                                                                                        483             Legrand                                     France          2,325   AA-      11,013       21%
                                                                                                                                                                                                              Compo&Equip
                                     Retail-Department
     459           Dia               Stores/ Mixed          France          2,421   A        5,380        45%          1,139                                   A+       484             Aveeno                Healthcare-Products   United States   2,319   AA       10,459       22%
                                     Goods variety stores
                                                                                                                                                                                                              Auto
     460           MURPHY            Oil&Gas                United States   2,416   AA-      12,283       20%                                                           485             Denso                                       Japan           2,310   A+       22,710       10%
                                                                                                                                                                                                              Parts&Equipment
                                                                                                                                                                                                              Commercial
     461           KT                Telecoms Services      South Korea     2,407   AA       16,417       15%          1,837      14,844          12%          AA       486    482      ADP                                         United States   2,308   AA       19,137       12%          1,967   20,352       10%          AA
                                                                                                                                                                                                              Services

     462           Banamex           Banks                  United States   2,406   A+       18,693       13%          1,356      13,760          10%          A+       487    413      Colruyt               Food                  Belgium         2,300   A+       8,683        26%          2,286   8,114        28%          AA

     463    358    Agip              Oil&Gas                Italy           2,405   AA-      24,715       10%          2,591      27,499          9%           A+       488             Dairy Farm            Food                  Hong Kong       2,299   AA-      10,604       22%

     464    152    AIG               Insurance              United States   2,390   A        13,177       18%          5,536      14,856          37%          A+       489             BD                    Healthcare-Products   United States   2,295   AA       17,592       13%

     465           Cathay	Pacific    Airlines               Hong Kong       2,383   AA+      11,518       21%                                                           490    313      Zain                  Cellular Telecoms     Kuwait          2,293   AA-      20,193       11%          2,889   24,170       12%          AA-

     466    311    Air France        Airlines               France          2,382   AA+      8,926        27%          2,909      6,300           46%          A+                       Shoppers Drug
                                                                                                                                                                        491                                   Retail                Canada          2,291   A-       n/a          n/a
                                                                                                                                                                                        Mart
     467    338    Thales            Aerospace/Defense      France          2,377   AA-      8,277        29%          2,713      10,641          25%          AA-      492    475      Puma                  Apparel               Germany         2,291   AA+      4,838        47%          1,990   4,544        44%          AA

     468    462    BYD               Auto Manufacturers     China           2,374   A+       17,455       14%          2,065      22,786          9%           AA                       Universal
                                                                                                                                                                        493    261                            Media                 France          2,286   AA-      8,701        26%          3,368   15,775       21%          AA-
                                                                                                                                                                                        Music Group
                                     Miscellaneous
     469           Danaher                                  United States   2,371   AA       28,447       8%                                                                            Ameriprise            Diversified Finan
                                     Manufactur                                                                                                                         494                                                         United States   2,283   AA       12,552       18%          1,498   9,208        16%          A
                                                                                                                                                                                        Financial             Serv
     470    433    JR-West           Transportation         Japan           2,367   AA-      19,081       12%          2,210      18,504          12%          AA-
                                                                                                                                                                        495             Isbank                Banks                 Turkey          2,280   AA       19,221       12%          1,662   12,704       13%          AA-
                   Astra             Retail-Automobiles/
     471                                                    Indonesia       2,360   A        28,463       8%
                   International     Auto	Parts                                                                                                                         496             "K"Line               Transportation        Japan           2,279   AA-      7,846        29%

     472           HBO               Media                  United States   2,357   AA-      10,020       24%                                                                                                 Cosmetics/Personal	
                                                                                                                                                                        497             Natura                                      Brazil          2,274   AA-      12,722       18%
                                                                                                                                                                                                              Care
     473    395    Ferrovial Sa                             Spain           2,355   AA       40,630       6%           2,393      42,019          6%           AA-
                                                                                                                                                                        498             Gucci                 High End Fashion      France          2,272   AA       3,783        60%

     474    456    Eiffage                                  France          2,354   A+       21,883       11%          2,086      23,555          9%           AA-                                            Machinery-
                                                                                                                                                                        499    500      Komatsu                                     Japan           2,270   AA+      28,480       8%           1,898   25,475       7%           AA
                                                                                                                                                                                                              Constr&Mining
     475    479    United Airlines   Airlines               United States   2,352   AA-      n/a          n/a          1,972      4,996           39%          A
                                                                                                                                                                                                              Electrical
                                                                                                                                                                        500             Vestas                                      Denmark         2,267   A+       8,782        26%
                                                                                                                                                                                                              Compo&Equip


                                                                                                                               All values in USD $ Millions                    All values in USD $ Millions
85                                                                                                                             © Brand Finance plc 2011                        © Brand Finance plc 2011                                                                                                                                86
The world’s leading
 independent brand
valuation consultancy


www.brandfinance.com

Brand Finance Global 500 2011

  • 1.
    Brand Finance ® Global 500 The annual report on the world’s most valuable brands March 2011
  • 2.
    Foreword Since it was first released in 2007, the BrandFinance® The value of the world’s top 500 brands continues Global 500 has been the most comprehensive table its impressive recovery from the drop in 2009 of US$707 billion. The value of the top 500 as a whole of published brand values. The study is released grew by 14% to US$3,306 billion. There are several annually and incorporates data from all listed interesting trends to draw out from this. companies globally. Each brand has been accorded a brand rating: a benchmarking study of the strength, The banking sector continues a steady drive towards risk and future potential of the brand relative to its rehabilitation in the eyes of consumers, having seen competitor set as well as a brand value: a summary the largest brand value increase of any sector - measure of the financial strength of the brand. US$90 billion. By contrast, the brands of sectors specialising in consumer goods have not fared so well. The brand value of Coca-Cola has fallen by US$9 billion, reflecting a drop in the beverage sector as a whole. Wal-mart, which has topped the BrandFinance® Global 500 for two years running, has this year fallen to third place. As well as highlighting the declining power of retail, the two companies which have overtaken it, Google and Microsoft, reflect the growing power of technology-led brands. These two companies, along with rival Apple, have all boosted their brand value by over US$8 billion while other technology and telecoms firms have also produced impressive results. “Brands are the most valuable Finally, at a regional level, South America continues to perform strongly and has the fastest rate of brand value growth, 61%, for a second consecutive year. intangible assets in business today. Brazil’s Itau and Bradesco have seen bigger brand value gains than almost any other bank, with over US$5 billion of growth each. They drive demand, motivate staff, This report provides an opinion regarding the point in time valuations of the most valuable global brands at 31st December 2010. The sheer scale of these secure business partners and reassure brand values show how important an asset these brands are to their respective owners. As a result, we firmly believe that brand valuation analysis can financial markets. Leading edge offer marketers and financiers critical insight into their marketing activities and should be considered as a key part of the decision making process. organisations recognise the need to understand brand equity and brand value when making strategic decisions” David Haigh, CEO, Brand Finance David Haigh, CEO, Brand Finance plc 1 © Brand Finance plc 2011 © Brand Finance plc 2011 2
  • 3.
    Executive Summary Top line findings Emerging markets continue to boom whilst the west shows recovery... • The top 500 most valuable brands in the world have grown in value by 14% to US$3,306 billion • Despite contributing only 2% to the Global 500, South America’s total brand value increased • The Enterprise Value of the top 500 has grown significantly by 61% making it the fastest growing by 15% to US$21,624 billion region for the second year running. This region is dominated by Brazilian brands which account for • Google has replaced Walmart as the most 10 out of the 11 South American brands valuable brand in the world, increasing its brand value by 22% to US$44.3 billion • The European region has seen a slowdown in growth with the region increasing in brand value • Itaú is the fastest growing brand in absolute by 8% and contributing 35% to the overall terms, increasing its brand value by 141% to Global 500. Four European brands dropped out become the 41st most valuable brand in the of the Global 500. By contrast, the United world, rising from 116th place last year Kingdom is the best performing European country with an increase in brand value of US$29 billion Technology brands thrive whilst the Banking and providing three new entrants sector continues its recovery... • North American brands continue to rebound • The banking sector once again sees the largest growing in value by 14% and contributing 43% increase in brand value, growing by US$90 billion, to the total Global 500. USA and Canada provided highlighting the continued resurgence of the five and two additional brands respectively, sector following a near systemic failure three including Facebook and Heinz years ago • Asia continues to perform well growing in brand • Itaú, Wells Fargo, Chase, Bradesco, Deutsche value by 27% and contributing 18% to the overall Bank, ICBC, Credit Suisse and China Construction Global 500. Three new brands enter the Global Bank feature amongst the largest individual 500 from Asia brands value increases with all experiencing a rise in brand value of at least US$5 billion • The Pacific region has grown in brand value by 21% largely spurred on by a strong performance • The leading Technology brands, Apple, Microsoft of the banking industry and Google have seen brand value increases in excess of US$8 billion each • Africa has seen a 30% fall in its brand value and now contributes a solitary brand to the • The Beverage industry has seen its value fall Global 500, South Africa’s MTN by 27%. This is underpinned by the performance of Coke whose brand value has fallen by US$ 9 billion. This is a reflection of the erosion of global demand for Coke as sweet, cola carbonates no longer command consumers worldwide 3 © Brand Finance plc 2011 © Brand Finance plc 2011 4
  • 4.
    Contents Foreword ........................................ 001 Executive Summary .............................. 003 Top 20 Most Valuable Global Brands .... 007 Brand Stories ........................................ 029 ISO 10668: Global standard for brand valuations ... 043 Explanation of Methodology ................. 049 About Brand Finance ............................. 051 Glossary of Terms .................................. 061 Disclaimer .............................................. 062 Contact details ....................................... 064 Appendix: Top 500 Most Valuable Global Brands .. 065 5 © Brand Finance plc 2011 © Brand Finance plc 2011 6
  • 5.
    01 11 2010 RANK: 2 2010 RANK: 8 44,294 $M 22% 27,632 $M ▼3% RATING: AAA+ RATING: AAA GOOGLE HSBC 02 12 2010 RANK: 5 2010 RANK: 14 42,805 $M▼27% 27,293 $M ▼19% Top 20 RATING: AAA+ RATING: AA MICROSOFT VERIZON 03 13 2010 RANK: 1 2010 RANK: 9 36,220 $M 12% 26,756 $M ▼2% RATING: AA RATING: AA WAL-MART HP Most 04 14 2010 RANK: 4 2010 RANK: 10 36,157 $M 7% 26,152 $M ▼4% RATING: AA+ RATING: AA+ IBM TOYOTA 05 15 2010 RANK: 7 2010 RANK: 13 30,674 $M 6% 26,150 $M ▼2% Valuable RATING: AAA+ RATING: AAA VODAFONE SANTANDER 06 16 2010 RANK: 12 2010 RANK: 3 30,619 $M 18% 25,807 $M ▼26% RATING: AAA- RATING: AAA+ BANK OF AMERICA COCA COLA Global 07 17 2010 RANK: 6 2010 RANK: 18 30,504 $M 4% 21,842 $M ▼8% RATING: AA+ RATING: AAA GE MCDONALDS 08 18 2010 RANK: 20 21,511 $M ▼14% 29,543 $M ▼49% 2010 RANK: 23 Brands RATING: AAA RATING: AA+ APPLE SAMSUNG 09 19 2010 RANK: 15 2010 RANK: 17 28,944 $M ▼32% 21,129 $M ▼2% RATING: AA RATING: AAA WELLS FARGO TESCO 10 20 2010 RANK: 11 2010 RANK: 39 28,884 $M ▼9% 20,798 $M ▼50% RATING: AA+ RATING: AA AT&T MERCEDES 7 © Brand Finance plc 2011 © Brand Finance plc 2011 8
  • 6.
    Top 20 Most Valuable Global Brands 1. 2. 2011 2010 2011 2010 Brand Ranking 1 2 Brand Ranking 2 5 Brand Value (US$m) 44,294 36,191 Brand Value (US$m) 42,805 33,604 Brand Rating AAA+ AAA+ Brand Rating AAA+ AAA+ Enterprise Value (US$m) 143,016 157,971 Enterprise Value (US$m) 165,725 199,990 Domicile US Domicile US Industry Group Internet Industry Group Software Google has overtaken Walmart as the most valuable Microsoft has had a successful year, jumping three brand in the world, a title which the retailing giant places to second in this year’s BrandFinance® has held for the past two years. Global 500. Its brand value has increased by over US$9 billion following the rollout of a series of well Google’s brand value rose by 22% which amounts to received products in 2010. a US$8.1 billion increase. The company continues to dominate with its online service offerings. Still the Despite its dominance of the personal computing world’s most popular search engine brand, processing sector from the 1980s, Microsoft has come to be 1 billion search queries per day, it has maintained seen as almost a laggard in terms of technological its strong reputation of innovative ideas to make innovation. Traditional rival Apple has consistently searching and browsing the internet easy. Since captured increasing market share over the last Google released its Chrome web browser in 2008, decade and has come to dominate the smartphone The mobile sector, once dominated by it has become the third most widely used browser Google has been fine-tuning its Chrome operating market, while new internet giants Google telecommunications companies, is increasingly capturing 11% of the market as of December 2010. system in a bid to create a product that could and Facebook increasingly shape the way people being colonised by the tech giants. Microsoft has compete with Microsoft’s Windows and to a lesser find information, communicate and live their however been slow off the mark, having allowed Over the past year, the company’s mobile operating extent, Apple’s Mac. Due for release in June 2011, online lives. Google and Apple to dominate the smartphone system, Android, has gained immense popularity Google is set to officially launch the operating market. A recent partnership with Nokia to support and surpassed Blackberry and Apple’s operating system on its Chromebooks which are laptops This year however, Microsoft’s concerted efforts the Windows 7 mobile operating system is predicted systems in terms of market share. Although the made by Acer and Samsung. Although not reflected to improve the under-performing Windows Vista to lead to significant gains but as the embattled Android mobile operating system has become a in this year’s valuation, it will be interesting to see PC operating system has been rewarded with Finnish giant faces a series of technical and success, the number of app purchased from Android what impact Google’s foray in the operating system positive reviews and healthy sales of its successor, PR challenges, the wisdom of the deal has yet Market is still substantially behind the benchmark of market will have on its brand value next year. Windows 7. to be confirmed. Apple’s App store and is an area that Google will look to improve on. Google, as with many established Western Its gaming division has gone from strength to companies, continues to have problems in China due strength. Microsoft’s Xbox is the most valuable Last year, the company branched away from its to political interference. Most recently controversy console brand this year, with a range of popular traditional online services to the ever growing smart surrounded Google’s email service, Gmail, as it titles recently enhanced by the new Xbox Kinect. phone industry with the launch of the Google Nexus came to light that it was being blocked and, in some This motion-sensing device is Microsoft’s answer One. Sales were not as high as forecasted, primarily cases, censored by the Chinese government. to Nintendo’s Wii. Microsoft has surpassed its due to the fact that Google only sold it online. rivals however, bypassing the need for a handheld Learning from its mistakes, the company launched controller entirely and in 2010 the Kinect became the Google Nexus S in late 2010, distributed in the fastest selling consumer electronics device conventional retailers and online, and recorded of all time. steady sales. 9 © Brand Finance plc 2011 © Brand Finance plc 2011 10
  • 7.
    Top 20 Most Valuable Global Brands 3. 4. 2011 2010 2011 2010 Brand Ranking 3 1 Brand Ranking 4 4 Brand Value (US$m) 36,220 41,365 Brand Value (US$m) 36,157 33,706 Brand Rating AA AA Brand Rating AA+ AA Enterprise Value (US$m) 154,325 190,803 Enterprise Value (US$m) 189,718 180,028 Domicile US Domicile US Industry Group Retail-Department Stores Industry Group IT services Wal-mart Stores Inc is the world’s largest public The multinational computer, technology and corporation, serving both customers and club IT consulting corporation International Business members up to 200 million times per week. It has Machines (IBM), traditionally known as ‘Big Blue’ over 8,000 retail outlets, operating in 15 countries. is the only brand to be a non-mover in the Top 20 It remains a powerful brand with a reputation for 2011 valuation. IBM remains at 4th, and manages to offering great value to customers. The acquisition go from AA to a AA+ brand rating as a result of its of ASDA in the UK was largely seen as a success brand value increasing by $2.451bn. with discussions of further acquisitions in 2011. Its corporate and social responsibility endeavours IBM is famous for some of the most pioneering serve to support its commercial brand. The extensive developments on technology of the 20th century, work of the Wal-mart Foundation includes; assisting such as the invention of the floppy disk, laser with education, opportunity, sustainability and in thriving industries such as technology, which printer and PC and holds more patents than any health by getting involved with projects involving have the potential to define social and shopping other technology company. Recently, the company unemployment, hunger relief and child welfare. habits in the 21st century in the way that major has been keen to diversify away from hardware, retailers helped to define shopping habits in the late acquiring more software manufacturers in a variety However many have argued it has reached a critical 20th century. of fields as part of its “Information Agenda”. mass with little room for domestic expansion. It 2010 was no exception, web analytics software has not been immune from the financial crisis and producer Coremetrics was acquired, while targeted recorded three years of slowing sales growth and advertising specialist Unica was bought for US$480 five quarters of falling sales at US stores open million and data analytics appliance manufacturer for over a year. As a consequence it has suffered Netezza for US$1.7 billion. IBM has also focussed a brand value reduction of US$5.145 billion and has on business analytics, risk and compliance, taking fallen from its once unassailable position at the top on BigFix online security in October and AT&T’s of the BrandFinance® Global 500. Sterling commerce. Wal-mart could be said to have perfected As with many of the brands in this year’s Global 500, the retailing of groceries and hardware, including IBM has many opportunities for growth in emerging the logistics and supply chains needed to do so. markets as these economies rapidly develop but its Yet as the internet revolution changes the lives of impressive sales growth and profits show that it is more global consumers; data, communication and already successfully positioning itself as a holistic the technologies that enable them have become technology services company. people’s most prized possessions. As with many other physically focussed brands, Wal-mart has been overtaken by more dynamic competitors 11 © Brand Finance plc 2011 © Brand Finance plc 2011 12
  • 8.
    Top 20 Most Valuable Global Brands 5. 6. 2011 2010 2011 2010 Brand Ranking 5 7 Brand Ranking 6 12 Brand Value (US$m) 30,674 28,995 Brand Value (US$) 30,619 26,047 Brand Rating AAA+ AAA Brand Rating AAA- AAA+ Enterprise Value (US$m) 192,456 178,604 Enterprise Value (US$m) 120,195 111,754 Domicile UK Domicile US Industry Group Telecoms Services Industry Group Banks Valued at US$ 30.7 billion, Vodafone is the Operating in over 40 countries and all 50 states, most valuable telecoms brand in the world. Bank of America is the largest bank in the US. It has The British giant operates the largest mobile moved from 12th to 6th place in the BrandFinance® telecommunication network in the world and is Global 500 and despite concerns of further mortgage- present in over 30 countries, with partners in a further related write-downs, the company is currently 40 countries. the most valuable banking brand in the world at US$30.6 billion. Vodafone currently serves more than 370 million customers worldwide, with the majority of its It has been a mixed year for Bank of America under business stemming from Europe. Faced with Brian Moynihan. The bank benefitted from a strong fierce competition in these core markets performance by its key subsidiary, Merrill Lynch, however, Vodafone has been increasingly serving against a background of hostile media coverage, callers further afield. Under CEO Vittorio Colao, Vodafone continues to sponsor McLaren Mercedes legal proceedings and write downs that threatened Vodafone has continued its rapid expansion F1 Team which has been extremely successful in to drag down the value of the brand. However into Africa, Asia and the Middle East through terms of exposure and raising awareness of the its proactive strategy to directly tackle negative acquisitions and partnerships. India and South Vodafone brand worldwide. perceptions of the bank helped to drive up brand Africa in particular, have been key markets in value. Two examples are worth noting: firstly, its which it has already established leading positions. campaign to help distressed homeowners by forgiving Growth in the wider developing world has also been portions of debt. Secondly, BoA also announced partly bolstered by the introduction of the world’s that a restructuring of its bonuses for staff– nearly cheapest mobile phone known as the ‘Vodafone 70% of the total would be paid in deferred stock, 150’, which was launched in February 2010 and helping to present a more universal alignment of sells for below $15. incentives between bankers, stockholders and the wider market. Its monolithic branding approach brings consistency and cohesion across the group Bank of America’s acquisitions in the post-financial with the goal of uniting local partner markets crisis period have transformed it from a regional under the Vodafone umbrella. As such, Vodafone bank into a major international player and it has now has maintained its AAA+ brand rating. Underpinned inadvertently adopted the financial supermarket with the slogan ‘Power to you’, the company model, initially championed by Citigroup. Although wishes to drive customers towards the far more it still has a tough time ahead, particularly profitable smartphone segment by capitalizing on given concerns over further mortgage-related write- its ability to service the increasing global demand downs, its well-executed marketing strategy has for data roaming services. pushed the bank into the top 10 for the first time. 13 © Brand Finance plc 2011 © Brand Finance plc 2011 14
  • 9.
    Top 20 Most Valuable Global Brands 7. 8. 2011 2010 2011 2010 Brand Ranking 7 6 Brand Ranking 8 20 Brand Value (US$m) 30,504 31,909 Brand Value (US$m) 29,543 19,829 Brand Rating AA+ AA+ Brand Rating AAA AAA- Enterprise Value (US$m) 475,066 528,713 Enterprise Value (US$m) 244,382 156,416 Domicile US Domicile US Industry Group Miscellaneous Manufacturing Industry Group Consumer Electronics General Electric (GE), the world’s biggest maker Apple has surged up the rankings of the Brand of jet engines, power-plant turbines and medical- Finance Global 500, rising up to 8th place following imaging equipment is valued at US$30.5 billion, a near US$10 billion rise in brand value, which now which is a drop of US$1.4 billion. As a result stands at US$29.5 billion. GE has dropped from sixth to seventh place in this year’s rankings. Apple’s extremely successful year follows a series of highly publicised and well received new products. It has been widely reported that the company has The product line includes the latest update of the experienced difficulties, especially in its technology, iPod Nano, the company’s smallest personal music energy and finance units where it underperformed player, the iPhone 4, the fourth iteration of the most against analyst forecasts. The multinational iconic smart-phone and finally the iPad, Apple’s first conglomerate has been a casualty of the bad tablet computer. Tablet PCs have existed in a variety firm, to support continuing product development. economy and tough regulations but is nonetheless of forms for several years; however the iPad’s With a recently acquired AAA brand rating and some on the road to recovery with both long term and popularity has eclipsed any previous consumer of the most loyal customers of any brand, Apple short term prospects on the rise. uptake. The device has come to define the genre looks set to build on its impressive performance in the short time it has been on the market, in the 2011 BrandFinance® Global 500. GE continues to position itself as a “green” company representing 75% of all tablet sales in 2010. following the launch of its ecomagination initiative in 2005, which aims to address pressing Building upon the success of the iPad, the environmental and operational challenges with subsequent release of the iPhone 4 was a further commercially viable solutions. It has become one boon to Apple’s fortunes. Though its debut was of the biggest players in the wind power industry somewhat marred by problems with signal strength, and continues to invest heavily in R&D to develop the company quickly sought to remedy the problem, new environment-friendly products. As a result, providing thousands of phone covers, which improve GE holds on to its AA+ Brand Rating. reception, free of charge. The enhanced speed and processing power, as well as the new video- calling function further reinforced its perception as innovative and customer-centric. As more tablet devices flood the market, Apple is mindful of its competitors. The iPad 2 was released earlier this year, offering FaceTime video and faster operating speeds. Always forward-thinking, this year Apple purchased Intrisity, a chip design software 15 © Brand Finance plc 2011 © Brand Finance plc 2011 16
  • 10.
    Top 20 Most Valuable Global Brands 9. 10. 2011 2010 2011 2010 Brand Ranking 9 15 Brand Ranking 10 11 Brand Value (US$m) 28,944 21,916 Brand Value (US$m) 28,884 26,585 Brand Rating AA+ AA- Brand Rating AA+ AA+ Enterprise Value (US$m) 136,069 131,225 Enterprise Value (US$m) 235,987 229,793 Domicile US Domicile US Industry Group Banks Industry Group Telecoms Services Wells Fargo & Co is a diversified financial AT&T is the largest provider of local and long services company with a global operation. It is the distance telephone services in the U.S. and boasts fourth largest bank in the US by assets and third approximately 95 million customers. In 2010 Forbes largest by market capital. The bank gained an listed it as the 13th largest company in the world impressive US$ 7 billion in brand value; a 32% by market value, and this year it is 10th based on increase from 2010, which has seen it move into BrandFinance® Global 500 brand valuation. the top 10 for the first time, making it the second most valuable bank in the world after Bank Now sitting at 10th from last year’s place at of America. 11th, AT&T has kept is AA+ brand rating, and increased its brand value by $2.3 billion. Earlier The Wells Fargo brand was shielded from this year the company acquired 1.6 million more the impact of the banking crisis due to its sector. They reported a 21% rise in income and rural broadband customers in the US as part of AT&T has lost ground to major rival Verizon in the conservative approach during the boom period. their strategy to purchase Wachovia at the height rival Verizon’s forced divestment process following mobile internet market and the value of its exclusivity Its main exposure to the financial crisis came through of the financial crisis is also beginning to provide antitrust proceedings. deal with Apple is less certain as Google’s Android its ownership of Wachovia bank. Its solidity and better returns. has become the most popular mobile operating reliability, particularly within the mortgage market, Throughout 2010, AT&T continued to benefit from its system. AT&T is beginning to step up to the mobile has helped maintain its brand integrity through exclusive rights to distribute Apple’s iPhone in the internet challenge, announcing in October a deal a tumultuous period. US although this has now ended. The relationship with Microsoft to distribute the Windows Phone has not been entirely trouble-free however. Both 7 handset. AT&T paid US$1.9 billion to Qualcom The bank completed over 55 acquisitions Apple and AT&T were hit with criticism and a law for wireless spectrum licenses for the coming in the last five years and it became the largest suit after the iPhone 4 was distributed due to a faulty 4G network and talks are in process over US bank by Market Cap when it surpassed antenna that caused reception problems, which the the acquisition of Deutsche Telekom and JP Morgan in December 2010. This is a clear companies were accused of being aware of and T-Moblie USA. reflection of investor confidence in the firm and selling nevertheless. They also suffered from low its brand. Warren Buffett’s stockholding in the stock which impeded the delivery of online orders. firm has also helped to add further credibility. Data security has been a further issue. In 2010 it was The former CEO, Richard Kovacevic was famously discovered that some personal information of AT&Ts quoted in referring to the Wells Fargo bank customers, including celebrities and politicians, branches,“stores”, as he envisioned their approach had been exposed. More recently, revelations that to create a single destination for people’s iPhones routinely track location data were also met banking needs. with concern, though this latest revelation comes too late to have affected either Apple or AT&T’s Wells Fargo’s strong fourth quarter earnings brand value is this year’s Global 500. are testament to their strength in the retail banking 17 © Brand Finance plc 2011 © Brand Finance plc 2011 18
  • 11.
    Top 20 Most Valuable Global Brands 11. 12. 2011 2010 2011 2010 Brand Ranking 11 8 Brand Ranking 12 14 Brand Value (US$) 27,632 28,472 Brand Value (US$m) 27,293 23,029 Brand Rating AAA AAA+ Brand Rating AA AA Enterprise Value (US$m) 171,163 193,794 Enterprise Value (US$m) 381,093 196,293 Domicile UK Domicile US Industry Group Banks Industry Group Telecoms Services Verizon provides broadband and telecommunications solutions to consumers, carriers, businesses and HSBC loses its position as the world’s most government customers worldwide. As the second valuable bank after holding it for three consecutive largest US telecoms company, it has 90 million years, as Bank of America and Wells Fargo rise up US customers and operates 30 million landline the rankings. This year, HSBC’s brand value lies at accounts. This year Verizon moved from 14th to US$ 27.6 billion, a drop of US$840 million which has 12th position with a brand value of US$27.3 billion also resulted in its brand rating dropping to AAA. and has maintained its AA brand rating. Despite the turmoil, HSBC has managed to maintain Verizon’s best gain this year has come from the majority of its brand equity throughout the increasing its share of wifi, where they are the financial crisis. Building on its high profile presence number one US provider. Until 2010, Verizon was continues to capitalise on its dominance of wireless at airports, its ‘’Your Point of View” advertisements unable to capitalise on the growth of mobile internet internet. A joint venture with AT&T and T-Mobile has continued to convey the bank’s positioning as pioneered by Apple’s iPhone, since Apple has an recently been announced, called ISIS, which will a global corporation that is sensitive to local nuances. exclusive deal with AT&T. However, this proved enable mobile purchases that could revolutionise The campaign is expected to be seen by more than to be slightly less of a problem than anticipated. the way brands communicate with consumers and 150 million air passengers in North America alone. Due to Verizon’s successful marketing campaign how purchases are made. In terms of sponsorships, HSBC divides its in Q1 of 2010 for phones featuring the Android investment between sport and cultural areas. For operating system, phones running the Android Although in 2011 Verzion are thought to currently sport, the bank is involved in rugby (Hong Kong software outsold the iPhone for the first time. Verizon hold the leading market share at 31%, the planned Rugby Sevens and the British and Irish Lions), continued to enhance the appeal of Android phones, acquisition of T-Mobile by AT&T could mean Verizon tennis (Wimbledon), golfing (including The Open introducing Skype’s calling service for owners of loses this position, as the combined entity represents Championship) and eventing (exclusive financial Blackberry and Android based smartphones in March a 39% share. Speculation over an acquisition services partner to the FEI). HSBC also recently 2010. Verizon was however finally able to offer the of Sprint by Verizon has been adamantly denied. made headlines for completing the first ever iPhone, as well as Apple’s iPad, despite not having Renminbi denominated trade settlement. been a positive advocate for the iPhone in the past. HSBC’s income is predominantly generated Major transactions included US$8.6 billion paid in Europe which contributes about 36% of its income. to Verizon by Frontier Comms for 4 million phone More recently, the bank has made further inroads and broadband subscribers. This helped to finance into Asia and HSBC now generates about 30% the US$18 billion that has been spent on a new of its income from Asia which further consolidates FTTP network to replace copper cabling, increase its positioning as “The World’s Local Bank”. broadband capacity and gain an edge on cable operators Comcast and Time Warner. Verizon 19 © Brand Finance plc 2011 © Brand Finance plc 2011 20
  • 12.
    Top 20 Most Valuable Global Brands 13. 14. 2011 2010 2011 2010 Brand Ranking 13 9 Brand Ranking 14 10 Brand Value (US$m) 26,756 27,383 Brand Value (US$m) 26,152 27,319 Brand Rating AA+ AAA- Brand Rating AA+ AAA Enterprise Value (US$m) 84,186 100,998 Enterprise Value (US$m) 204,864 185,402 Domicile US Domicile Japan Industry Group IT services Industry Group Auto Manufacturers HP is the world’s largest manufacturer of personal This multinational automaker, headquartered computers and also specialises in data storage, in Japan, employs over 71,000 people worldwide, networking hardware and software. The company’s and is considered to be the world’s largest brand has fared poorly this year, dropping out of the automobile manufacturer by both sales value and top ten and has seen over US$600 million wiped off production volume. its brand value. In last year’s BrandFinance® Global 500 report, There are several reasons behind this fall. Toyota was riding high, with a position in the top The profitability of laptops, upon which HP has 10 and an AAA brand rating. However a disastrous traditionally relied, has been steadily falling as they chain of events at the beginning of 2010 has become almost a commodity. HP has diversified cut over US$1 billion from its brand value and significantly into networking infrastructure and other seen it fall to 14th place in this year’s table. in addition to providing a welcome boost to Toyota’s business-to-business services. However to cope Its troubles started following a series of tragic income, has saved 18 million tonnes of carbon with the market demands of the coming decade, the accidents allegedly caused by faulty accelerator dioxide emissions. company has undergone a degree of restructuring, pedals in a number of different models. with the loss of 9,000 jobs and consequent This resulted in one of the biggest product recalls US$1 billion in redundancy pay. in history, and the early handling of the fiasco exacerbated the PR disaster that was to follow. There have been less commercial reasons behind Later in the year, sales of the new Lexus SUV the brand value damage. Early in 2010, CEO Mark were halted pending investigations into the threat Hurd was investigated following allegations of of rollover accidents when handling certain turns. sexual harassment. Though subsequently cleared, The series of recalls is thought to have cost his resignation and departure for HP’s rival Oracle Toyota in the region of US$2 billion, but as will not have boosted the confidence of shareholders David Haigh, Brand Finance CEO predicted at the or impressed consumers. time, the cost to its reputation has been almost as significant, with a loss of US$1.167 billion. Nevertheless, Toyota’s situation could have been much worse. Lessons have been learnt and provided that Toyota continues to produce innovative, reliable and most importantly safe cars, consumers are likely to forgive them. Already in early 2011 Toyota has announced that the Prius has gone over the 3million sales mark, which, 21 © Brand Finance plc 2011 © Brand Finance plc 2011 22
  • 13.
    Top 20 Most Valuable Global Brands 15. 16. Santander 2011 2010 2011 2010 Brand Ranking 15 13 Brand Ranking 16 3 Brand Value (US$m) 26,150 25,576 Brand Value (US$m) 25,807 34,844 Brand Rating AAA AAA+ Brand Rating AAA+ AAA+ Enterprise Value (US$m) 100,281 128,087 Enterprise Value (US$m) 69,508 87,814 Domicile Spain Domicile US Industry Group Banks Industry Group Beverages Santander is Europe’s largest bank by market With 1.5 billion servings a day arising from sales capitalization and the 4th most valuable banking in shops, restaurants and vending machines brand with US$26.2 billion. Despite a slight in over 200 countries, the Coca-Cola Company increase of US$574 million in brand value, it has is the world’s largest soft drinks company. Its brand, not been enough to retain its position and has though not the most valuable this year, is arguably consequently dropped from 13th to 15th place the most recognised trademark worldwide. In 2010 in this year’s rankings. the company spent more than US$2.9 billion on advertising, an increase of 4.5%. The Spanish bank continues to bolster its international footprint with an aggressive acquisition policy. This year however, has seen the company fall from As such, it retains its title as the world’s fastest 3rd place to 16th place this year in the brand ranking. growing retail bank, with the majority of its business It has maintained it AAA+ brand rating, but its brand for instance via the MyCokeRewards programme now centred in and around its nine major markets: value has dropped by US$9 billion since 2010. which offers credits through Facebook for various Spain, Portugal, Germany, UK, Brazil, Mexico, Chile, forms of engagement is one method, and the newly Argentina and USA. Coca-Cola reported losses on its net income in released ‘Freestyle’ vending machine. This offers 2010 of US$2 million, that were thought be based consumers a huge variety of drinks as well as the In the UK, Santander is already well underway to around mark-to-market adjustments on fuel and opportunity to create their own by mixing existing ones. absorb UK banks Abbey, Bradford & Bingley, Alliance aluminium, and asset losses during flooding The machine has the added benefit of supplying & Leicester and parts of Royal Bank of Scotland in Nashville, Tennessee. Coca-Cola with a raft of data that can be used to Group (RBS) under its single brand, underlined hone the products of the future. by the strapline ‘Together, we are Santander’ and In explaining the drop, Brand Finance CEO David supported by significant marketing investment. Haigh also points to changing consumer tastes The second tactic is to effectively target emerging worldwide. The soft drinks market has become markets. Farrell points to growth in China, where Santander has also been actively undertaking ever more competitive as consumers increasingly per capita annual consumption was just three sports sponsorships in an effort to consolidate in the developed world are turning away from units in the early 1990s, but now stands at 34. and strengthen its single brand approach. Most carbonated sweet drinks to vitamin water and fruit With such opportunities for growth, Coke may noteworthy is the bank’s involvement with Formula juices. Coupled with associated health concerns, yet recover its position at the very top of the One. Since 2007 Santander has been a corporate the company is increasing focus on its sugar free BrandFinance® Global 500. partner of the Vodafone McLaren Mercedes products, Diet Coke and Coke Zero and Vitamin F1 Team. In 2010, a media specialist agency estimated Water brands. that Santander made a return on investment of 270 million Euros for its F1 sponsorship, which exceeds There will be two key components for future the total projected investment for five years. growth, according to Coke’s Chief Strategy Officer John Farrell. The first is consumer engagement, 23 © Brand Finance plc 2011 © Brand Finance plc 2011 24
  • 14.
    Top 20 Most Valuable Global Brands 17. 18. 2011 2010 2011 2010 Brand Ranking 17 18 Brand Ranking 18 23 Brand Value (US$m) 21,842 20,192 Brand Value (US$m) 21,511 18,925 Brand Rating AAA AAA- Brand Rating AA+ AA+ Enterprise Value (US$m) 89,595 77,140 Enterprise Value (US$m) 113,327 86,384 Domicile US Domicile South Korea Industry Group Restaurants Industry Group Consumer Electronics McDonald’s Corporation is one of the largest chains The Samsung Group is a consumer electronics of fast food restaurants in the world, with 14,000 manufacturer with assembly plants and sales locations in the U.S. in 2010, serving 27 million locations in over 65 countries and 165,000 employees people per day. worldwide. The flagship brand, Samsung, has had a highly successful year with a jump in brand value of This has not been a trouble-free year for US$2.6 billion, becoming one of the top 20 global McDonald’s, with product recalls of Happy Meal brands for the first time. toys, sales of coffee declining by around half, and a reduction in total US sales. The recession The retention of the strong AA+ rating is a suitable has led to more competition on price with rivals reward for an impressive performance and caps a such as Burger King and a increasing reliance on successful year. 2010 saw the release of Samsung’s cheaper, low margin items. On the other hand, in emerging markets stand the company in good latest smartphone handset, the Nexus, which McDonald’s has suffered less than many other stead for the future. uses Google’s highly successful Android operating food retailers whose proposition focused on more system. More recently, Samsung launched the expensive items. Unsurprisingly consumers have Galaxy Tab to rival Apple’s iPad. It is the first major shied away from more expensive items as overall Tablet contender to use Google’s Android system. discretionary spending levels dropped reflecting However its ability to either capture market share fears of a double-dip recession. from the iPad – given the astonishing levels of brand loyalty shown by Apple consumers - or convince More positively, European sales have risen new users of the benefits of tablets as a whole whilst growth in emerging markets remains strong. remains unclear. The company continues to successfully introduce ‘glocalized’ products that are tailored to regional tastes whilst retaining the core attributes of the McDonald’s brand. McDonald’s have also responded to new demands from traditional markets with products such as breakfast oatmeal, Frappes and smoothies. This year has has seen McDonald’s position move up one place to 17th, and its brand value has increased by US$1.65 billion, going from US$77 billion to US$89 billion. Increasing costs of food commodities may prove challenging going forward. The continuing appeal of the core range, product innovation and growing disposable income 25 © Brand Finance plc 2011 © Brand Finance plc 2011 26
  • 15.
    Top 20 Most Valuable Global Brands 19. 20. 2011 2010 2011 2010 Brand Ranking 19 17 Brand Ranking 20 39 Brand Value (US$m) 21,129 20,654 Brand Value (US$m) 20,798 13,883 Brand Rating AAA AAA- Brand Rating AA A+ Enterprise Value (US$m) 69,868 73,969 Enterprise Value (US$m) 114,328 78,057 Domicile UK Domicile Germany Industry Group Retail Industry Group Auto Manufacturers Tesco is the third and final British brand to appear Mercedez-Benz, the German manufacturer of in the 2011 Brand Finance® Global 500. Though cars, buses, coaches and trucks, is a new entry the brand has dropped two places from last year, into the top 20. The company, which celebrates its it has maintained its high marketing standards and 125th anniversary this year, has shot up the rankings position as the top British brand. Its brand rating has with a brand value of US$20.8 billion, an increase strengthened from AAA- to AAA and brand value of 50% on last year’s value. has increased by nearly US$475 million. Despite the global downturn in the automotive Tesco has replicated its great success in the UK industry, markets have started to recover and across a number of territories worldwide. However sales for premium car brands are rising again. the UK operation remains by far the most profitable In China, the luxury automaker is already the and efforts in some countries are provide a reasonable fastest growing premium brand in the market. throughout the period, the brand has not been financial return. Fresh n Easy, Tesco’s US subsidiary, Competitors BMW and Audi have also fared negatively affected in any major way and has announced in the last quarter of 2010 that 13 stores well, both seeing significant rises in their improved its brand rating from A+ to AA. would be closing due to difficult market conditions, brand value, further indicating that demand with losses totalling £186 million last year. Losses for premium car brands has started to pick have also been reported in China for the second half up again. of 2010 and plans for 80 new shopping malls have been scaled back to 50. 2010 also saw the return of Mercede’s return to Formula One under the name Mercedes The UK supermarket sector has undergone GP Petronas Formula One Team. At the same time, significant change in the last five years with a degree Mercedes also won the hotly contested battle of polarisation. At the premium end, Waitrose is in to secure sponsorship of the Malaysian oil company rude health but there has also been a significant Petronas, a deal valued at €30 million each year challenge from newer value-oriented entrants (in addition to prize winnings). such as Aldi and Lidl, catering to cost-conscious consumers in the wake of the recession. Tesco has However, towards the end of 2010, sought to continue its rapid growth by extending its Mercedes-Benz recalled over 85,000 of its brand into a number of different fields, from mobile products after fears over potential power steering phones to banking. problems in its C and E class sedans, coupes and convertibles. Throughout the recall, the brand stuck to its quality, comfort and safety values by offering free vehicle inspections to customers. Due to the high level of customer service 27 © Brand Finance plc 2011 © Brand Finance plc 2011 28
  • 16.
    Brand Stories 29 © Brand Finance plc 2011 © Brand Finance plc 2011 30
  • 17.
    ‘Rise of the machines’ Google vs Apple Technology has been the key sector in this year’s accompanied by scenes of near hysteria. A recent has diversified its own services hugely. From just BrandFinance® Global 500. Twenty years ago, BBC documentary revealed that Apple devotees a search engine in the late 1990s, Google now offers technology brands were very much on the periphery show brain activity consistent with those who maps, digitised books, news, email, translation and rarely featured in a consumer-facing context. venerate religious iconography when discussing services and much more besides. It is the world’s The 2011 study clearly illustrates how dramatically their favourite Apple products. most visited website. this picture has changed in the last two decades. From work-place tools and entertainment Apple has permeated mainstream society to the Despite its prowess within the technology world, point that it has worldwide, near fanatical fanbase; Google would not instantly seem to be a direct platforms, technology brands now define the way summarised neatly by a quote from the UK’s Bishop competitor for Apple, whose focus has been mainly developed nations carry out many daily activities, on hardware and operating systems. However just of Buckingham who stated, ‘Christianity you have to from socialising and interacting to shopping and wait for the second coming…with Apple it happened as Apple has launched the iPhone, Google has banking. Reflecting this dominance, Google has in 1997’ in reference to the return of Steve Jobs, released its own mobile operating system, Android. replaced Wal-Mart at the top of the list and now who has been central to Apple’s success. Apple In contrast to Apple’s generally tight control, Google tussles with other tech giants for dominance. overtook its arch rival Microsoft’s market value for has adopted a more open strategy with fewer the first time, in 2010. restrictions on application developers and a wide The most high-profile of these rivals is Apple. range of handset providers, the most notable being Founded in 1976 in Cupertino California, Apple now However, just as Apple has bested one rival, another HTC. This strategy appears to have been hugely has 46,600 (as of September 2010) and worldwide has usurped its position in the technology world. successful and Android now has overtaken Apple annual sales of US$65.2 billion. The company Google, launched in 1998, initially just as a search in terms of handset sales. However, reports of the has fostered a brand image that actively sought engine service. It rapidly grew in popularity through iPhone’s decline are almost certainly premature, to rejects the traditional perception of Microsoft the early 2000s, capturing market-share from as in terms of revenue Apple remains unchallenged. as staid and corporate. As Apple’s portfolio of rivals such as Yahoo!. However, following its initial Its earnings for the last quarter were US$11.9 billion products broadened in the 2000s, with the iPod, public offering in 2004, the company moved into a in contrast to Google’s US$1 billion. iPhone and the iPad, the careful cultivation of this different league. US$1.67 billion worth of shares image has continued, with Apple positioning itself were sold, giving Google a market capitalisation of as the lifestyle brand of choice for young, urban, over US$25 billion. Not only did this make many of creative people. Google’s employees paper millionaires overnight, but it would help finance the continued growth However this is more than hollow marketing and spate of acquisitions that Google undertook, spin, Apple commands the kind of devotion other including the acquisition of online video-sharing site brands can only dream of, with new store openings YouTube in 2006 for US$1.65 billion of stock. Google 31 © Brand Finance plc 2011 © Brand Finance plc 2011 32
  • 18.
    Founded in 1923,Disney has become the world’s most recognisable and valuable entertainment brand. The periodical reissuing of its film library means that successive generations grow up listening to Disney songs and watching its animated characters, and then buy the classic films and merchandise for their own sons and daughters. Disney is a global enterprise consisting of four additional business segments – media, theme parks and resorts, studio entertainment and consumer products. This mix of high-quality creativity and successful business acumen has enabled Disney to achieve a AAA+ Brand Rating, one of the highest in the BrandFinance® Global 500. The company actively monetises the equity built up within its brand and is constantly looking to license or extend into new categories, from innovative digital platforms to the more established outlets of theme parks and character licensing. However, by ‘Will there adhering to strict guidelines, the extensions serve to expand the revenue footprint without diluting the core brand equity. The company still leads other entertainment brands, such as Viacom or Fox, in terms of brand value. This is partly due to the fact that consumers are actually brand be a happy loyal to the Disney brand, as opposed to the product brand – e.g. Viacom’s MTV or Fox’s The Simpsons. Coinciding with the release of Disney’s latest movie in 2011 ‘Tangled’, Disney‘s brand value has increased substantially, increasing to ending?’ US$15.4 billion. It continues to be a profitable business, regularly producing contemporary films that are underpinned by messages of positivity and family values and, more recently, incorporating an increasingly contemporary tone. In the short-term, Disney continues to investigate additional revenue streams. There has been coverage in the press alleging that Disney has applied for Walt Disney the trademark of “Seal Team 6”, the name of the elite US Navy Seal Team that killed Osama Bin Laden in Pakistan. The trademark supposedly covers the following areas:”entertainment and education services,” “toys, games and playthings” and “clothing, footwear and headwear.” Whilst there is almost certainly a market for these types of products, particularly in the computer games and toys sectors, it is a potentially hazardous departure from the core Disney positioning and could damage the brand value in the short and medium term, particularly if it is representative of a change in strategy. 33 © Brand Finance plc 2011 © Brand Finance plc 2011 34
  • 19.
    ‘Like?’ This year’s highest new entry is Facebook. With Its commercial clout and diversified service a brand value of US$3.7 billion it still lags other offerings are beginning to seriously threaten much technology giants. However there is no denying larger competitors. Major blue-chip companies are that the social networking site has had the greatest realising that Facebook’s colossal user base and high retention rate make it a potentially invaluable recent cultural impact of any brand in this year’s marketing and communication tool. BrandFinance® Global 500. As an example, the growing rivalry between Facebook Started in Mark Zuckerberg’s dorm room just over Facebook and Google was highlighted recently when five years ago, Facebook has grown to eclipse all Facebook admitted hiring PR firm Burson Marstellar competitors in the social network market place. to smear Google over privacy policies. Despite this, Pioneers such as Friends Reunited, MSN messenger Facebook is rapidly becoming a major commercial and latterly Bebo and Myspace, have all seen their force. Although many exuberant valuations of tech user numbers stall, dwindle or collapse in the face companies are eliciting fears of another tech bubble, of Facebook’s relentless advance. The site’s user there is huge public and private interest in a potential base grew organically, expanding from one Ivy- IPO. Goldman Sachs, the leading investment bank, League campus to another, before swiftly leaping valued the company at over US$50 billion and shares the Atlantic to incorporate prestigious universities in in Mail.Ru performed well on opening, in part due other countries in the UK and Europe. The site’s user to its shareholding in Facebook. Mark Zuckerberg’s base then broadened, covering all social and work elevation to Time Magazine’s man of the year 2010 groups across multiple countries. Facebook now shows how Facebook has captured the public’s has more than 600 million active users around the imagination and, more critically, their activity world and is translated into dozens of language. on the internet. The range of services offered by Facebook has expanded rapidly, partly in a bid to monetise the enormous and growing user base. Through it is based on a traditional web platform, the site increasingly uses targeted adverts based on their user profiles, the groups they join and the branded pages they view. More recently, apps for the android mobile operating system and iPhone have been developed so that Facebook is regularly used remotely by over 250 million people. This has enabled the introduction of the Facebook Places feature, where users ‘check in’ to particular locations. In time, users are expected to be able to redeem discounts at participating retailers for visiting their stores. Meanwhile countless digital marketing companies are cooperating with Facebook to facilitate the relationship between consumers and their clients’ brands, through features such as the ‘like’ button. 35 © Brand Finance plc 2011 © Brand Finance plc 2011 36
  • 20.
    The Top 20 Banking Brands ‘Thank you for smoking’ Marlboro Marlboro is the only tobacco brand in this year’s overt sponsorship activity some time ago. sector will become increasingly commoditised which Global 500 with a brand value of US$5,5 billion, However, this legislation is now sometimes going has a calamitous impact on brand values. ranking 181st. Originally designed as a cigarette further; in Ireland, the government recently banned for women, the brand was repositioned in the 1950s the display of any tobacco items in retailers, thereby However, there are positive signs for manufacturers. to target the growing proportion of male smokers further reducing awareness levels. Brand loyalty levels remain high, propensity to switch between brands remains static and there are who wanted the perceived health benefit of filtered Thirdly, and perhaps most critically in terms of brand examples that the more aggressive legislation may not cigarettes. The initial advertising featured the now value, legislators are now considering implementing be universally implemented. New Zealand introduced iconic imagery of an American cowboy, providing laws that drastically reduce the amount of on-pack and then abandoned restrictions concerning in-store reassurance to male smokers that their masculinity branding that cigarette companies can employ. display of tobacco products after research found there was not undermined by using filters. This immediately prevents companies from was no correlation between the ban and purchasing differentiating their products. Some reports suggest habits. Marlboro and other cigarette companies are now that companies will only be allowed to use the title facing an attack on three fronts from legislators. of their product, written in a generic black font on a Unsurprisingly the developing world offers major Firstly, an increasing number of jurisdictions are plain white background. opportunities. Although China has a lower per capita banning smoking in public places, with a handful of number of smokers than most countries, it consumes cities in the US state of California taking the most A brand is much more than simply the title of the approximately one third of the world’s cigarettes. restrictive policy in prohibiting smoking on beaches product or service, particularly in the consumer goods Assuming legislation in these countries remains and in public parks. And where the liberal, health- sector. It is an indicator of a specific experience tolerant, there is no reason why Marlboro will not hold conscious West Coast goes, many follow. for the purchaser. If a company is unable to drive on to its position in the Global 500. awareness or differentiate itself, it will struggle not Secondly, many national policy-makers only to attract new consumers but it will also become banned conventional cigarette advertising and harder to charge a price premium. As a result, the 37 © Brand Finance plc 2011 © Brand Finance plc 2011 38
  • 21.
    ‘Game on’ Xbox 360 vs PS3 vs Wii Relatively few people outside the video gaming and quality of games soon increased. Crucially new market of casual gamers which is less male- industry realise the sheer size of this sector. In 2009, however, Sony envisaged the PS3 as far more than focused and more family-oriented than traditional computer and video games software sales in the just a games console. The PS3 has been used as a gaming audiences. Titles such as Wii Party encourage US were US$10.5 billion. This was just US$100 loss leader to trump the competition in the broader group participation and a reduced time commitment, million behind total US box office takings for the electronic entertainment category; the company while the Wii Fit device encourages adults to use the made a staggering US$3 billion loss on the first 41 console as part of their fitness regime. As well as same period. In this context it is unsurprising that million units sold. There is method in the apparent its shrewd identification of new markets, key to the the three largest home console brands, Microsoft’s madness, as every PS3 has been a ‘Trojan Horse’ Wii’s success to date has been its motion sensitive Xbox (207th), Sony’s Playstation (316th) and for Sony’s blu-ray disc player. Mindful of having lost controllers, which were a unique selling point for Nintendo’s Wii (318th), feature prominently in the the VHS-Betamax format war in the 1980s, Sony four years following the 2006 release. 2011 BrandFinance® Global 500. were determined it would not happen again given the importance of the high definition DVD market. This novel and engaging feature, though unchallenged Playstation arrived in the 1990s and ever since Having learnt from their mistakes, Sony’s blu-ray until late 2010, now faces stiff competition from the arrival of Xbox in 2001, the two brands have format has eclipsed Toshiba’s rival HD DVD format. Playstation’s ‘Move’ and Xbox’s ‘Kinect’. The latter competed head-to-head, particularly for more However, Playstation has recently suffered from has taken motion sensitive controllers to the next committed ‘hardcore’ gaming audience. Xbox’s a major security breach in Sony’s online gaming level by eliminating the need for a hand-held device, latest iteration, the Xbox 360, was released in 2005, and digital media distribution service, where more instead relying on a camera and body-movement while the third outing for Playstation, the PS3, was than 70 million users had their personal information sensor. It has proved to be a phenomenal success, launched in 2006. The Xbox 360 has tended to stolen. Though this is not represented in this year’s shipping over 10 million units and becoming the outsell the PS3 by a small margin; 55 million units figures, it will almost certainly negatively impact its world’s fastest selling consumer electronics device compared to approximately 50 million. This is due brand value next year. according to Guinness World Records. in part to the massively successful Halo franchise, exclusive to Xbox, and Microsoft’s online multiplayer Sony and Playstation have the monumental task of As a result, Nintendo are planning on releasing the gaming service Xbox Live, which receives fairly convincing its users that their personal and financial next iteration of the Wii in 2012 which is rumoured universal praise for its ease and usability. Xbox details are safe in their hands. If Sony is able to to be more powerful than both the Xbox360 and Live continues to grow with currently more than 25 mitigate the negative customer perception effects the PS3 and offer high definition video output. Wii’s million subscribers, a significant revenue stream for of the security breach, they will be in a strong brand is valued at US$3.32 billion which places it Microsoft. As a result, Xbox has emerged ahead of position to build on their US$3.34 billion brand value just behind PlayStation. its rivals in this year’s Global 500, with a brand value and challenge Xbox’s position as the number one of US$4.72 billion. home gaming console brand over the next year. The next couple of years will be a dynamic and The third player is the Wii, produced by veteran interesting time in the home console market. The Despite marginally losing out to Microsoft, Sony console manufacturer, outsells both Xbox and key question for Nintendo is whether its forecast should not be too disappointed with its performance. Playstation, with 80 million units sold. Nintendo have innovations will be sufficiently appealing to allow it to Since its launch, the PS3’s initially limited range of traditionally targeted a slightly younger audience, successfully compete against Xbox and Playstation, desirable game titles and higher price point were with simpler gameplay and friendly, colourful or whether it will suffer in the long-term from its considerable disadvantages. However, game characters such as Mario. This distinctive approach lack of appeal to the hard-core gaming audience. developers have slowly come to grips with the has been extended with the Wii, which has not only machine’s hardware capabilities, and the number targeted younger gamers, but has created a huge 39 © Brand Finance plc 2011 © Brand Finance plc 2011 40
  • 22.
    ‘Can they kick it ...yes, they can’ was viewed more than 14 million times in less than a month. When official sponsor Adidas produced its own Star Wars themed World Cup video featuring David Beckham it had 2.8 million views in its first week. Puma is still a small player relative to Adidas and Nike. Its brand value fell to US$1.5 billion in 2009, but has crept up in recent years, and in 2011, has Nike vs Adidas vs Puma reached its highest Global 500 brand value figure ever of US$2.3 billion. Part of Puma’s rise is attributable to their decision, taken in 2003, to sponsor a 16-year-old Jamaican athlete called Ussain Bolt. That sponsorship has enabled Puma to associate itself with a series The sports industry is booming. With rising budgets US Masters’ tournament, depicted the sportsman of phenomenal athletic performances that have helping to promote elite athletes and teams to even staring into the camera, being asked whether he has captivated global audiences. When Bolt virtually the remotest markets in the world, the potential learnt anything from his mistakes. The commercial sauntered to record-breaking 100 and 200 meter customer base is truly global. polarised audiences, but more importantly for Nike, world records in 2009 wearing Puma, the media Woods lost the World No. 1 ranking in October 2010 value for the company alone was over US$105 Nike remains the most valuable brand in the apparel and has continued on a winless streak ever since. million. industry in the BrandFinance® Global 500, increasing in both brand value and ranking (31st), rising two Adidas is Nike’s main competitor, and despite In 2010 Puma made history when Bolt signed the places since the previous year. setting its sights to overtake the overall market biggest sponsorship deal ever recorded in athletics. leader, Adidas has this year failed to beat Nike in the Although the exact figures for the deal were not 2009 was an eventful year for Nike. The Oregon- Global 500, ranking 139th. Its brand value has also released, it was said to be comparable to that of based company became the official sponsor of the increased from last year to US$6.8 billion. In 2010 Cristiano Ronaldo’s four year contract with Nike that Vancouver Winter Olympics but faced a difficult Adidas, who has for many years been the official kit was worth US$32.5 million. Unsurprisingly Puma decision when Tiger Woods, the long-reigning, golf sponsor for Olympic Games for Team Great Britain, have announced that Bolt will play a vital role in the world no. 1 and long-term Nike spokesperson, took a announced that they would team up with British marketing of the company in the run up to London leave of absence from the sport after being exposed designer Stella McCartney to make the kit as stylish 2012. by multiple media outlets as a serial adulterer. as possible. This heavily impacted his commercial appeal, While placing at 492nd in the Global 500 this year, with several sponsors – including Accenture, the Another event which brought the two companies Puma has the ingredients and heritage to increase US professional services firm - withdrawing their directly against each other was the FIFA World its brand value and rise up the table. Selecting endorsement contracts. Nike, however, stood by Cup 2010, held in South Africa. While nine of the the right rising athletic and sports stars, clearly their man. Hoping that he would once again regain 32 teams wore kit made by Nike, 12 wore Adidas. differentiating themselves against Nike and Adidas, his title and winning ways, the company released Despite Adidas being the official sponsor of the capitalising on their sporting heritage and treading a bold TV commercial that incorporated his late event, Nike employed various ambush marketing a delicate path between product innovation and father’s voice, attempting to redeem his status as techniques, particularly online, to drive awareness of continuing their success of producing more style- a family-friendly, aspirational sporting icon. The TV its brand. When Nike launched its World Cup advert, driven, non-performance-related product lines will spot, shown before Woods’ return to play in the featuring Wayne Rooney and Cristiano Ronaldo it all play a part. 41 © Brand Finance plc 2011 © Brand Finance plc 2011 42
  • 23.
    ISO 10668: Global standard for brand valuations 43 © Brand Finance plc 2011 © Brand Finance plc 2011 44
  • 24.
    ISO 10668: Global standard for brand valuations In December 2010, Brand Finance became one of the very few companies in the world to be accredited with the ISO 10668 global standard for brand valuations. ISO 10668 is the international norm that sets minimum standard requirements for the procedures and methods used to determine the monetary value of brands. David Haigh, CEO Brand Finance, was the UK representative on the ISO working party and chaired drafting meetings over a 2 year period to shape ISO 10668 – ‘Brand valuation – Basic requirements for methods of monetary brand valuation’. In 2007 the International Organization for Standardization (‘ISO’), a worldwide federation of national standard setting bodies, set up a task force to draft an International Standard (‘IS’) on monetary brand valuation. ‘IS 10668 gives brand IS 10668 – Monetary Brand Valuation – was released in Q4 2010, setting out the principles which should valuation analysis the be adopted when valuing any brand. The new IS applies to brand valuations commissioned for all purposes, including: accounting and financial reporting, insolvency, tax planning and strategic planning. institutional credibility Under IS 10668 the brand valuer must declare the purpose of the valuation as this affects the premise which it previously lacked. or basis of value, the valuation assumptions used and the ultimate valuation opinion, all of which need to be transparent to a user of the final brand It professionalises brand valuation report. Requirements of an ISO compliant brand valuation management’ IS 10668 is a summary of existing best practice and intentionally avoids detailed methodological work David Haigh, CEO, Brand Finance plc steps and requirements. It applies to all proprietary and non-proprietary brand valuation approaches and methodologies that have been developed over the 45 © Brand Finance plc 2011 © Brand Finance plc 2011 46
  • 25.
    ISO 10668: Global standard for brand valuations year, providing they follow the fundamental principles Financial analysis Brand Valuation or generic products or services. In practice it is often specified in the standard. IS 10668 specifies that Approaches difficult to identify unbranded comparators. To identify valuers must conduct three types of analysis before the full impact on demand created by a brand the Price passing an opinion on the brand’s value: ‘Legal’, Premium method is typically used in conjunction with ‘Behavioural’ and ‘Financial’. Market Cost the Volume Premium method. Taken together these Income Approach Approach Approach methods provide a useful insight into the value a brand Legal analysis adds to revenue drivers in the business model. Other Based on an Based on the Based on estimating methods go further to explain the value impact of estimate of the premise that a the expected future, price expected to be prudent investor after-tax cash brands on revenue and cost drivers. IS 10668 specifies three alternative brand valuation realised if the brand would not pay more flows attributable approaches - the ‘Market’, ‘Cost’ and ‘Income’ were to be sold in an for a brand than the to the brand then Income-split method - this starts with net operating open market. cost to recreate, discounting them approaches. The purpose of the brand valuation, the replace or reproduce to a present value profits and deducts a charge for total tangible capital premise or basis of value and the characteristics of the an asset of using an appropriate employed in the branded business, to arrive at subject brand dictate which primary approach should similar utility. discount rate. ‘economic profits’ attributable to total intangible capital be used to calculate its value. employed. Behavioural analysis is used to identify the The first requirement is to define what is meant Brand Valuation percentage contribution of brand to these intangible Market approach - measures value by reference Approaches economic profits. The value of the brand is deemed by ‘brand’ and which intangible assets should be included in the brand valuation opinion. The valuer to what other purchasers in the market have paid to be the present value of the percentage of future must precisely determine the bundle of Intangible for similar assets to those being valued. It produces intangible economic profits attributable to the brand. Assets and Intellectual Property Rights included in the an estimate of the price if the brand were to be sold Market Cost Approach Income Approach Approach definition of ‘brand’. in the open market. However, as brands are unique and Other approaches include Multi-period excess earnings it is often hard to find relevant comparables, this is not and incremental cash flow method, which is more The valuer is required to assess the legal protection a widely used approach. Direct Methods Indirect or frequently used for strategic purposes. afforded to the brand by identifying each of the legal Residual Methods rights that protect it, the legal owner of each relevant Cost approach - measures value by reference What will be the impact of ISO 10668? Royalty relief Income-split legal right and the legal parameters influencing to the cost invested in creating, replacing or reproducing method method negatively or positively the value of the brand, covering the brand. This approach is based on the premise that IS 10668 was developed to provide a consistent each geographical jurisdiction and product or service a prudent investor would not pay more for a brand than Price Premium Multi-period excess framework for the valuation of local, national & Volume Premium earnings method registration category. the cost to recreate, replace or reproduce an asset of method and international brands both large and small. similar utility. As the value of brands seldom equates The primary concern was to create an approach to Incremental cash Behavioural analysis to the costs invested creating them (or hypothetically flow method brand valuation which was transparent, reconcilable replacing or reproducing them), this is not a widely and repeatable. In the wake of the standard’s launch used approach. it is expected that many companies will either value ISO 10668 outlines various methods for their brands for the first time or revalue them Income approach - measures value by reference conducting the income approach: to comply with the standard. to the economic benefits expected to be received over the remaining useful economic life of the brand. Royalty Relief method - the most widely used This involves estimating the expected future, method used to determine brand cash flows. This after-tax cash flows attributable to the brand then method assumes that the brand is not owned by the The brand valuer must then understand and form an discounting them to a present value using an appropriate branded business but is licensed in from a third party. opinion on likely stakeholder behaviour in each of the discount rate. The value is deemed to be the present value of the geographical, product and customer segments in which royalty payments saved by virtue of owning the brand. the subject brand operates. To do this it is necessary As the value of brands stems from their ability to This method is widely used because it is grounded in to understand: generate higher profits for either their existing or commercial reality and can be benchmarked against potential new owners this is the most widely accepted actual transactions. • Market size and trends and used brand valuation approach. • Contribution of brand to the purchase decision Price Premium and Volume Premium methods - • Attitude of all stakeholder groups to the brand brands systematically are likely to be more sustainable estimates the value of a brand by reference to the price • All economic benefits conferred on the branded long term. premium it commands over unbranded, weakly branded business by the brand 47 © Brand Finance plc 2011 © Brand Finance plc 2011 48
  • 26.
    Explanation of the Methodology The methodology employed in this BrandFinance® Royalty Relief Approach Global 500 listing uses a discounted cash flow (DCF) technique to discount estimated future royalties, at Brand Finance uses the royalty relief methodology that determines the value of the brand in relation an appropriate discount rate, to arrive at a net to the royalty rate that would be payable for its use present value (NPV) of the trademark and associated were it owned by a third party. The royalty rate is intellectual property: the brand value. applied to future revenue to determine an earnings stream that is attributable to the brand. The brand The steps in this process are: earnings stream is then discounted back to a net present value. 1. Obtain brand-specific financial and revenue data. The royalty relief approach is used for three 2. Model the market to identify market demand reasons: it is favoured by tax authorities and and the position of individual brands in the the courts because it calculates brand values by context of all other market competitors. Three reference to documented third-party transactions; forecast periods were used: it can be done based on publicly available financial • Historical financial results up to 2010. information and it is compliant to the requirement Where 2010 results are not available forecast under the International Valuation Standards using Institutional Brokers Estimate System Committee (IVSC) to determine Fair Market Value (IBES) consensus forecasts are used. of brands. • A five-year forecast period (2011-2015), based on three data sources (IBES, historic growth Brand Ratings and GDP growth). • Perpetuity growth, based on a combination of These are calculated using Brand Finance’s growth expectations (GDP and IBES). ßrandßeta® analysis, which benchmarks the strength, risk and future potential of a brand relative 3. Establish the royalty rate for each brand. This to its competitors on a scale ranging from AAA to D. is done by: It is conceptually similar to a credit rating. • Calculating brand strength – on a scale of 0 to 100, according to a number of attributes The data used to calculate the ratings comes from such as financial, brand equity, market share various sources including Bloomberg, annual reports and profitability, among others. and Brand Finance research. • Use brand strength to determine ßrandßeta® Index score. Brand Ratings Definitions • Apply ßrandßeta® Index score to the royalty rate range to determine the royalty rate for the brand. The royalty rate is determined AAA Extremely strong by a combination of the sector of operations, AA Very strong historic royalties paid in that sector and profitability of the company. A Strong BBB-B Average 4. Calculate future royalty income stream. CCC-C Weak 5. Calculate the discount rate specific to each DDD-D Failing brand, taking account of its size, geographical presence, reputation, gearing and brand rating Note: The AAA to A ratings can be altered by (see opposite). including a plus (+) or minus (-) sign to show their more detailed positioning. Valuation Date 6. Discount future royalty stream (explicit forecast and perpetuity periods) to a net present value – Valuation Date i.e.: the brand value. All brand values in the report are for the end of the year, 31st December 2010. 49 © Brand Finance plc 2011 © Brand Finance plc 2011 50
  • 27.
    About Brand Finance is an independent global business focused on advising strongly branded organisations on how to maximize value through the effective management of their brands and intangible assets. Since it was founded in 1996, Brand Finance has Brand performed thousands of branded business, brand and intangible asset valuations worth trillions of dollars. Brand Finance’s services support a variety of business needs: • Technical valuations for accounting, tax and legal purposes Finance • Valuations in support of commercial transactions (acquisitions, divestitures, licensing and joint ventures) involving different forms of intellectual property • Valuations as part of a wider mandate to deliver value-based marketing strategy and tracking, thereby bridging the gap between marketing and finance. Our clients include international brand owners, tax authorities, IP lawyers and investment banks. Our work is frequently peer-reviewed by the big four audit practices and our reports have also been accepted by various regulatory bodies, including the UK Takeover Panel. Brand Finance is headquartered in London and has a network of international offices in Amsterdam, Bangalore, Barcelona, Cape Town, Colombo, Dubai, Geneva, Helsinki, Hong Kong, Istanbul, Lisbon, Madrid, Moscow, New York, Paris, Sao Paulo, Sydney, Singapore, Toronto and Zagreb. www.brandfinance.com 51 © Brand Finance plc 2011 © Brand Finance plc 2011 52
  • 28.
    About Brand Finance Brand Finance is an independent global business focused on advising strongly branded organisations on how to maximize value through the effective management of their brands and intangible assets. At Brand Finance, we are entirely focussed on quantifying and leveraging intangible asset value. Our services compliment and support each other, resulting in robust valuation methodologies, which are underpinned by an in-depth understanding of revenue drivers and licensing practice. Valuation Analytics Strategy Transactions We perform valuations Our analytical services We give marketers the We help private equity for financial reporting, tax help clients to better framework to make companies, venture planning, M&A activities, understand the drivers effective economic capitalists and branded joint ventures, IPOs of business and brand decisions. Our value- businesses to identify and other transactions. value. Understanding based marketing service and assess the value We work closely with how value is created, enables companies opportunities through auditors, tax authorities where it is created and to focus on the best brand and market due and lawyers. the relationship between opportunities, allocate diligence and brand brand value and business budgets to activities that licensing. value is a vital input to have the most impact, strategic decision making. measure the results and articulate the return on brand investment. Financial reporting Brand equity drivers Brand strategy Brand due diligence Tax and transfer pricing Brand strength analysis Brand architecture Brand licensing Litigation Fundraising Brand risk analysis Brand extension Investor relations (ßrandßeta®) Budget setting and Brand scorecards allocation Marketing mix modelling Brand value added (BVA®) Marketing ROI 53 © Brand Finance plc 2011 © Brand Finance plc 2011 54
  • 29.
    Our Services Valuation Analytics Combined with brand valuation results, our analytical Budget Determination: We help clients identify service creates the framework for better corporate which products or services and brands create We conduct valuation and analytics assignments Our analytical services help clients to better reporting and brand performance management. or destroy the most value. Clients can use this for branded enterprises and branded businesses. understand the drivers of business and brand to allocate resources and budgets across their We value brands, intangible assets and intellectual value. Understanding how value is created, where Strategy marketing activities to yield the best returns. property in many jurisdictions for accounting, tax, it is created and the relationship between brand corporate finance and marketing purposes. We value and business value is a vital input to strategic We conduct market studies, market sizing, feasibility Communications Strategy: We help companies act on behalf of intellectual property owners, tax decision making. By furthering knowledge of this studies, brand audits and brand portfolio evaluation. develop effective results-oriented communication authorities and work closely with lawyers, private relationship, Brand Finance is able to help clients’ Combining market intelligence, brand analytics, strategies. All communication strategies are driven equity firms, and investment banks. leverage brand value and ultimately maximise market research and financial assessment, we by market research with the aim of meeting clients shareholder value. provide greater depth and insights into our clients’ key objectives including building goodwill across Our work is frequently peer-reviewed by independent strategies. customer base; generating sales; creating and audit practices and our approach has been accepted Some of our key analytical services include: reinforcing brand and professional corporate image; by regulatory bodies worldwide. Some of our key Brand Strategy Advisory informing and creating positive perceptions and Brand Dashboards and Scorecards: We help Services include: assisting in the introduction of new products Reasons for Brand Valuation Financial companies improve brand performance management to market. Reporting: and reporting by integrating market research, Brand Strategy Evaluation: We help clients investment, market and financial metrics into a make disciplined choices about how to maximise Transactions Accounting standards in most developed markets single insightful model to track performance over economic value, by providing a framework for allow for capitalisation of purchased intangible time and against competitors and to uncover the optimal resource allocation and strategy selection. Our transaction support services help companies assets. The initial valuations and subsequent most important drivers of overall brand and business This helps identify the value optimising allocation of evaluate and mitigate risks, extract maximum impairment reviews generally require the opinion of value. marketing investment, provides a strategic overview value in mergers and acquisitions as well as private an independent valuation expert. of the risks and returns associated with each market equity investments. We also assist private equity Competitor Benchmarking: We conduct a segment companies, venture capitalists, brand owners Tax Planning: The growing importance of intangible benchmarking study of the strength, risk and future and businesses identify and assess the value of assets has significant tax planning implications. potential of a clients brand relative to its competitor Strategic Optimisation: We help branded opportunities through brand due diligence and brand Brand Finance works for both fiscal authorities and set. This helps understanding the strengths and businesses increase their value. Using brand strategy option, including licensing. brand owners on transfer pricing and capital gains weaknesses of the client brand compared with key valuation techniques, we help clients determine the tax issues. competitor brands. financial impact of different strategic brand options Some of our key Transaction Support such as licensing, joint ventures, investment, Services include: Dispute Resolution: We have helped clients protect Value Drivers Analysis: We help businesses divestment, brand architecture changes, entering the commercial value of their brands through a range understand the relationship between brand attributes or exiting new segments or markets and other Brand and Market Due Diligence: We help clients of licensing and trademark disputes that have been and key value drivers in the business model. This transactions. by valuing branded businesses, brands and other settled both in and out of court. We also provide is achieved by creating a framework for measuring intangible assets for purchase or sale providing litigation support work for various legal firms and IP brand equity and connecting it to value driving Brand Architecture and Portfolio review: We help reassurance to the investment and management companies. behaviour in each stakeholder group. Resources companies evaluate different branding architecture teams. In addition, we assist in securing finance can then be allocated and prioritised based on the scenarios. Using sensitivity analysis, this identifies against brands by using a mixture of financial, legal, Marketing & Brand Management: There is an overall impact on financial value. potential addition or loss of economic value under marketing and commercial due diligence. increasing demand from investors and analysts for alternative brand architecture options and enables information on brand value and brand performance. Demand Forecasting: We provide clients with a informed decision making. Brand Licensing and Franchising: We help Brand Finance advises clients on both the external market demand forecasting framework for long maximise earnings and provide greater brand disclosures and required brand metrics. Our term strategic planning. Market Entry and New Product Development: presence and knowledge by identifying the best valuation services have assisted many companies to We work together with companies to develop opportunities for licensing and franchising, both understand and improve the value of their intangible Marketing Mix Modelling: We help improve the successful market entry and new product internally and externally. We also provide advice assets. efficiency of brand campaign planning and targeting strategies. on best practice in licensing agreements. by isolating and quantifying the impact of different Commercial Transactions: We help clients to marketing activities. The model guides the mix and Naming and Visual Identity Management: Purchasing & Sales: We provide clients with an determine the value of their intangible assets and combination of future marketing activities We work together with clients to help develop understanding of the financial potential of their enterprise value for mergers and acquisitions, research-based naming strategies that are aligned intellectual property to help inform negotiation of negotiations, franchise and licensing and deal Marketing ROI: We help clients improve decision- with the overall business objectives of the company. rates and terms to strike the best deals. Our role also structuring to ensure that they make informed making by providing insights which assist with In addition, we help manage the entire visual identity includes the identification of potential purchasers decisions. budget optimisation, resource allocation, brand process to help ensure that new and refreshed and execution of the sales process. performance and evaluation of marketing activities. brand identities are implemented efficiently and effectively. 55 © Brand Finance plc 2011 © Brand Finance plc 2011 56
  • 30.
    Brand Finance continues to develop and expand In the last year Brand Finance has made BrandGenius® three important developments. BrandGenius Ltd is a company within the Brand Finance group, based in the new Haymarket Our experts each have decades of experience, and are recognised as leaders in their fields. offices, which provides a full range of expert They include: branding services, covering all aspects of Peter Fisk, the well-known author, speaker and 1 > Moving to new offices. consulting, innovation, communications and design. advisor on marketing, branding and innovation. Peter Our global headquarters This complements and extends Brand Finance’s capabilities to build brand value for clients. We can is author of the best-selling books Marketing Genius, is now at 56 Haymarket, centrally located between Piccadilly Circus and help resolve any sort of branding issue. Consumer Genius and Creative Genius. Peter is a business innovator, strategist and marketer, having Trafalgar Square in the very centre of London. BrandGenius combines the yin and yang of brand spent many years working with the likes of American building. We bring together creative magic with Express and Coca Cola, Microsoft and Virgin. commercial logic, driven by real customer insight, 2 > Expanding our range of brand league tables engaging your leaders and colleagues, and focused on making the best financial impact. David Hensley, the brand and business strategist. David has written many articles and contributed to books on branding and business strategy, as well to include more Sector and Country league tables. As well our established BrandGenius has a different way of working from as winning awards for creative brand design work. other brand consultancies and design agencies, in David worked for McKinsey & Company before Banking, Insurance and Telecoms league tables, we have now produced that we have a roster of leading experts in different becoming European Director of Consulting at FutureBrand and then Senior Partner at Lippincott in the rankings for the top Wines and Spirits brands, Beer brands, Cosmetics aspects of branding from around the world, and bring London before founding his own branding practice, them into client situations as needed. This means brands, Airlines, Cars, Advertising Agencies and many more. that we can give objective, impartial advice as we Hensley Partners. In his early career he worked as don’t have to keep our teams of experts or designers a marketer for Shell, and as a strategist for Carlton busy, yet also have the breadth of expertise to Communications. 3 > Growing BrandGenius®, the brand strategy and address branding issues of any complexity. Richard Gowar, the strategy and brand growth expert. Richard has worked with international innovation service line. This provides expert advice and support to clients, brand owners from Durex to Diamonds. Richard is the former President of Global Brands at Allied addressing and resolving a whole range of branding issues including brand Domecq and now works with a range of businesses and entrepreneurs to help them get the most out positioning, innovation, design, communication and implementation. of their budgets to achieve creative and successful turnaround programmes. 57 © Brand Finance plc 2011 © Brand Finance plc 2011 58
  • 31.
    Brand Finance ® Forums Brand Finance is committed to the development of theoretical and practical issues surrounding brands. As part of this process, we organise a series of events and forums around the world where leading practitioners in the area of brand strategy, brand building and brand valuation come together to share their experiences and to better understand the process by which valuable brands are created. The Brand Finance Forum has progressively become “Understanding the one of the definitive events in the area of brand valuation and should not be missed by anyone who is serious about maximising the value of their brands role of the brand and intangible assets. To find out more visit www.brandfinanceforum.com in the generation of profit is vital to all businesses. The Brand Finance Forum helped to create a breakthrough for Brandirectory is an online encyclopedia of brands where financial results, visual identities, my company.” trademark histories and the latest marketing news are compiled and shared. Ex-Chairman, • Brand league tables Shell Brands International, Switzerland • Brand valuation reports • Brand profiles • Brand comparison tool It is an invaluable resource for brand managers, offering detailed brand profiles and comparative analysis across all major commercial sectors. Our league tables are the most comprehensive table of published brand values in the world. To find out more visit www.brandirectory.com 59 © Brand Finance plc 2011 © Brand Finance plc 2011 60
  • 32.
    Glossary of Terms Disclaimer Brand Holding company Brand Finance has produced this study with an A brand is a trademark and associated Intellectual A company controlling management and operations independent and unbiased analysis. The values Property in another company or group of other companies derived and opinions produced in this study are ßrandßeta® Institutional Brokers Estimate System based only on publicly available information and Brand Finance’s proprietary method for adjusting (IBES) certain assumptions that Brand Finance used where a weighted average cost of capital (WACC) to arrive A system that gathers and compiles the different such data was deficient or unclear. No independent at a specific discount rate for each brand (based estimates made by stock analysts on the future earnings verification or audit of such materials was on its Brand Rating) for most of the major publicly traded companies undertaken. Brand Finance accepts no responsibility Branded business Intangible asset and will not be liable in the event that the publicly The whole business trading under particular brands, An identifiable non-monetary asset without physical available information relied upon is subsequently the associated goodwill and all the other tangible and substance found to be inaccurate. intangible elements at work within the business Net present value (NPV) The BrandFinance® Global 500 brand valuations Brand rating The present value of an asset’s net cash flows (minus follow IVSC guidance but will only comply with ISO A summary opinion, similar to a credit rating, on a brand any initial investment) 10668 Monetary Brand Valuation Standard when based on its strength as measured by Brand Finance’s accompanied by detailed Legal and Behavioral ßrandßeta® analysis Market Capitalisation (Market Cap) analysis. Current price per share multiplied by the number Brand value of shares in issue The net present value of the estimated future cash The conclusions expressed are the opinions of Brand flows attributable to the brand (see Explanation Perpetuity Growth Finance and are not intended to be warranties or of Methodology for more detail) Is the stable growth rate assumed to be effective guarantees that a particular value or projection can be in perpetuity following the last explicit forecast period achieved in any transaction. The opinions expressed Compound Annual Growth Rate (CAGR) in the report are not to be construed as providing The year-over-year growth rate of an investment over Royalty Rate investment advice. Brand Finance does not intend a specified period of time The rate at which usage-based payments are made the report to be relied upon for technical reasons by one party (the licensee) to another (the licensor) and excludes all liability to any organisation. Discounted cash flow (DCF) for ongoing use of the licensor’s asset, sometimes an A method of evaluating an asset value by estimating intellectual property right future cash flows and taking into consideration the time value of money and risk attributed to the future Royalty Relief Method cash flows Please see methodology section Discount rate Tangible Net Assets The interest rate used in discounting future cash Calculated as the total assets of a company, minus flows any intangible assets such as goodwill, patents and trademarks, less all liabilities and the par value Disclosed Intangibles of preferred stock This represents the value of acquired intangible assets as reported in a group’s financial statements Tangible Value The fair market value of the monetary and physical Enterprise value assets of a business The combined market value of the equity and debt of a business less cash and cash equivalents Undisclosed Intangible Value This represents the value of the intangible assets Fair market value (FMV) which are not separately reported in a group’s financial The price at which a business or assets would change statements (e.g. Goodwill, patents) hands between a willing buyer and a willing seller, neither of whom are under compulsion to buy or sell Weighted average cost of capital (WACC) and both having reasonable knowledge of all relevant An average representing the expected return on all of facts at the time a company’s securities. Each source of capital, such as stocks, bonds, and other debt, is assigned a required Global Intangible Finance Tracker (GIFT) rate of return, and then these required rates of return The Brand Finance ‘Global Intangible Finance Tracker are weighted in proportion to the share each source of is the most extensive report ever compiled into capital contributes to the company’s capital structure intangible assets and covers over 5,000 companies in 25 countries 61 © Brand Finance plc 2011 © Brand Finance plc 2011 62
  • 33.
    Contact Details Brand Finance plc is the leading independent For further information on Brand Finance®’s services intangible asset valuation and brand strategy firm, and valuation experience, please contact your local representative as listed below: helping companies to manage their brands more intelligently for improved business results. For further enquiries relating to this report, Name of please contact: Email address contact Australia Tim Heberden t.heberden@brandfinance.com Brazil Gilson Nunes g.nunes@brandfinance.com David Haigh CEO Canada Mike Rocha m.rocha@brandfinance.com Croatia Borut Zemljic b.zemljic@brandfinance.com david.haigh@brandfinance.com France Richard Yoxon r.yoxon@brandfinance.com Marc Holland m.cloosterman@brandfinance.com Cloosterman Hong Kong Rupert Purser r.purser@brandfinance.com Mike Rocha Managing Director India Unni Krishnan u.krishnan@brandfinance.com Portugal Pedro Tavares p.tavares@brandfinance.com m.rocha@brandfinance.com Russia Alexander a.eremenko@brandfinance.com Eremenko Singapore Samir Dixit s.dixit@brandfinance.com South Africa Ollie Schmitz o.schmitz@brandfinance.com Professor Malcolm McDonald Chairman UK Spain Pedro Tavares p.tavares@brandfinance.com Ruchi Sri Lanka r.gunewardene@brandfinance.com Gunewardene m.mcdonald@brandfinance.com Switzerland Mike Rocha m.rocha@brandfinance.com Muhterem Turkey m.ilguner@brandfinance.com Ilguner Willian E USA w.barker@brandfinance.com Barker For all other countries, please email: enquiries@brandfinance.com www.brandfinance.com 63 © Brand Finance plc 2011 © Brand Finance plc 2011 64
  • 34.
    Appendix 65 © Brand Finance plc 2011 © Brand Finance plc 2011 66
  • 35.
    BrandFinance ® Global 500 2011 Brand Brand Brand Brand Brand Brand Value / Brand Value / Brand Brand Brand Value / Brand Value / Brand Rank Rank Enterprise Enterprise Rank Rank Enterprise Enterprise Brand Industry Domicile Value Rating Enterprise Value Enterprise Rating Brand Industry Domicile Value Rating Enterprise Value Enterprise Rating 2011 2010 Value Value 2010 2011 2010 Value Value 2010 2011 2011 Value 2010 Value 2010 2011 2011 Value 2010 Value 2010 (%) 2010 (%) (%) 2010 (%) 1 2 Google Internet United States 44,294 AAA+ 143,016 31% 36,191 23% AAA+ 26 40 Chase Banks United States 19,150 AA- 90,089 21% 13,400 69,901 19% AA 2 5 Microsoft Software United States 42,805 AAA+ 165,725 26% 33,604 199,990 17% AAA+ Consumer 27 28 Intel United States 19,078 AA+ 92,546 21% 16,642 95,316 17% AA+ Electronics Retail-Department 3 1 Wal-Mart United States 36,220 AA 154,325 23% 41,365 190,803 22% AA 28 43 Bradesco Banks Brazil 18,678 AAA 69,604 27% 13,299 56,583 24% AAA- Stores 4 4 IBM IT services United States 36,157 AA+ 189,718 19% 33,706 180,028 19% AA 29 25 Orange Telecoms Services France 18,622 AA+ 106,791 17% 18,352 120,119 15% AA 5 7 Vodafone Telecoms Services Britain 30,674 AAA+ 192,456 16% 28,995 178,604 16% AAA 30 27 Shell Oil&Gas Netherlands 18,605 AAA- 222,664 8% 16,997 208,854 8% AAA- Bank of 6 12 Banks United States 30,619 AAA- 120,195 25% 26,047 111,754 23% AAA+ 31 33 Nike Apparel United States 18,437 AAA 31,590 58% 15,808 24,776 64% AAA America General Miscellaneous 32 42 Amazon Internet United States 17,780 AA 64,132 28% 13,340 54,962 24% AA 7 6 United States 30,504 AA+ 475,066 6% 31,909 528,713 6% AA+ Electric Manufactur Consumer 33 66 Nestlé Food Switzerland 17,455 AA 66,288 26% 11,178 39,319 28% AAA- 8 20 Apple United States 29,543 AAA 244,382 12% 19,829 156,416 13% AAA- Electronics 34 45 Barclays Banks Britain 17,358 AA 50,683 34% 13,134 56,155 23% AA 9 15 Wells Fargo Banks United States 28,944 AA+ 136,069 21% 21,916 131,225 17% AA 35 54 ICBC Banks China 17,194 AA 218,132 8% 12,083 225,368 5% AA+ 10 11 AT&T Fixed Line United States 28,884 AA+ 235,987 12% 26,585 229,793 12% AA+ 36 36 Citi Banks United States 17,133 AA 105,323 16% 14,362 70,105 20% A+ 11 8 HSBC Banks Britain 27,632 AAA 171,163 16% 28,472 193,794 15% AAA+ China 37 55 Construction Banks China 17,092 AA 205,564 8% 12,076 208,117 6% AA+ Bank 12 14 Verizon Telecoms Services United States 27,293 AA 381,093 7% 23,029 196,293 12% AA 38 44 UPS Transportation United States 17,012 AA+ 73,300 23% 13,170 61,885 21% AA+ 13 9 HP IT services United States 26,756 AA+ 84,186 32% 27,383 100,998 27% AAA- Miscellaneous 39 35 Siemens Germany 16,769 AA+ 103,770 16% 14,709 102,939 14% AA+ Manufacture 14 10 Toyota Auto Manufacturers Japan 26,152 AA+ 204,864 13% 27,319 185,402 15% AAA 40 51 Ford Auto Manufacturers United States 16,662 AA+ 108,342 15% 12,652 97,539 13% AA 15 13 Santander Banks Spain 26,150 AAA 100,281 26% 25,576 128,087 20% AAA+ 41 116 Itaú Banks Brazil 16,655 AA 98,923 17% 6,911 58,588 12% AAA- 16 3 Coca-Cola Beverages United States 25,807 AAA+ 69,508 37% 34,844 87,814 40% AAA+ 42 37 BNP Paribas Banks France 16,643 AAA- 64,882 26% 14,060 67,144 21% AA Retail-Restaurants/ 17 18 McDonalds United States 21,842 AAA 89,595 24% 20,192 77,140 26% AAA- Pubs 43 46 Honda Auto Manufacturers Japan 16,355 AAA- 90,658 18% 13,083 82,377 16% AA+ Consumer 18 23 Samsung South Korea 21,511 AA+ 113,327 19% 18,925 86,384 22% AA+ Electronics 44 62 Chevron Oil&Gas United States 16,265 AA 169,618 10% 11,464 159,998 7% AA 19 17 Tesco Retail-Food Britain 21,129 AAA 69,868 30% 20,654 73,969 28% AAA- Retail-Department 45 34 Target United States 15,989 AA 52,694 30% 15,224 51,678 29% AA Mercedes- Stores 20 39 Auto Manufacturers Germany 20,798 AA 114,328 18% 13,883 78,057 18% A+ Benz American Diversified Finan 46 50 United States 15,529 AA 45,505 34% 12,737 42,043 30% AA Distribution/ Express Serv 21 26 Mitsubishi Japan 20,473 AA 195,041 10% 17,805 231,268 8% AA+ Wholesale 47 19 Walt Disney Media United States 15,424 AAA+ 52,049 30% 13,435 44,984 30% AAA The Home Retail-Department 22 22 United States 20,423 AA- 60,527 34% 19,013 51,076 37% AA- Depot Stores Deutsche 48 73 Banks Germany 15,169 AA+ 52,442 29% 9,862 43,273 23% AA- Bank 23 29 BMW Auto Manufacturers Germany 20,157 AA+ 92,873 22% 16,616 91,170 18% AAA- 49 30 AXA Insurance France 15,099 AA- 41,269 37% 16,403 44,326 37% AA- 24 31 Pepsi-Cola Beverages United States 19,514 AA+ 79,149 25% 15,991 44,866 36% AA+ 50 65 TATA Iron/Steel India 15,087 AAA- 103,721 15% 11,216 63,869 18% AAA- 25 24 China Mobile Cellular Telecoms Hong Kong 19,317 AA 170,543 11% 18,673 153,077 12% AA+ All values in USD $ Millions All values in USD $ Millions 67 © Brand Finance plc 2011 © Brand Finance plc 2011 68
  • 36.
    BrandFinance ® Global 500 2011 Brand Brand Brand Brand Brand Brand Value / Brand Value / Brand Brand Brand Value / Brand Value / Brand Rank Rank Enterprise Enterprise Rank Rank Enterprise Enterprise Brand Industry Domicile Value Rating Enterprise Value Enterprise Rating Brand Industry Domicile Value Rating Enterprise Value Enterprise Rating 2011 2010 Value Value 2010 2011 2010 Value Value 2010 2011 2011 Value 2010 Value 2010 2011 2011 Value 2010 Value 2010 (%) 2010 (%) (%) 2010 (%) 51 77 Movistar Cellular Telecoms Spain 14,935 AA 142,731 10% 9,666 203,347 5% AA+ Cosmetics/Personal 76 Olay United States 11,066 AA 35,777 31% Care 52 IKEA Retail Sweden 14,676 A- n/a 77 75 Dell IT services United States 10,983 AAA- 18,953 58% 9,750 18,280 53% AAA- 53 49 Oracle Software United States 14,602 AA 134,787 11% 12,775 105,194 12% AA+ 78 48 Allianz Insurance Germany 10,898 AA 50,937 21% 12,836 57,334 22% AA Electrical 54 82 Hitachi Japan 14,503 BBB 50,569 29% 9,095 21,091 43% A+ 79 67 Compo&Equip Bbva Banks Spain 10,720 AA 51,233 21% 10,727 69,134 16% AA- 55 76 ExxonMobil Oil&Gas United States 13,756 AA+ 311,832 4% 9,683 329,543 3% AA Retail-Department 80 81 ASDA United States 10,689 AA- 23,005 46% 9,122 30,849 30% AA Stores 56 68 Nissan Auto Manufacturers Japan 13,705 AAA- 69,638 20% 10,412 65,678 16% AA 81 88 Fedex Transportation United States 10,686 AA 27,779 38% 8,588 26,679 32% AA- 57 91 Credit Suisse Banks Switzerland 13,497 AAA- 46,645 29% 8,430 50,468 17% AA 82 160 Unitedhealth Healthcare-Services United States 10,606 AA+ 35,660 30% 5,297 17,526 30% AA Goldman Miscellaneous 58 38 Banks United States 13,406 AAA- 81,679 16% 13,887 93,316 15% AAA+ 83 122 3M United States 10,532 AA+ 64,471 16% 6,551 57,572 11% AA Sachs Manufactur 59 78 Bank of China Banks China 13,257 AA+ 131,499 10% 9,615 149,395 6% AA 84 103 E.ON Electric Germany 10,513 A+ 105,505 10% 7,590 68,253 11% AA- 60 57 JP Morgan Banks United States 13,241 AA- 66,615 20% 11,732 102,425 11% AA- 85 64 NTT Telecoms Services Japan 10,338 AA 60,334 17% 11,247 79,787 14% AA+ 61 52 Sony Home Furnishings Japan 13,194 AAA- 28,994 46% 12,648 30,684 41% AAA Cosmetics/Personal 86 71 Avon United States 10,171 AA+ 15,843 64% 9,917 16,134 61% AA- Care 62 47 GDF Suez Electric France 12,902 AA 132,442 10% 12,878 146,131 9% A+ Commercial 87 89 KPMG Netherlands 10,160 AAA- n/a 8,507 AAA- Services VW 63 61 Auto Manufacturers Germany 12,705 A+ 82,447 15% 11,468 82,209 14% AA+ (Volkswagen) 88 95 UBS Banks Switzerland 9,915 AA 67,481 15% 8,261 62,240 13% AA- 64 158 Panasonic Home Furnishings Japan 12,525 AA 44,793 28% 5,438 18,358 30% AA Retail-Clothing & 89 94 H&M Sweden 9,875 AA 55,629 18% 8,298 45,608 18% AAA- Footwear 65 58 Sberbank Banks Russia 12,012 AA+ 64,329 19% 11,729 51,108 23% AA+ 90 NTT Docomo Fixed Line Japan 9,801 AA+ 73,144 13% 8,187 64,997 13% Retail-Department 66 80 Sam's Club United States 11,952 AA- 30,649 39% 9,398 29,302 32% A+ Stores 91 107 DHL Transportation Germany 9,778 AA- 21,628 45% 7,304 20,213 36% AA- Retail-Department Retail-Department 67 79 Carrefour Stores/ Mixed France 11,894 AA 37,959 31% 9,436 35,252 27% AA+ 92 74 Lowe's United States 9,751 AA- 35,502 27% 9,784 35,653 27% AA- Stores Goods variety stores 68 56 Comcast Media United States 11,876 AA+ 73,693 16% 11,979 65,750 18% AA+ 93 99 EDF Utilities France 9,697 AA 128,306 8% 7,922 139,646 6% AA+ 69 109 Total Oil&Gas France 11,828 A+ 147,473 8% 7,218 165,876 4% AA- 94 21 Nokia Peripherals Finland 9,658 AA 26,908 36% 19,558 48,467 40% AAA- Banco do 70 70 Walgreens Retail-Drug Store United States 11,707 AA- 33,395 35% 9,983 28,634 35% AA- 95 118 Banks Brazil 9,526 AA+ 49,565 19% 6,662 43,135 15% AA+ Brasil 71 60 Cisco Telecoms Services United States 11,667 AA- 90,446 13% 11,480 110,003 10% AA+ 96 84 Generali Insurance Italy 9,487 AA 23,730 40% 11,588 40,360 29% AA Office/Business 72 69 T-Mobile Cellular Telecoms Germany 11,553 AA 75,976 15% 10,126 140,070 7% AA 97 126 Canon Japan 9,372 AAA- 55,438 17% 6,421 47,061 14% AA+ Equip Commercial 98 101 73 72 PwC United States 11,445 AAA+ n/a 9,908 AAA CVS Retail-Drug Store United States 9,286 AA- 23,379 40% 7,881 25,744 31% AA- Services Agricultural 74 83 Toshiba Electronics Japan 11,136 AA- 23,199 48% 8,949 23,257 38% AA 99 Banks China 9,283 A+ 134,233 7% 6,032 A+ Bank of China 75 63 Heineken Beverages Netherlands 11,108 AAA- 25,314 44% 11,435 29,490 39% AAA- 100 112 Boeing Aerospace/Defense United States 9,213 AA 54,226 17% 7,058 42,824 16% AA All values in USD $ Millions All values in USD $ Millions 69 © Brand Finance plc 2011 © Brand Finance plc 2011 70
  • 37.
    BrandFinance ® Global 500 2011 Brand Brand Brand Brand Brand Brand Value / Brand Value / Brand Brand Brand Value / Brand Value / Brand Rank Rank Enterprise Enterprise Rank Rank Enterprise Enterprise Brand Industry Domicile Value Rating Enterprise Value Enterprise Rating Brand Industry Domicile Value Rating Enterprise Value Enterprise Rating 2011 2010 Value Value 2010 2011 2010 Value Value 2010 2011 2011 Value 2010 Value 2010 2011 2011 Value 2010 Value 2010 (%) 2010 (%) (%) 2010 (%) China Life Standard 126 106 Banks Britain 7,419 AAA- n/a n/a 7,332 51,466 14% AAA- 101 222 Insurance Insurance China 9,212 AA- 209,407 4% 3,714 131,323 3% AA Chartered Company 127 119 TEPCO Electric Japan 7,365 AA 115,171 6% 6,653 59,053 11% AA- 102 87 BT Telecoms Services Britain 9,061 AA+ 31,987 28% 8,685 36,240 24% AA 128 127 MUFJ Banks Japan 7,336 A+ 66,317 11% 6,393 56,607 11% A+ 103 93 Philips Electronics Netherlands 9,033 AAA 31,807 28% 8,321 27,095 31% AA+ 129 115 China Telecom Telecoms Services China 7,261 AA- 53,470 14% 7,027 46,824 15% AA+ 104 53 BP Oil&Gas Britain 8,754 BB 131,470 7% 12,114 178,840 7% AA+ 130 202 Sinopec Oil&Gas China 7,135 BBB 139,983 5% 4,152 175,678 2% A- 105 113 ING Insurance Netherlands 8,703 AA 40,835 21% 7,051 27,610 26% AA Royal Bank of 131 165 Banks Canada 7,069 AA+ 76,612 9% 5,170 71,697 7% AA 106 148 Petrobras Oil&Gas Brazil 8,697 AA+ 262,224 3% 5,592 245,460 2% A+ Canada Johnson & 132 86 Healthcare-Products United States 7,037 AA 63,663 11% 8,715 85,322 10% AA+ 107 90 Time Warner Media United States 8,571 AA+ 40,612 21% 8,469 32,817 26% AA+ Johnson 133 108 Reliance Oil&Gas India 6,994 A+ 86,811 8% 7,250 87,758 8% AA- 108 171 DIRECTV Media United States 8,548 AA+ 40,765 21% 5,065 17,230 29% AA Morgan Mclane 134 100 Banks United States 6,857 AA- 35,022 20% 7,907 45,931 17% A+ 109 Retail Wholesale United States 8,528 AA 57,368 15% Stanley Company Commercial 110 85 Telecom Italia Telecoms Services Italy 8,315 AA+ 58,992 14% 8,866 83,993 11% AA+ 135 124 Ernst & Young United States 6,848 AAA- n/a 6,480 AAA- Services 111 183 Iberdrola Electric Spain 8,221 AA+ 53,769 15% 4,575 66,322 7% AA+ 136 168 Yahoo! Internet United States 6,804 AA- 36,911 18% 5,116 17,178 30% AA Société 137 481 NTT Data Computers Japan 6,788 AA 142,139 5% 1,967 10,511 19% AA 112 59 Banks France 8,153 AA- 30,080 27% 8,635 33,303 26% AA- Générale 138 128 Enel Electric Italy 6,758 AA 114,972 6% 6,380 122,657 5% AA 113 104 SAP Software Germany 8,037 AAA- 60,809 13% 7,584 58,380 13% AAA- 139 144 Adidas Apparel Germany 6,754 AAA- 10,631 64% 5,702 11,232 51% AAA- 114 175 PetroChina Oil&Gas China 8,031 AA 217,182 4% 4,879 257,844 2% AA- 140 130 FOX Media United States 6,746 AA 23,757 28% 6,277 21,185 30% AA 115 166 eBay Internet United States 8,002 AAA 17,711 45% 5,148 18,756 27% AAA- Machinery- 141 192 Peugeot Auto Manufacturers France 6,625 AA- 19,514 34% 4,485 23,769 19% AA 116 135 Caterpillar United States 7,911 AA+ 76,633 10% 6,189 64,826 10% AAA- Constr&Mining Commercial 142 92 UniCredit Banks Italy 6,621 AA- 24,315 27% 5,325 28,524 19% A+ 117 105 Deloitte United States 7,841 AAA n/a 7,374 AA Services Toronto- 118 114 Renault Auto Manufacturers France 7,801 AA 40,284 19% 7,042 42,880 16% AA 143 164 Dominion Banks Canada 6,604 AA- 63,962 10% 5,179 50,040 10% AA+ Bank Cosmetics/Personal 119 Gillette United States 7,784 AAA- 20,237 38% 144 129 Sainsbury Retail-Food Britain 6,595 A+ 13,818 48% 6,346 12,754 50% A+ Care Commercial Cosmetics/Personal 120 McKinsey United States 7,728 AAA- 18,000 43% 145 251 Nivea Germany 6,569 AA+ 10,178 65% 3,424 7,982 43% AA Services Care Cosmetics/Personal 146 137 O2 Cellular Telecoms Spain 6,558 AAA- 44,407 15% 6,117 203,347 3% AA+ 121 32 L'Oréal France 7,630 AAA- 23,935 32% 5,809 24,205 24% AAA- Care Commercial 122 98 Kellogg's Food United States 7,507 AAA+ 23,521 32% 7,982 24,725 32% AAA+ 147 173 Visa United States 6,555 AAA- 48,779 13% 5,037 55,159 9% AAA- Services 123 111 Zurich Insurance Switzerland 7,463 AA 30,600 24% 7,160 29,948 24% AA Retail-Consumer 148 140 Best Buy United States 6,534 A+ 14,187 46% 6,000 16,228 37% A+ Electronics 124 139 Woolworths Food Australia 7,443 AA 31,092 24% 6,003 25,805 23% AA 149 Saint Gobain Building Materials France 6,507 AA 36,143 18% 125 146 Rabobank Banks Netherlands 7,423 AA- n/a n/a 5,627 AA+ 150 123 Danone Food France 6,458 AAA- 25,788 25% 6,544 35,464 18% AAA- All values in USD $ Millions All values in USD $ Millions 71 © Brand Finance plc 2011 © Brand Finance plc 2011 72
  • 38.
    BrandFinance ® Global 500 2011 Brand Brand Brand Brand Brand Brand Value / Brand Value / Brand Brand Brand Value / Brand Value / Brand Rank Rank Enterprise Enterprise Rank Rank Enterprise Enterprise Brand Industry Domicile Value Rating Enterprise Value Enterprise Rating Brand Industry Domicile Value Rating Enterprise Value Enterprise Rating 2011 2010 Value Value 2010 2011 2010 Value Value 2010 2011 2011 Value 2010 Value 2010 2011 2011 Value 2010 Value 2010 (%) 2010 (%) (%) 2010 (%) 151 169 ConocoPhillips Oil&Gas United States 6,392 AA- 111,423 6% 5,085 107,215 5% A+ 176 250 Eni Oil&Gas Italy 5,571 AA 85,268 7% 3,440 94,872 4% AA Retail-Department 177 167 NEC Electronics Japan 5,553 A+ 13,002 43% 5,129 12,628 41% AA- 152 201 Aeon Japan 6,368 AA- 14,599 44% 4,153 12,654 33% AA- Stores Distribution/ 153 Neutrogena Healthcare-Products United States 6,350 AAA 14,467 44% 178 Mitsui Japan 5,551 AA 56,337 10% Wholesale 154 143 China Unicom Telecoms Services China 6,315 A+ 44,435 14% 5,704 36,222 16% A+ 179 177 Sharp Home Furnishings Japan 5,517 AA- 17,967 31% 4,805 18,279 26% AA 155 156 Vinci France 6,208 AA+ 45,100 14% 5,449 42,609 13% AA Sumitomo Mitsui 180 246 Banks Japan 5,512 A+ 37,945 15% 3,462 33,857 10% A Financial 156 141 Aviva Insurance Britain 6,175 AA 15,377 40% 5,882 17,105 34% A+ Group 157 154 Accenture IT services Ireland 6,169 A+ 27,774 22% 5,501 26,262 21% A+ 181 Marlboro Tobacco United States 5,510 AA+ 65,733 8% Thomson 182 110 Ericsson Telecoms Services Sweden 5,504 AA- 23,530 23% 5,697 19,275 30% AA 158 315 Media United States 6,164 AA 37,663 16% 2,880 13,935 21% AA Reuters 159 210 BHP Billiton Mining Britain 6,111 AA- 432,338 1% 4,034 203,610 2% AA 183 273 Bank Of Banks China 5,476 AA- 56,876 10% 3,269 64,383 5% AA Retail-Restaurants/ 160 150 Morrison Food Britain 6,101 AA 14,036 43% 5,581 13,716 41% AA 184 163 Starbucks United States 5,462 AA 15,446 35% 5,187 14,861 35% AA- Pubs Commercial 161 178 Metro Retail Wholesale Germany 6,098 A+ 15,418 40% 4,776 16,120 30% AA- 185 286 Randstad Netherlands 5,451 AA+ 9,775 56% 3,163 9,171 34% A+ Services 162 136 T-Home Telecoms Services Germany 6,085 AA- 36,722 17% 6,121 140,070 4% AA- 186 172 Kroger Food United States 5,442 AA- 9,545 57% 5,049 8,818 57% AA- Retail-Department 163 131 Costco United States 6,067 AA- 25,946 23% 6,259 24,782 25% AA- 187 220 U.S. Bank Banks United States 5,416 AA 42,868 13% 3,777 45,984 8% AA Stores Retail-Department 188 231 Petronas Oil&Gas Malaysia 5,352 AAA- n/a 3,578 48,553 7% AAA 164 189 Macy's United States 6,027 AA- 15,341 39% 4,533 13,572 33% AA- Stores Miscellaneous Holding Companies- 165 195 Honeywell United States 6,006 AA- 39,112 15% 4,351 35,077 12% AA- 189 230 Jardines Hong Kong 5,162 AA- 24,387 21% 3,594 17,146 21% AA- Manufactur Divers Schneider Electrical 190 Union Pacific Transportation United States 5,125 AA 50,157 10% 166 France 5,870 AA+ 41,030 14% Electric Compo&Equip 191 Oi Cellular Telecoms Brazil 5,046 AA+ 25,515 20% 4,342 24,913 17% AA 167 277 Sky Media Britain 5,782 AAA- 21,851 26% 3,231 AA Distribution/ Electrical 192 Itochu Japan 5,045 AA 40,060 13% 168 203 LG South Korea 5,767 A+ 30,720 19% 4,149 11,867 35% AA+ Wholesale Compo&Equip China State 193 247 China 5,018 A 21,765 23% 3,459 19,143 18% AA- 169 191 Nordea Banks Sweden 5,741 AA+ 43,856 13% 4,509 43,057 10% AA Construction Cosmetics/Personal 194 260 PNC Banks United States 4,993 AA 27,899 18% 3,383 23,236 15% AA- 170 Lancôme France 5,685 AA+ 12,300 46% Care Miscellaneous State Bank of 195 405 Bombardier Canada 4,980 A+ 11,382 44% 2,318 9,342 25% A+ 171 187 Banks India 5,670 AAA- 46,417 12% 4,551 29,809 15% AA+ Manufactur India 196 Heinz Food United States 4,952 AA- 19,375 26% 172 155 Fujitsu IT services Japan 5,634 AA- 17,743 32% 5,497 16,372 34% AA 197 134 RWE Utilities Germany 4,928 A+ 38,922 13% 6,194 59,716 10% AA 173 188 Softbank Telecoms Services Japan 5,587 AA- 62,877 9% 4,539 54,353 8% AA- The co- 198 198 Nescafé Beverages Switzerland 4,927 AA 23,201 21% 4,297 19,109 22% AA- 174 Food Britain 5,587 AA- n/a 4,660 A+ operative NBC 199 Media United States 4,923 A 52,785 9% 175 133 Motorola Telecoms Services United States 5,585 AA 15,359 36% 6,254 16,098 39% AA- International 200 179 MTN Telecoms Services South Africa 4,920 AAA 34,810 14% 4,693 30,230 16% AA All values in USD $ Millions All values in USD $ Millions 73 © Brand Finance plc 2011 © Brand Finance plc 2011 74
  • 39.
    BrandFinance ® Global 500 2011 Brand Brand Brand Brand Brand Brand Value / Brand Value / Brand Brand Brand Value / Brand Value / Brand Rank Rank Enterprise Enterprise Rank Rank Enterprise Enterprise Brand Industry Domicile Value Rating Enterprise Value Enterprise Rating Brand Industry Domicile Value Rating Enterprise Value Enterprise Rating 2011 2010 Value Value 2010 2011 2010 Value Value 2010 2011 2011 Value 2010 Value 2010 2011 2011 Value 2010 Value 2010 (%) 2010 (%) (%) 2010 (%) Household 226 184 Sysco Food United States 4,447 A+ 14,721 30% 4,570 13,853 33% AA- 201 209 Kimberly-Clark United States 4,833 AA+ 20,129 24% 4,045 20,302 20% AA+ Products/Wares Consumer Distribution/ 202 248 EMC2 United States 4,828 AA 33,748 14% 3,447 28,558 12% AA 227 Marubeni Japan 4,433 AA- 33,882 13% Electronics Wholesale Publix Super Retail - Food 228 240 Basf Chemicals Germany 4,393 AA+ 80,409 5% 3,497 15,345 23% AA 203 186 United States 4,796 A n/a n/a 4,556 AA- Markets Specialists 229 176 ArcelorMittal Iron/Steel Luxembourg 4,388 AA- 78,440 6% 4,848 87,521 6% AA- 204 Prudential Insurance Britain 4,780 A+ 23,851 20% 4,130 20,385 20% A+ 230 213 Hyundai Auto Manufacturers South Korea 4,376 AA+ 27,836 16% 3,905 13,441 29% AA- 205 182 CBS Media United States 4,744 A+ 16,553 29% 4,582 14,350 32% AA- Cosmetics/Personal 206 197 231 Colgate United States 4,373 A+ 16,215 27% Telstra Telecoms Services Australia 4,741 AA 40,226 12% 4,308 52,335 8% AA- Care Electrical 207 159 Safeway Retail-Food United States 4,720 AA- 10,328 46% 5,318 11,305 47% A+ 232 303 Emerson United States 4,366 AA 43,840 10% 2,956 34,161 9% AA+ Compo&Equip 208 142 Xbox Software United States 4,715 AAA- 16,390 29% 5,744 30,551 19% AA+ 233 204 BlackBerry Computers Canada 4,362 AAA- 19,898 22% 4,122 25,859 16% AAA 209 145 Gazprom Oil&Gas Russia 4,675 AA+ 174,148 3% 5,694 188,582 3% AA+ 234 Indian Oil Oil&Gas India 4,351 AA- 30,155 14% 4,074 21,429 19% A+ 210 437 Kraft Food United States 4,644 AA 22,857 20% 2,168 6,277 35% AA 235 375 Mizuho Banks Japan 4,349 A+ 33,214 13% 2,508 28,205 9% A+ 211 227 Swiss Re Insurance Switzerland 4,610 A+ 17,775 26% 3,630 15,498 23% A+ 236 282 Suzuki Auto Manufacturers Japan 4,320 AA 11,546 37% 3,211 12,689 25% AA Retail-Department 237 Chevrolet Auto Manufacturers United States 4,314 AA- 15,481 28% 212 349 Kohls United States 4,557 AA- 16,032 28% 2,623 6,711 39% AA- Stores 213 219 Medtronic Healthcare-Products United States 4,537 AA+ 42,863 11% 3,784 52,927 7% AA 238 Budweiser Beverages Belgium 4,304 AA+ 15,736 27% 214 Loblaws Food Canada 4,536 AA- 9,850 46% 239 174 DZ Bank Banks Germany 4,303 AA- n/a n/a 4,953 A 215 430 Warner Bros. Media United States 4,521 AA- 20,039 23% 2,217 10,939 20% AA- 240 278 Erste Banks Austria 4,293 AA 16,084 27% 3,229 13,405 24% AA- Retail-Department 241 426 Vivo Cellular Telecoms Brazil 4,286 AA- 31,399 14% 2,240 15,387 15% AA- 216 199 M&S Britain 4,519 AA 13,697 33% 4,285 14,237 30% AA+ Stores Toiletries/Personal 242 233 Veolia Water France 4,268 A+ 29,172 15% 3,559 30,962 11% AA 217 Dove Britain 4,517 AA 8,715 52% 1,889 6,175 31% AA Care Distribution/ 243 Sumitomo Japan 4,260 AA 55,078 8% 218 229 Metlife Insurance United States 4,510 AA- 35,252 13% 3,599 27,989 13% AA- Wholesale Retail-Clothing & 244 216 Swisscom Telecommunications Switzerland 4,255 AA 30,565 14% 3,829 30,021 13% AA- 219 212 Zara Spain 4,505 A+ 31,185 14% 3,963 25,536 16% AA- Footwear Retail-Office Electrical 245 208 Staples United States 4,250 AA- 10,345 41% 4,066 11,742 35% AA- 220 256 Sanyo Japan 4,501 AA- 13,440 33% 3,402 12,182 28% AA- Supplies Compo&Equip 246 205 Beeline Telecommunications Russia 4,189 AA+ 23,250 18% 4,116 25,255 16% AA- 221 121 Munich Re Insurance Germany 4,487 AA- 15,924 28% 4,300 18,656 23% AA- National 247 207 Banks Australia 4,176 AA- 35,214 12% 4,073 37,072 11% A+ 222 au Cellular Telecoms Japan 4,479 A+ 27,613 16% Australia Bank Texas Consumer 248 382 BNY Mellon Banks United States 4,156 AA- 32,124 13% 2,477 33,306 7% A+ 223 275 United States 4,461 AA- 31,645 14% 3,260 28,858 11% AA- Instruments Electronics Media Markt & Retail-Consumer 249 266 Germany 4,134 AA- 8,833 47% 3,327 9,235 36% A+ 224 308 Citroën Auto Manufacturers France 4,456 AA- 16,688 27% 2,937 16,890 17% AA- Saturn Electronics 250 360 Scotiabank Banks Canada 4,120 AA- 52,473 8% 2,579 42,689 6% A 225 194 Fiat Auto Manufacturers Italy 4,447 A+ 15,173 29% 4,439 16,564 27% AA- All values in USD $ Millions All values in USD $ Millions 75 © Brand Finance plc 2011 © Brand Finance plc 2011 76
  • 40.
    BrandFinance ® Global 500 2011 Brand Brand Brand Brand Brand Brand Value / Brand Value / Brand Brand Brand Value / Brand Value / Brand Rank Rank Enterprise Enterprise Rank Rank Enterprise Enterprise Brand Industry Domicile Value Rating Enterprise Value Enterprise Rating Brand Industry Domicile Value Rating Enterprise Value Enterprise Rating 2011 2010 Value Value 2010 2011 2010 Value Value 2010 2011 2011 Value 2010 Value 2010 2011 2011 Value 2010 Value 2010 (%) 2010 (%) (%) 2010 (%) 251 SFR Media France 4,101 AA+ 24,870 16% 276 259 STATOIL Oil&Gas Norway 3,758 A+ 72,716 5% 3,387 90,928 4% A+ 252 Purina Nutrition Switzerland 4,099 A 28,416 14% Singapore 277 225 Airlines Singapore 3,757 AAA- 12,158 31% 3,654 10,281 36% AAA Airline 253 353 Airbus Aerospace/Defense Netherlands 4,080 AA 9,862 41% 2,605 5,205 50% A+ 278 488 Vale Mining Brazil 3,749 A+ 185,138 2% 1,937 153,418 1% A CNP 254 161 Insurance France 4,058 A+ 11,443 35% 5,272 15,973 33% AA- 279 257 Audi Auto Manufacturers Germany 3,739 AA- 23,614 16% 3,398 AA- Assurances 255 Coles Retail-Food Australia 4,056 AA 23,272 17% 280 181 Crédit Agricole Banks France 3,706 AA- 13,251 28% 4,617 21,076 22% A+ 256 385 Allstate Insurance United States 4,045 AA- 17,450 23% 2,455 13,717 18% AA- 281 Bell Telecom Services Canada 3,702 AA 31,137 12% 3,364 31,922 11% AA- 257 BAE Systems Aerospace/Defense Britain 4,042 AA- 20,665 20% 282 193 EDP Electric Portugal 3,692 AA- 36,319 10% 4,449 41,608 11% AA 258 BBC Media Britain 4,019 AAA- n/a 3,648 AA+ 283 Facebook Internet United States 3,690 A n/a Holding Companies- 284 Bharti Airtel Telecoms Services India 3,686 AA- 28,861 13% 3,159 27,737 11% AA 259 270 Louis Vuitton France 3,996 AAA 10,377 39% 3,293 8,029 41% AAA Divers 260 SPC Oil&Gas China 3,990 AA- 93,078 4% 285 288 KEPCO Electric South Korea 3,683 AA- 38,097 10% 3,160 36,351 9% A+ Nokia Siemens 261 224 ABB Switzerland 3,950 AA 44,890 9% 3,690 38,454 10% A+ 286 Telecoms Services Finland 3,664 AA 11,148 33% Network Fresenius 287 373 Carlsberg Beverages Denmark 3,646 AA+ 9,561 38% 2,525 7,991 32% AA 262 294 Healthcare-Services Germany 3,949 AA 24,162 16% 3,027 21,830 14% AA Medical Care 263 312 Deutsche Post Transportation Germany 3,949 A 5,407 73% 2,892 7,124 41% AA- 288 402 Rogers Telecoms Services Canada 3,643 AA+ 30,564 12% 2,344 24,929 9% AA Commercial 289 314 Aetna Healthcare-Services United States 3,632 AA 13,046 28% 2,885 12,412 23% AA- 264 Mastercard United States 3,931 AA+ 25,753 15% 3,186 28,521 11% AA+ Services Bank of Toys/Games/ 265 120 Nintendo Japan 3,928 AA+ 11,056 36% 6,585 23,536 28% AAA- 290 America Banks United States 3,629 A 13,355 27% 2,694 18,193 15% A+ Hobbies Merrill Lynch 266 WPP Media Ireland 3,922 A+ 19,157 20% 291 Emirates Airlines Uae 3,622 AAA- n/a 3,518 12,131 29% AAA- 267 218 Telenor Telecoms Services Norway 3,918 AA- 21,036 19% 3,813 30,355 13% A+ 292 324 Rio Tinto Mining Britain 3,613 AA- 157,461 2% 2,838 160,719 2% A+ Retail-Department 268 410 7-Eleven Japan 3,905 AA 7,927 49% 2,302 8,731 26% A+ Retail-Department Stores 293 Champion Stores/ Mixed France 3,603 A 7,435 48% Mountain Dew Goods variety stores 269 Beverages United States 3,882 AA 19,854 20% / Mtn Dew 294 268 Kit Kat Food Switzerland 3,594 AA- 20,549 17% 3,307 22,117 15% AA- 270 211 Aegon Insurance Netherlands 3,874 AA- 10,736 36% 3,986 11,575 34% AA Miscellaneous 295 449 Fujifilm Japan 3,586 AA 16,989 21% 2,131 10,866 20% AA Manufactur 271 244 Banks Australia 3,858 AAA- 54,746 7% 3,475 59,573 6% AA+ 296 336 Capital One Banks United States 3,584 AA- 17,937 20% 2,758 17,885 15% A 272 237 Raytheon Aerospace/Defense United States 3,829 AA 17,084 22% 3,514 19,702 18% AA 297 414 CHUBU Electric Japan 3,579 AA 46,266 8% 2,285 24,048 10% AA 273 276 Ping An Insurance China 3,827 AA 71,399 5% 3,237 64,228 5% AA- 298 300 Endesa Electric Spain 3,569 AA+ 45,653 8% 2,986 57,413 5% AA- 274 243 Lufthansa Airlines Germany 3,801 AA+ 8,592 44% 3,477 8,980 39% AA- 299 British Gas Utilities Britain 3,560 A+ 17,784 20% 2,415 16,393 15% A+ BMO Financial 275 334 Banks Canada 3,797 A+ 32,990 12% 2,767 26,076 11% A+ Group 300 323 Sprint Telecommunications United States 3,535 AA 22,929 15% 2,843 27,160 10% AA- All values in USD $ Millions All values in USD $ Millions 77 © Brand Finance plc 2011 © Brand Finance plc 2011 78
  • 41.
    BrandFinance ® Global 500 2011 Brand Brand Brand Brand Brand Brand Value / Brand Value / Brand Brand Brand Value / Brand Value / Brand Rank Rank Enterprise Enterprise Rank Rank Enterprise Enterprise Brand Industry Domicile Value Rating Enterprise Value Enterprise Rating Brand Industry Domicile Value Rating Enterprise Value Enterprise Rating 2011 2010 Value Value 2010 2011 2010 Value Value 2010 2011 2011 Value 2010 Value 2010 2011 2011 Value 2010 Value 2010 (%) 2010 (%) (%) 2010 (%) 301 322 TNT Transportation Netherlands 3,534 AA 11,765 30% 2,847 12,709 22% AA- 326 422 CIBC Banks Canada 3,276 A+ 29,149 11% 2,255 22,201 10% A+ 302 264 QVC Internet United States 3,526 A 9,512 37% 3,332 8,471 39% AA- Cosmetics/Personal 327 Chanel France 3,272 AAA n/a n/a Care Auto 303 267 Bridgestone Japan 3,511 AA- 20,021 18% 3,325 20,762 16% AA 328 CAP GEMINI Computers France 3,271 AA 7,047 46% Parts&Equipment 304 280 Gatorade Food United States 3,505 AA- 20,094 17% 3,225 17,713 18% AA- 329 337 Amstel Beverages Netherlands 3,263 AA 8,438 39% 2,721 7,372 37% A+ 305 302 Alcatel-Lucent Telecoms Services France 3,461 A+ 8,992 38% 2,967 7,788 38% A 330 429 Maersk Transportation Denmark 3,250 AA+ 55,256 6% 2,222 53,288 4% A- 306 318 MTS Cellular Telecoms Russia 3,458 AA- 22,902 15% 2,869 18,054 16% AA- 331 PSEG Electric United States 3,250 A 25,998 13% 307 263 Claro Telecommunications Mexico 3,447 AA- 48,698 7% 3,334 84,020 4% A+ Nestlé Pure 332 258 Baby Food Switzerland 3,213 A 19,909 16% 3,397 17,143 20% A Life Auto China 308 279 Michelin France 3,437 AA- 17,902 19% 3,228 16,951 19% AA+ Parts&Equipment 333 432 Merchants Banks China 3,189 A+ 43,803 7% 2,212 49,803 4% AA- Bank 309 255 MOL Transportation Japan 3,415 AA 16,398 21% 3,402 15,399 22% AA- Toiletries/Personal 334 Lux Britain 3,177 AA- 4,405 72% Care 310 354 State Street Banks United States 3,411 AA- 19,407 18% 2,598 21,483 12% AA- Southern Commercial 335 Electric United States 3,170 AA+ 52,531 6% 311 301 Adecco Switzerland 3,404 AA- 10,450 33% 2,974 9,374 32% AA- Company Services 336 Sony Ericsson Communications Sweden 3,165 A+ 14,432 22% 3,697 24,415 15% A+ Johnson Auto 312 217 United States 3,393 AA- 24,098 14% 3,814 21,557 18% AA Controls Parts&Equipment Polo Ralph 337 305 Apparel United States 3,162 AA- 6,223 51% 2,952 5,269 56% AA- Lauren 313 417 Nippon Steel Iron/Steel Japan 3,391 AA 43,576 8% 2,269 46,406 5% AA Berkshire 338 Insurance United States 3,159 AA 204,886 2% 314 272 Westpac Banks Australia 3,384 AA 42,512 8% 3,280 54,116 6% AA+ Hathaway 339 296 Hermes Apparel France 3,151 AA+ 24,410 13% 3,003 14,777 20% AAA- 315 271 JR-East Transportation Japan 3,373 AA 24,162 14% 3,292 31,067 11% AA 340 330 MAPFRE Insurance Spain 3,148 A 9,387 34% 2,799 13,281 21% A- 316 DISH Network Media United States 3,366 AA- 12,604 27% 341 221 Asahi Beverages Japan 3,134 AA+ 7,816 40% 3,734 9,101 41% AAA- 317 325 RBS Banks Britain 3,346 A 41,406 8% 2,838 20,520 14% A- 342 Wellpoint Healthcare-Services United States 3,125 AA 11,847 26% 318 Playstation Gaming Japan 3,341 A 2,868 116% Machinery- 343 John Deere United States 3,122 AA+ 52,140 6% 319 357 Lloyds TSB Banks Britain 3,332 A 24,477 14% 2,595 11,567 22% A Diversified Toys/Games/ 344 Conagra Food United States 3,115 AA- 12,280 25% 320 Wii Japan 3,324 AA- 12,813 26% Hobbies 345 378 Wilmar Agriculture Singapore 3,101 AA 23,665 13% 2,498 21,953 11% AA- 321 310 Cigna Healthcare-Services United States 3,310 AA- 7,721 43% 2,918 7,356 40% AA- 346 Delta Airlines United States 3,100 AA 20,306 15% 322 MTV Networks Media United States 3,304 AA- 15,355 22% International Forest 347 OMV Oil&Gas Austria 3,096 A+ 18,202 17% 323 249 United States 3,304 AA 17,071 19% 3,441 19,231 18% AA+ Paper Products&Paper Bharat 348 306 Oil&Gas India 3,090 AA 8,922 35% 2,945 8,497 35% AA- 324 NYK Transportation Japan 3,303 AA 16,698 20% Petroleum 349 287 Lukoil Oil&Gas Russia 3,089 AA 55,497 6% 3,161 59,085 5% A+ 325 471 C.H. Robinson Transportation United States 3,277 AA- 11,609 28% 2,020 8,963 23% AA- Thermofisher 350 361 Electronics United States 3,080 AA 20,214 15% 2,579 19,563 13% AA Scientific All values in USD $ Millions All values in USD $ Millions 79 © Brand Finance plc 2011 © Brand Finance plc 2011 80
  • 42.
    BrandFinance ® Global 500 2011 Brand Brand Brand Brand Brand Brand Value / Brand Value / Brand Brand Brand Value / Brand Value / Brand Rank Rank Enterprise Enterprise Rank Rank Enterprise Enterprise Brand Industry Domicile Value Rating Enterprise Value Enterprise Rating Brand Industry Domicile Value Rating Enterprise Value Enterprise Rating 2011 2010 Value Value 2010 2011 2010 Value Value 2010 2011 2011 Value 2010 Value 2010 2011 2011 Value 2010 Value 2010 (%) 2010 (%) (%) 2010 (%) Weston 376 291 Telcel Cellular Telecoms Mexico 2,930 A 46,380 6% 3,069 84,020 4% A+ 351 Food Canada 3,075 AA 8,808 35% (George) 352 465 BB&T Banks United States 3,067 AA+ 16,679 18% 2,056 17,472 12% AA 377 420 Marathon Oil&Gas United States 2,928 AA- 30,893 9% 2,261 30,406 7% A+ Enbw Energie 353 236 Commerzbank Banks Germany 3,067 AA+ 7,579 40% 3,521 11,066 32% A+ 378 Electric Germany 2,917 A 18,558 16% Bad 354 241 Holcim Building Materials Switzerland 3,054 AAA- 36,944 8% 3,497 39,541 9% AAA- 379 321 T-Systems Telecoms Services Germany 2,916 AA- 13,833 21% 2,847 140,070 2% A+ 355 132 Pfizer Pharmaceuticals United States 3,037 AAA- 164,528 2% 6,257 106,931 6% AA+ 380 Bayer Chemicals Germany 2,912 AA- 75,755 4% Cosmetics/Personal Consumer 356 372 Estee Lauder United States 3,037 AA 5,095 60% 2,531 3,800 67% A+ 381 424 Infosys India 2,908 AA+ 37,963 8% 2,246 27,112 8% AA+ Care Electronics 357 445 Casino Retail Wholesale France 3,033 A 6,292 48% 2,153 6,711 32% A+ 382 Schwarzkopf Germany 2,904 A 4,632 63% 358 ESPN Media United States 3,031 AA 13,207 23% 383 328 Virgin Media Telecoms Services United States 2,901 AA- 16,249 18% 2,808 14,542 19% A+ Cosmetics/Personal 384 Geico Insurance United States 2,881 AA 24,586 12% 359 Biore Japan 3,014 AA- 5,575 54% Care Black & 360 245 ACS Spain 3,014 AA- 29,342 10% 3,468 30,156 12% AA 385 Hand/Machine Tools United States 2,870 AA+ 11,860 24% Decker 361 National Grid Electric Britain 3,012 AA 66,253 5% 386 HESS Oil&Gas United States 2,856 AA- 23,618 12% 362 352 Etisalat Cellular Telecoms Uae 3,002 AA- 19,564 15% 2,607 19,951 13% AA 387 ABC Media United States 2,851 AA 12,430 23% Miscellaneous Manulife 363 Tyco Switzerland 2,987 AA+ 20,915 14% 388 235 Insurance Canada 2,823 AA 21,577 13% 3,545 22,265 16% AA Manufactur Financial 364 331 ACER Computers Taiwan 2,982 AA- 7,182 42% 2,795 6,849 41% AA- 389 SunTrust Bank Banks United States 2,821 AA- 13,448 21% 1,724 9,539 18% A+ 365 316 ANZ Banks Australia 2,977 AA+ 50,999 6% 2,873 44,054 7% AA Auto 390 455 Continental Germany 2,821 A+ 13,461 21% 2,096 12,274 17% AA- Parts&Equipment Cosmetics/Personal Tropicana 366 450 Shiseido Japan 2,972 AA+ 4,818 62% 2,130 8,042 26% AA- 391 Beverages United States 2,815 AA 14,458 19% Care Beverages 367 HTC Peripherals Taiwan 2,970 A 16,530 18% 392 Banks Italy 2,813 A 11,493 24% 2,434 13,937 17% A 368 355 Sandvik Hand/Machine Tools Sweden 2,968 AA 20,247 15% 2,597 17,807 15% A+ 393 362 Prudential Insurance United States 2,805 A+ 24,961 11% 2,578 23,130 11% AA Scottish & 369 319 Electric Britain 2,958 A+ 25,391 12% 2,865 12,629 23% A- 394 JR-Central Transportation Japan 2,797 AA 52,336 5% South 370 295 Travelers Insurance United States 2,956 AA- 24,886 12% 3,025 28,625 11% AA+ 395 383 Qwest Fixed Line United States 2,794 AA- 22,418 12% 2,463 19,416 13% AA- 371 327 Danske Bank Banks Denmark 2,948 A+ 16,823 18% 2,835 17,014 17% A+ 396 343 POSCO Iron/Steel South Korea 2,788 AA 41,647 7% 2,659 43,429 6% AA+ 372 404 Rosneft (▼▼▼▼▼▼▼▼) Oil&Gas Russia 2,943 A+ 90,694 3% 2,324 107,249 2% A+ 397 418 Kia Auto Manufacturers South Korea 2,788 AA 15,240 18% 2,264 8,851 26% A+ 373 364 Camel Agriculture Japan 2,942 A 8,434 35% 2,574 7,120 36% A 398 274 Cadbury Confectionery United States 2,784 AA- 15,510 18% 3,261 21,196 15% AA- 374 Volvo Auto Manufacturers Sweden 2,941 A+ 17,415 17% 399 Aflac Insurance United States 2,783 AA- 25,594 11% 1,837 21,537 9% AA 375 345 Mazda Auto Manufacturers Japan 2,932 AA- 8,810 33% 2,652 9,804 27% AA- 400 307 CSC Computers United States 2,779 AA- 8,568 32% 2,943 10,323 29% A+ All values in USD $ Millions All values in USD $ Millions 81 © Brand Finance plc 2011 © Brand Finance plc 2011 82
  • 43.
    BrandFinance ® Global 500 2011 Brand Brand Brand Brand Brand Brand Value / Brand Value / Brand Brand Brand Value / Brand Value / Brand Rank Rank Enterprise Enterprise Rank Rank Enterprise Enterprise Brand Industry Domicile Value Rating Enterprise Value Enterprise Rating Brand Industry Domicile Value Rating Enterprise Value Enterprise Rating 2011 2010 Value Value 2010 2011 2010 Value Value 2010 2011 2011 Value 2010 Value 2010 2011 2011 Value 2010 Value 2010 (%) 2010 (%) (%) 2010 (%) 401 371 Pearson Media Britain 2,755 AA- 11,116 25% 2,535 9,607 26% AA- Retail-Clothing & 426 442 GAP United States 2,589 AA 3,686 70% 2,161 5,141 42% AA+ Footwear Empresas Holding Companies- 402 Chile 2,740 AA- 26,427 10% 427 Pharmaceuticals Britain 2,587 AAA- 121,856 2% Copec Divers 403 Pao de Açucar Food Brazil 2,723 A+ 10,840 25% Lay’s Potato 428 Food United States 2,577 A+ 21,564 12% Chips 404 Genting Lodging Malaysia 2,721 AAA- 15,638 17% 2,583 7,809 33% AAA- 429 461 Marriott Lodging United States 2,576 AA 8,671 30% 2,071 7,031 29% AA 405 347 Rolls-Royce Aerospace/Defense Britain 2,720 AA- 15,612 17% 2,643 12,230 22% AA- Raiffeisen 430 Bank Banks Austria 2,575 AA- 8,001 32% 1,851 9,729 19% A International 406 408 Schindler Hand/Machine Tools Switzerland 2,717 AA 11,538 24% 2,306 A+ 431 Ergo Insurance Germany 2,561 AA- 11,066 23% 407 Hersheys Food United States 2,715 AA- 12,203 22% Bed Bath & Retail-Home 432 396 United States 2,559 A 9,515 27% 2,388 8,735 27% AA- Beyond Furnishings 408 453 CSX Transportation United States 2,706 AA 29,087 9% 2,108 25,553 8% AA- Lockheed 433 397 Aerospace/Defense United States 2,555 AA 9,439 27% 2,382 10,676 22% AA Martin 409 FPCC Oil&Gas Taiwan 2,690 A 29,754 9% 434 460 CN Transportation Canada 2,553 AA+ 35,777 7% 2,071 30,803 7% AA+ Retail-Department 410 339 J.C Penney United States 2,683 A+ 8,832 30% 2,696 8,042 34% A+ Tyco Stores 435 Electronics Switzerland 2,540 AA 14,026 18% Electronics 411 304 Crédit Mutuel Banks France 2,677 AA- n/a n/a 2,955 A- 436 China South Airlines China 2,533 AA- 18,274 14% 1,792 15,371 12% AA 412 Norfolk Transportation United States 2,675 AA 27,838 10% 437 Optus Cellular Telecoms Australia 2,530 AA 28,412 9% 413 Lipton Beverages Britain 2,669 A 5,938 45% 438 7UP Beverages United States 2,526 AA 12,987 19% 414 431 ACE Insurance Switzerland 2,667 AA- 20,055 13% 2,216 16,387 14% A+ 439 Adobe Software United States 2,524 AA- 12,849 20% 415 441 Kyocera Electronics Japan 2,660 AA- 17,000 16% 2,162 11,111 19% AA 440 Eletrobras Electric Brazil 2,519 AA- 18,538 14% 416 416 SK telecom Telecoms Services South Korea 2,651 AA 15,866 17% 2,282 15,381 15% AA Commercial 441 459 Sodexo France 2,509 AA- 12,601 20% 2,078 11,158 19% A Services Diversified Finan 417 Nomura Japan 2,651 A+ 20,290 13% 1,767 25,132 7% A- Serv 442 Postbank Banks Germany 2,506 AA- 7,596 33% 1,475 7,535 20% A 418 Halifax Banks Britain 2,632 A- 18,439 14% 1,738 8,714 20% BB 443 Stop & Shop Retail-Food Netherlands 2,505 A 5,487 46% 419 332 Qualcomm Telecoms Services United States 2,632 AA- 62,606 4% 2,781 63,897 4% AA- 444 440 ICICI Bank Banks India 2,501 AA 28,809 9% 2,164 19,807 11% AA- Machinery- 420 Man Germany 2,631 AA 17,673 15% Diversified 445 Arcon Healthcare-Products Switzerland 2,496 AA 47,746 5% 421 SUEZ Water France 2,610 A+ 20,700 13% Cosmetics/Personal 446 Garnier France 2,493 AA 6,440 39% Care 422 317 Bouygues France 2,608 AA 12,714 21% 2,872 21,007 14% AA- Korea Gas 447 Gas South Korea 2,482 A 14,620 17% Corp 423 Magnit Retail-Food Russia 2,606 A 10,682 24% 448 CEPSA Oil&Gas Spain 2,479 A 7,635 32% 544 2,632 21% BBB Harley- 424 309 Leisure Time United States 2,592 AA 12,398 21% 2,928 10,477 28% AAA+ Davidson 449 COSCO Transportation China 2,468 AA- 19,213 13% 266 24,796 1% AA Diversified Finan 425 BlackRock United States 2,591 AA+ 32,739 8% 1,580 29,722 5% AA Serv 450 394 STC Telecoms Services Saudi Arabia 2,468 A+ 27,985 9% 2,393 32,607 7% A+ All values in USD $ Millions All values in USD $ Millions 83 © Brand Finance plc 2011 © Brand Finance plc 2011 84
  • 44.
    BrandFinance ® Global 500 2011 Brand Brand Brand Brand Brand Brand Value / Brand Value / Brand Brand Brand Value / Brand Value / Brand Rank Rank Enterprise Enterprise Rank Rank Enterprise Enterprise Brand Industry Domicile Value Rating Enterprise Value Enterprise Rating Brand Industry Domicile Value Rating Enterprise Value Enterprise Rating 2011 2010 Value Value 2010 2011 2010 Value Value 2010 2011 2011 Value 2010 Value 2010 2011 2011 Value 2010 Value 2010 (%) 2010 (%) (%) 2010 (%) 451 320 KBC Banks Belgium 2,466 A 16,617 15% 2,864 15,912 18% BBB Wipro 476 Computers India 2,352 A+ 24,738 10% 2,492 19,994 12% AA Technologies 452 Centurylink Telecoms Services United States 2,464 AA- 19,571 13% 1,545 18,399 8% AA- 477 Telia Cellular Telecoms Sweden 2,351 AAA- 15,313 15% 2,180 41,168 5% AA 453 486 KANSAI Electric Japan 2,453 AA- 57,507 4% 1,956 30,472 6% A+ 478 Turner Media United States 2,349 AA- 10,020 23% 454 398 CHS Healthcare-Services United States 2,452 AA- 11,828 21% 2,380 11,743 20% A+ 479 Luxottica Healthcare-Products Italy 2,347 AA 16,084 15% 455 492 Telus Telecoms Services Canada 2,451 AA 20,137 12% 1,930 14,974 13% A+ 480 China CITIC Banks China 2,342 A+ 29,348 8% 1,866 33,904 6% A+ 456 399 Winston Agriculture Japan 2,446 A 7,013 35% 2,378 5,888 40% A Kuehne & 481 419 Transportation Switzerland 2,330 AA 13,909 17% 2,262 11,179 20% AA+ Nagel 457 PICC Insurance China 2,441 A 15,649 16% 1,315 9,302 14% A 482 Progressive Insurance United States 2,329 AA- 14,087 17% 1,872 11,307 17% AA- 458 483 DnB NOR Banks Norway 2,433 AA 21,925 11% 1,964 16,537 12% A+ Electrical 483 Legrand France 2,325 AA- 11,013 21% Compo&Equip Retail-Department 459 Dia Stores/ Mixed France 2,421 A 5,380 45% 1,139 A+ 484 Aveeno Healthcare-Products United States 2,319 AA 10,459 22% Goods variety stores Auto 460 MURPHY Oil&Gas United States 2,416 AA- 12,283 20% 485 Denso Japan 2,310 A+ 22,710 10% Parts&Equipment Commercial 461 KT Telecoms Services South Korea 2,407 AA 16,417 15% 1,837 14,844 12% AA 486 482 ADP United States 2,308 AA 19,137 12% 1,967 20,352 10% AA Services 462 Banamex Banks United States 2,406 A+ 18,693 13% 1,356 13,760 10% A+ 487 413 Colruyt Food Belgium 2,300 A+ 8,683 26% 2,286 8,114 28% AA 463 358 Agip Oil&Gas Italy 2,405 AA- 24,715 10% 2,591 27,499 9% A+ 488 Dairy Farm Food Hong Kong 2,299 AA- 10,604 22% 464 152 AIG Insurance United States 2,390 A 13,177 18% 5,536 14,856 37% A+ 489 BD Healthcare-Products United States 2,295 AA 17,592 13% 465 Cathay Pacific Airlines Hong Kong 2,383 AA+ 11,518 21% 490 313 Zain Cellular Telecoms Kuwait 2,293 AA- 20,193 11% 2,889 24,170 12% AA- 466 311 Air France Airlines France 2,382 AA+ 8,926 27% 2,909 6,300 46% A+ Shoppers Drug 491 Retail Canada 2,291 A- n/a n/a Mart 467 338 Thales Aerospace/Defense France 2,377 AA- 8,277 29% 2,713 10,641 25% AA- 492 475 Puma Apparel Germany 2,291 AA+ 4,838 47% 1,990 4,544 44% AA 468 462 BYD Auto Manufacturers China 2,374 A+ 17,455 14% 2,065 22,786 9% AA Universal 493 261 Media France 2,286 AA- 8,701 26% 3,368 15,775 21% AA- Music Group Miscellaneous 469 Danaher United States 2,371 AA 28,447 8% Ameriprise Diversified Finan Manufactur 494 United States 2,283 AA 12,552 18% 1,498 9,208 16% A Financial Serv 470 433 JR-West Transportation Japan 2,367 AA- 19,081 12% 2,210 18,504 12% AA- 495 Isbank Banks Turkey 2,280 AA 19,221 12% 1,662 12,704 13% AA- Astra Retail-Automobiles/ 471 Indonesia 2,360 A 28,463 8% International Auto Parts 496 "K"Line Transportation Japan 2,279 AA- 7,846 29% 472 HBO Media United States 2,357 AA- 10,020 24% Cosmetics/Personal 497 Natura Brazil 2,274 AA- 12,722 18% Care 473 395 Ferrovial Sa Spain 2,355 AA 40,630 6% 2,393 42,019 6% AA- 498 Gucci High End Fashion France 2,272 AA 3,783 60% 474 456 Eiffage France 2,354 A+ 21,883 11% 2,086 23,555 9% AA- Machinery- 499 500 Komatsu Japan 2,270 AA+ 28,480 8% 1,898 25,475 7% AA Constr&Mining 475 479 United Airlines Airlines United States 2,352 AA- n/a n/a 1,972 4,996 39% A Electrical 500 Vestas Denmark 2,267 A+ 8,782 26% Compo&Equip All values in USD $ Millions All values in USD $ Millions 85 © Brand Finance plc 2011 © Brand Finance plc 2011 86
  • 45.
    The world’s leading independent brand valuation consultancy www.brandfinance.com