Download as PDF, PPTX

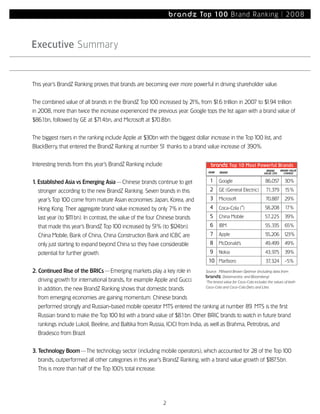
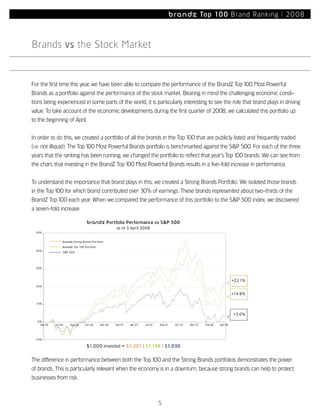
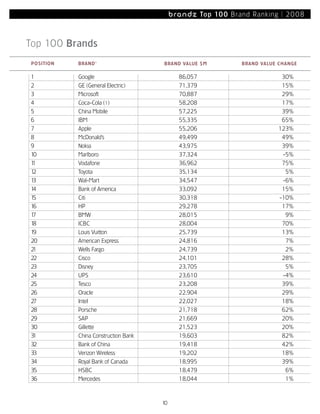
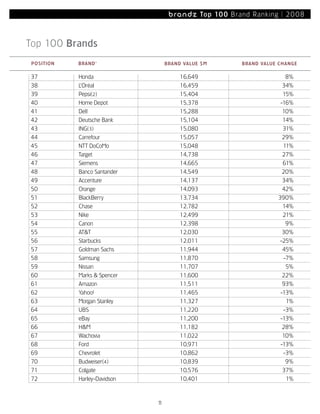
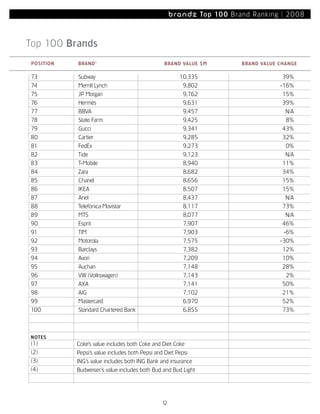
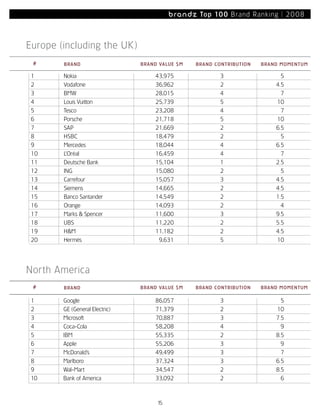
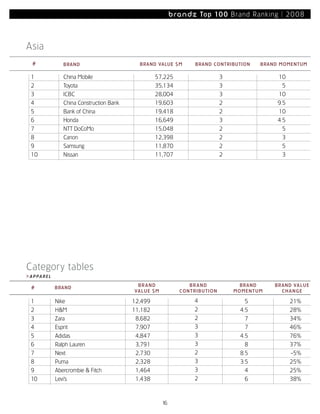
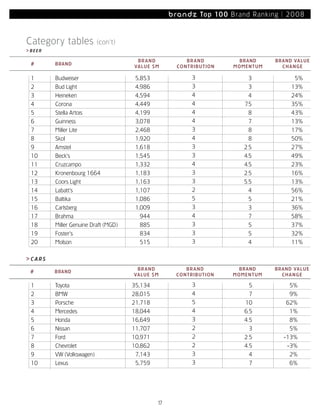
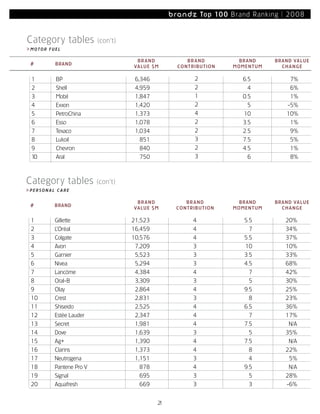
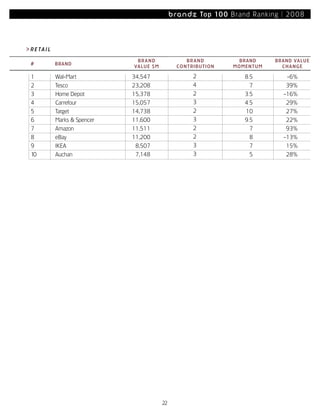
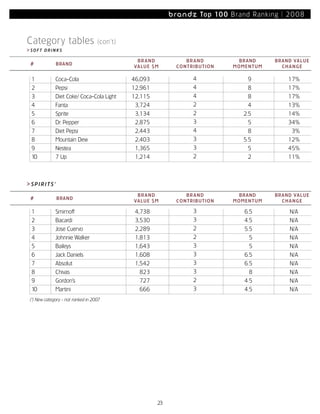
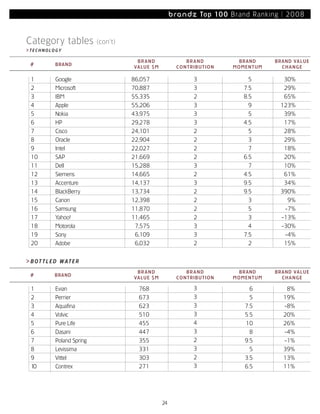
This document lists the top 100 most powerful brands in the world according to brand value. It shows that the total value of all brands in the ranking increased from $1 trillion in 2007 to $1.94 trillion in 2008, with technology brands experiencing the strongest growth. Google topped the list with a brand value of $86 billion, followed by GE and Microsoft. Other notable findings include the rise of Chinese brands and continued growth of brands from emerging markets.


![[Millward Brown] Brandz report 2014](https://cdn.slidesharecdn.com/ss_thumbnails/2014brandztop100report-140928232328-phpapp01-thumbnail.jpg?width=640&height=640&fit=bounds)


