Simulation study report of a bracket on SOLIDWORKS software. In this study we can see in a certain load how a bracket will behave. From this study we can see that in which load this bracket will be failed.
This document summarizes a static simulation analysis of a modified lug wrench conducted in SOLIDWORKS Simulation. The analysis modeled the wrench as a solid body made of alloy steel and applied 35 lbf forces to opposite faces. It generated a mesh of the model and reported on stresses, displacements, and strains in the wrench under the applied loads, with maximum Von Mises stress of 8510 psi and maximum displacement of 0.009808 in. The analysis concluded the static simulation of the modified lug wrench.
This document discusses continuous beams and the stiffness matrix of beams. It begins by defining the stiffness matrix of beams and demonstrating how it is obtained. It shows that the columns of the stiffness matrix represent equilibrium force states. It then gives examples of calculating the individual coefficients in the stiffness matrix columns for different displacement conditions. Finally, it presents some sample problems, showing how to assemble the overall structural stiffness matrix and solve for displacements and internal forces.
This document provides a manual for computational fracture mechanics exercises using ABAQUS. It describes the specimen geometry, materials, loading and boundary conditions to be analyzed. It gives an overview of ABAQUS/CAE including the file types, units and modules. Detailed steps are outlined to create the finite element model, including defining the part geometry, material properties, assembly, boundary conditions, meshing, jobs and post-processing of results. The document also discusses how to calculate elastic and elastic-plastic fracture parameters such as stress intensity factor K, J-integral and CTOD from the ABAQUS results and relates them to fracture mechanics theory.
This document discusses 2D simulations in chapter 3, including step-by-step tutorials on modeling a triangular plate under tension and a bolted connection. It describes concepts for plane stress, plane strain and axisymmetric problems. Mesh generation, loading, boundary conditions, materials and results visualization are also covered. Examples include spur gears and a filleted bar to demonstrate stress concentrations and the need for finer meshes at singular points.
This document describes experimental studies of aeroelasticity conducted in a 30cm x 30cm wind tunnel. Divergence and flutter experiments were performed on a typical airfoil section model with pitch and plunge degrees of freedom. In the divergence experiment, the divergence speed was measured in the wind tunnel and calculated theoretically, with some difference observed likely due to model assumptions. In the flutter experiment, a data acquisition system was used to record acceleration data during testing, and a MATLAB code was used to analyze the data and calculate the flutter point, allowing comparison to theoretical predictions. Open loop control was also explored by adding a control surface to modify the flutter point.
This document summarizes the results of a static simulation analysis performed on Part1. A pressure load of 10 N/m^2 was applied to one face, while another face was fixed. The maximum von Mises stress was 19.6618 N/m^2 and occurred at node 126. The maximum displacement was 8.69172e-010 mm at node 123. The simulation used linear elastic material properties for AISI 1020 steel with a mesh of 7331 elements. In conclusion, the static simulation was performed to analyze stresses and displacements in Part1 under the given loading conditions.
The document summarizes the results of a static simulation analysis conducted on a new wind turbine profile model with shear webs. The maximum von Mises stress was found to be 3.11583e+007 N/m^2 and the maximum resultant displacement was 4916.33 mm. Introducing shear webs to the model reduced the resultant displacement by 10% compared to a model without shear webs, demonstrating their reinforcing effect against flexural loads. Further analytical validation of the study results is required.
The document summarizes the results of a static simulation analysis conducted on a new wind turbine profile model with shear webs. The maximum von Mises stress was found to be 3.11583e+007 N/m^2 and the maximum resultant displacement was 4916.33 mm. Introducing shear webs reduced the resultant displacement by 10% compared to a model without shear webs, providing reinforcement against flexural loads. However, further analytical validation of the study results is required.
1) A finite element analysis was conducted on a segment tool used in a CNC press using SolidWorks Simulation.
2) The segment tool was fixed on the upper end and a force of 120,000 N was applied on the bottom end to simulate the pressing force.
3) The results found maximum von Mises stresses of 221.7 MPa, maximum displacements of 0.537 mm, and maximum equivalent strains of 0.000833, indicating the tool will withstand the intended forces without failing.
Ankit Sain submitted a project report on the design and analysis of a C-clamp. The report includes modeling of the 3D frame and components in Solidworks, 2D drawings, results from motion analysis and finite element analysis simulations, and references. The FEA analysis found that the C-clamp can withstand a maximum load of 30kN and has a factor of safety of 1 at this load. At a 7kN load, the factor of safety is 3.3. Increasing the fillet radius could further increase the clamp's load capacity.
new profile_52.3m_three points_unsplitted-Nonlinear with epoxy-1Vishnu R
This document summarizes the results of a nonlinear dynamic simulation of a 52.3m beam profile. The maximum von Mises stress was 2.06e8 N/m^2. The maximum displacement was 7162.71 mm. The maximum velocity was 730.022 mm/s and the maximum acceleration was 12.1129 mm/s^2. In conclusion, the results were consistent with an earlier static analysis for the 10 second simulation with 0.1 second time steps.
NON LINEAR ANALYSIS OF A HAWT BLADE USING LARGE DEFLECTION CRITERIAVishnu R
This document summarizes the results of a nonlinear dynamic simulation of a 52.3m beam profile. The maximum von Mises stress was 2.06e8 N/m^2. The maximum displacement was 7162.71 mm. The maximum velocity was 730.022 mm/s and the maximum acceleration was 12.1129 mm/s^2. In conclusion, the results were consistent with an earlier static analysis for the 10 second simulation with 0.1 second time steps.
Evaluation of Fixed Base vs. Base Isolated Building SystemsIJERD Editor
This document compares the seismic performance of a 6-story building designed with a fixed base versus one with a base isolation system. It first describes the modeling and design of the fixed base building in ETABS and manually, where story drift was found to be the controlling factor. Member sizes of C45x45 columns and B45x35 beams were determined to satisfy demands. The modeling of the isolated building in ETABS used response spectrum analysis, with lateral forces much less than the fixed base building. The same member sizes were found to satisfy the reduced demands. Manual calculations of the seismic design parameters and story drift checks are shown for both the fixed base and isolated base buildings according to codes.
A torsional analysis was performed on a final design using SOLIDWORKS Simulation. The analysis found a maximum shear stress of 2.37478e+008 N/m^2, maximum resultant displacement of 5.33638 mm, and a minimum factor of safety of 1.55804. The results and conclusions of the torsional analysis are summarized.
A static front impact simulation was performed on a final design. The simulation results show maximum shear stress of 2.14288e+008 N/m^2 and maximum resultant displacement of 1.18805 mm. The minimum factor of safety was 1.72665.
This stress analysis report summarizes the results of a static analysis simulation performed on a part called "flange coupling". The simulation analyzed the part under various loads and constraints. It determined the minimum and maximum values of stress, strain, displacement and other metrics. Charts of von Mises stress, principal stresses, displacement and other quantities are also included.
This document describes a photoelastic stress analysis of the bending strength of a helical gear. The analysis involved creating a 3D photoelastic model of the gear, subjecting it to loading, and freezing the stresses. Slices were cut from the model and observed under polarized light to determine stress distributions. Maximum bending stresses were calculated for different slices and scaled up to prototype values. Finite element analysis was also performed and showed good agreement with experimental results, with less than 2% variation in maximum stress values. The analysis found that helical gears experience higher peak bending stresses than spur gears due to their point contact loading.
01_FEA overview 2023-1 of fhtr j thrf for any.pptxRaviBabaladi2
Finite Element Analysis (FEA) is a numerical technique used to determine the behavior of complex geometries and systems. It breaks components down into finite elements in order to solve problems that cannot be solved through classical calculations. FEA provides outputs like stresses, strains, displacements and structural capacity that help evaluate a design. The FEA process involves preprocessing like creating a model and mesh, solving with applied loads and materials, and postprocessing the results. Models are simplified to reduce run time while ensuring accuracy of important features. FEA can be used to optimize designs before physical testing.
A static simulation analysis was performed on a final design to evaluate stress, displacement, and factor of safety. The analysis found maximum shear stress of 2.60655e+008 N/m^2, resultant displacement of 7.23501 mm, and minimum safety factor of 1.4195. The results and conclusions of the simulation are presented.
The document summarizes a finite element analysis project to analyze stresses in an aluminum T-slot bracket under vertical loading. Key points:
1) A finite element model of the bracket was created in ANSYS and loaded vertically to simulate real-world use.
2) An analytical solution using 3 frame approximations was developed for validation.
3) The results from ANSYS converged with mesh refinement and showed stresses well below the yield point, indicating the bracket would withstand the loads.
This document summarizes a laboratory report on testing the elastic behavior of steel beams. Strain gauges were attached to steel beams and they were loaded at their center point to induce stress. The strain readings from the gauges and load levels were recorded. Stress-strain curves were plotted and the modulus of elasticity was calculated from the slope of the linear elastic region. The experimentally determined modulus was found to be 29.96*106 psi, close to the accepted value of 29*106 psi, demonstrating steel's predictable elastic behavior.
This document summarizes a finite element analysis course project involving the analysis of a shear wall and shell intersection model. Key aspects include:
- Node and element label plots are provided for the shear wall under shear and thermal loading, and for the shell model.
- Deformation plots from ABAQUS and MATLAB are shown for the shear wall under shear and thermal loading, and for the shell model under pressure loading.
- Results from ABAQUS and MATLAB are compared and percentage errors discussed.
- Stress plots like von Mises and principal stresses from ABAQUS and MATLAB are presented for the shear wall and shell models.
- Codes written for creating shape functions, stiffness matrices, and performing other finite element
The document summarizes the results of a natural frequency simulation performed on a model. The simulation determined the first two natural frequencies to be 3375.2 Hz and 3396.42 Hz. The model consisted of three solid bodies made of AISI 1020 steel, which were fully constrained at one end. A mesh of over 17,000 nodes and 10,000 elements was generated for the frequency study. Displacement plots for the first two modes showed the maximum deflections.
Harnessing WebAssembly for Real-time Stateless Streaming PipelinesChristina Lin
Traditionally, dealing with real-time data pipelines has involved significant overhead, even for straightforward tasks like data transformation or masking. However, in this talk, we’ll venture into the dynamic realm of WebAssembly (WASM) and discover how it can revolutionize the creation of stateless streaming pipelines within a Kafka (Redpanda) broker. These pipelines are adept at managing low-latency, high-data-volume scenarios.
A review on techniques and modelling methodologies used for checking electrom...nooriasukmaningtyas
The proper function of the integrated circuit (IC) in an inhibiting electromagnetic environment has always been a serious concern throughout the decades of revolution in the world of electronics, from disjunct devices to today’s integrated circuit technology, where billions of transistors are combined on a single chip. The automotive industry and smart vehicles in particular, are confronting design issues such as being prone to electromagnetic interference (EMI). Electronic control devices calculate incorrect outputs because of EMI and sensors give misleading values which can prove fatal in case of automotives. In this paper, the authors have non exhaustively tried to review research work concerned with the investigation of EMI in ICs and prediction of this EMI using various modelling methodologies and measurement setups.
Using recycled concrete aggregates (RCA) for pavements is crucial to achieving sustainability. Implementing RCA for new pavement can minimize carbon footprint, conserve natural resources, reduce harmful emissions, and lower life cycle costs. Compared to natural aggregate (NA), RCA pavement has fewer comprehensive studies and sustainability assessments.
Presentation of IEEE Slovenia CIS (Computational Intelligence Society) Chapte...University of Maribor
Slides from talk presenting:
Aleš Zamuda: Presentation of IEEE Slovenia CIS (Computational Intelligence Society) Chapter and Networking.
Presentation at IcETRAN 2024 session:
"Inter-Society Networking Panel GRSS/MTT-S/CIS
Panel Session: Promoting Connection and Cooperation"
IEEE Slovenia GRSS
IEEE Serbia and Montenegro MTT-S
IEEE Slovenia CIS
11TH INTERNATIONAL CONFERENCE ON ELECTRICAL, ELECTRONIC AND COMPUTING ENGINEERING
3-6 June 2024, Niš, Serbia
CHINA’S GEO-ECONOMIC OUTREACH IN CENTRAL ASIAN COUNTRIES AND FUTURE PROSPECTjpsjournal1
The rivalry between prominent international actors for dominance over Central Asia's hydrocarbon
reserves and the ancient silk trade route, along with China's diplomatic endeavours in the area, has been
referred to as the "New Great Game." This research centres on the power struggle, considering
geopolitical, geostrategic, and geoeconomic variables. Topics including trade, political hegemony, oil
politics, and conventional and nontraditional security are all explored and explained by the researcher.
Using Mackinder's Heartland, Spykman Rimland, and Hegemonic Stability theories, examines China's role
in Central Asia. This study adheres to the empirical epistemological method and has taken care of
objectivity. This study analyze primary and secondary research documents critically to elaborate role of
china’s geo economic outreach in central Asian countries and its future prospect. China is thriving in trade,
pipeline politics, and winning states, according to this study, thanks to important instruments like the
Shanghai Cooperation Organisation and the Belt and Road Economic Initiative. According to this study,
China is seeing significant success in commerce, pipeline politics, and gaining influence on other
governments. This success may be attributed to the effective utilisation of key tools such as the Shanghai
Cooperation Organisation and the Belt and Road Economic Initiative.
A SYSTEMATIC RISK ASSESSMENT APPROACH FOR SECURING THE SMART IRRIGATION SYSTEMSIJNSA Journal
The smart irrigation system represents an innovative approach to optimize water usage in agricultural and landscaping practices. The integration of cutting-edge technologies, including sensors, actuators, and data analysis, empowers this system to provide accurate monitoring and control of irrigation processes by leveraging real-time environmental conditions. The main objective of a smart irrigation system is to optimize water efficiency, minimize expenses, and foster the adoption of sustainable water management methods. This paper conducts a systematic risk assessment by exploring the key components/assets and their functionalities in the smart irrigation system. The crucial role of sensors in gathering data on soil moisture, weather patterns, and plant well-being is emphasized in this system. These sensors enable intelligent decision-making in irrigation scheduling and water distribution, leading to enhanced water efficiency and sustainable water management practices. Actuators enable automated control of irrigation devices, ensuring precise and targeted water delivery to plants. Additionally, the paper addresses the potential threat and vulnerabilities associated with smart irrigation systems. It discusses limitations of the system, such as power constraints and computational capabilities, and calculates the potential security risks. The paper suggests possible risk treatment methods for effective secure system operation. In conclusion, the paper emphasizes the significant benefits of implementing smart irrigation systems, including improved water conservation, increased crop yield, and reduced environmental impact. Additionally, based on the security analysis conducted, the paper recommends the implementation of countermeasures and security approaches to address vulnerabilities and ensure the integrity and reliability of the system. By incorporating these measures, smart irrigation technology can revolutionize water management practices in agriculture, promoting sustainability, resource efficiency, and safeguarding against potential security threats.
KuberTENes Birthday Bash Guadalajara - K8sGPT first impressionsVictor Morales
K8sGPT is a tool that analyzes and diagnoses Kubernetes clusters. This presentation was used to share the requirements and dependencies to deploy K8sGPT in a local environment.
DEEP LEARNING FOR SMART GRID INTRUSION DETECTION: A HYBRID CNN-LSTM-BASED MODELgerogepatton
As digital technology becomes more deeply embedded in power systems, protecting the communication
networks of Smart Grids (SG) has emerged as a critical concern. Distributed Network Protocol 3 (DNP3)
represents a multi-tiered application layer protocol extensively utilized in Supervisory Control and Data
Acquisition (SCADA)-based smart grids to facilitate real-time data gathering and control functionalities.
Robust Intrusion Detection Systems (IDS) are necessary for early threat detection and mitigation because
of the interconnection of these networks, which makes them vulnerable to a variety of cyberattacks. To
solve this issue, this paper develops a hybrid Deep Learning (DL) model specifically designed for intrusion
detection in smart grids. The proposed approach is a combination of the Convolutional Neural Network
(CNN) and the Long-Short-Term Memory algorithms (LSTM). We employed a recent intrusion detection
dataset (DNP3), which focuses on unauthorized commands and Denial of Service (DoS) cyberattacks, to
train and test our model. The results of our experiments show that our CNN-LSTM method is much better
at finding smart grid intrusions than other deep learning algorithms used for classification. In addition,
our proposed approach improves accuracy, precision, recall, and F1 score, achieving a high detection
accuracy rate of 99.50%.
IEEE Aerospace and Electronic Systems Society as a Graduate Student Member
Bracket simulation static 1-1
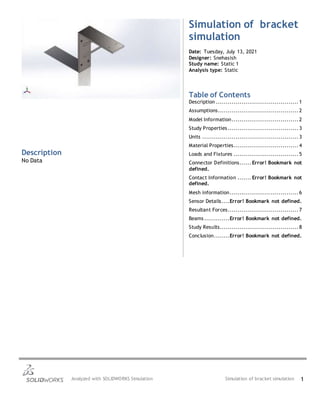
1. Analyzed with SOLIDWORKS Simulation Simulation of bracket simulation 1
Simulation of bracket
simulation
Date: Tuesday, July 13, 2021
Designer: Snehasish
Study name: Static 1
Analysis type: Static
Table of Contents
Description .......................................... 1
Assumptions......................................... 2
Model Information.................................. 2
Study Properties.................................... 3
Units ................................................. 3
Material Properties................................. 4
Loads and Fixtures ................................. 5
Connector Definitions...... Error! Bookmark not
defined.
Contact Information ....... Error! Bookmark not
defined.
Mesh information................................... 6
Sensor Details....Error! Bookmark not defined.
Resultant Forces.................................... 7
Beams.............Error! Bookmark not defined.
Study Results........................................ 8
Conclusion........Error! Bookmark not defined.
Description
No Data
2. Snehasish
7/13/2021
Analyzed with SOLIDWORKS Simulation Simulation of bracket simulation 2
Assumptions
Model Information
Model name: bracket simulation
Current Configuration: Default
Solid Bodies
Document Name and
Reference
Treated As Volumetric Properties
Document Path/Date
Modified
Fillet1
Solid Body
Mass:5.18761 kg
Volume:0.000673716 m^3
Density:7,700 kg/m^3
Weight:50.8386 N
C:UsersSNEHASISHDocu
mentsNew folderbracket
simulation.SLDPRT
Jul 13 18:46:12 2021
3. Snehasish
7/13/2021
Analyzed with SOLIDWORKS Simulation Simulation of bracket simulation 3
Study Properties
Study name Static 1
Analysis type Static
Mesh type Solid Mesh
Thermal Effect: On
Thermal option Include temperature loads
Zero strain temperature 298 Kelvin
Include fluid pressure effects from SOLIDWORKS
Flow Simulation
Off
Solver type FFEPlus
Inplane Effect: Off
Soft Spring: Off
Inertial Relief: Off
Incompatible bonding options Automatic
Large displacement Off
Compute free body forces On
Friction Off
Use Adaptive Method: Off
Result folder SOLIDWORKS document
(C:UsersSNEHASISHDocumentsNew folder)
Units
Unit system: SI (MKS)
Length/Displacement mm
Temperature Kelvin
Angular velocity Rad/sec
Pressure/Stress N/m^2
4. Snehasish
7/13/2021
Analyzed with SOLIDWORKS Simulation Simulation of bracket simulation 4
Material Properties
Model Reference Properties Components
Name: Alloy Steel
Model type: Linear Elastic Isotropic
Default failure
criterion:
Max von Mises Stress
Yield strength: 6.20422e+08 N/m^2
Tensile strength: 7.23826e+08 N/m^2
Elastic modulus: 2.1e+11 N/m^2
Poisson's ratio: 0.28
Mass density: 7,700 kg/m^3
Shear modulus: 7.9e+10 N/m^2
Thermal expansion
coefficient:
1.3e-05 /Kelvin
SolidBody 1(Fillet1)(bracket
simulation)
Curve Data:N/A
5. Snehasish
7/13/2021
Analyzed with SOLIDWORKS Simulation Simulation of bracket simulation 5
Loads and Fixtures
Fixture name Fixture Image Fixture Details
Fixed-1
Entities: 13 face(s)
Type: Fixed Geometry
Resultant Forces
Components X Y Z Resultant
Reaction force(N) 0.0028696 830.798 0.00732226 830.798
Reaction Moment(N.m) 0 0 0 0
Load name Load Image Load Details
Distributed
Mass-1
Entities: 1 face(s)
Type: Displacement (Direct
transfer)
Coordinate System: Global cartesian
coordinates
Translation Values: ---, ---, --- mm
Rotation Values: ---, ---, --- deg
Reference coordinates: 0 0 0 mm
Remote Mass: 80 kg
Moment of Inertia: 0,0,0,0,0,0 kg.m^2
Components transferred: NA
Gravity-1
Reference: Top Plane
Values: 0 0 -9.81
Units: m/s^2
6. Snehasish
7/13/2021
Analyzed with SOLIDWORKS Simulation Simulation of bracket simulation 6
Mesh information
Mesh type Solid Mesh
Mesher Used: Standard mesh
Automatic Transition: Off
Include Mesh Auto Loops: Off
Jacobian points for High quality mesh 16 Points
Element Size 7.54834 mm
Tolerance 0.377417 mm
Mesh Quality High
Mesh information - Details
Total Nodes 26939
Total Elements 15403
Maximum Aspect Ratio 4.3146
% of elements with Aspect Ratio < 3 98.9
% of elements with Aspect Ratio > 10 0
% of distorted elements(Jacobian) 0
Time to complete mesh(hh;mm;ss): 00:00:03
Computer name:
7. Snehasish
7/13/2021
Analyzed with SOLIDWORKS Simulation Simulation of bracket simulation 7
Resultant Forces
Reaction forces
Selection set Units Sum X Sum Y Sum Z Resultant
Entire Model N 0.0028696 830.798 0.00732226 830.798
Reaction Moments
Selection set Units Sum X Sum Y Sum Z Resultant
Entire Model N.m 0 0 0 0
Free body forces
Selection set Units Sum X Sum Y Sum Z Resultant
Entire Model N 0.0996159 41.0008 0.00397462 41.001
Free body moments
Selection set Units Sum X Sum Y Sum Z Resultant
Entire Model N.m 0 0 0 1e-33
8. Snehasish
7/13/2021
Analyzed with SOLIDWORKS Simulation Simulation of bracket simulation 8
Study Results
Name Type Min Max
Stress1 VON: von Mises Stress 2.239e+01N/m^2
Node: 21147
1.103e+07N/m^2
Node: 25146
bracket simulation-Static 1-Stress-Stress1
Name Type Min Max
Displacement1 URES: Resultant Displacement 0.000e+00mm
Node: 129
4.180e-02mm
Node: 1294
9. Snehasish
7/13/2021
Analyzed with SOLIDWORKS Simulation Simulation of bracket simulation 9
bracket simulation-Static 1-Displacement-Displacement1
Name Type Min Max
Strain1 ESTRN: Equivalent Strain 4.633e-10
Element: 6052
3.258e-05
Element: 12507
10. Snehasish
7/13/2021
Analyzed with SOLIDWORKS Simulation Simulation of bracket simulation 10
bracket simulation-Static 1-Strain-Strain1
Name Type Min Max
Factor of Safety1 Automatic 5.626e+01
Node: 25146
2.771e+07
Node: 21147