Download to read offline
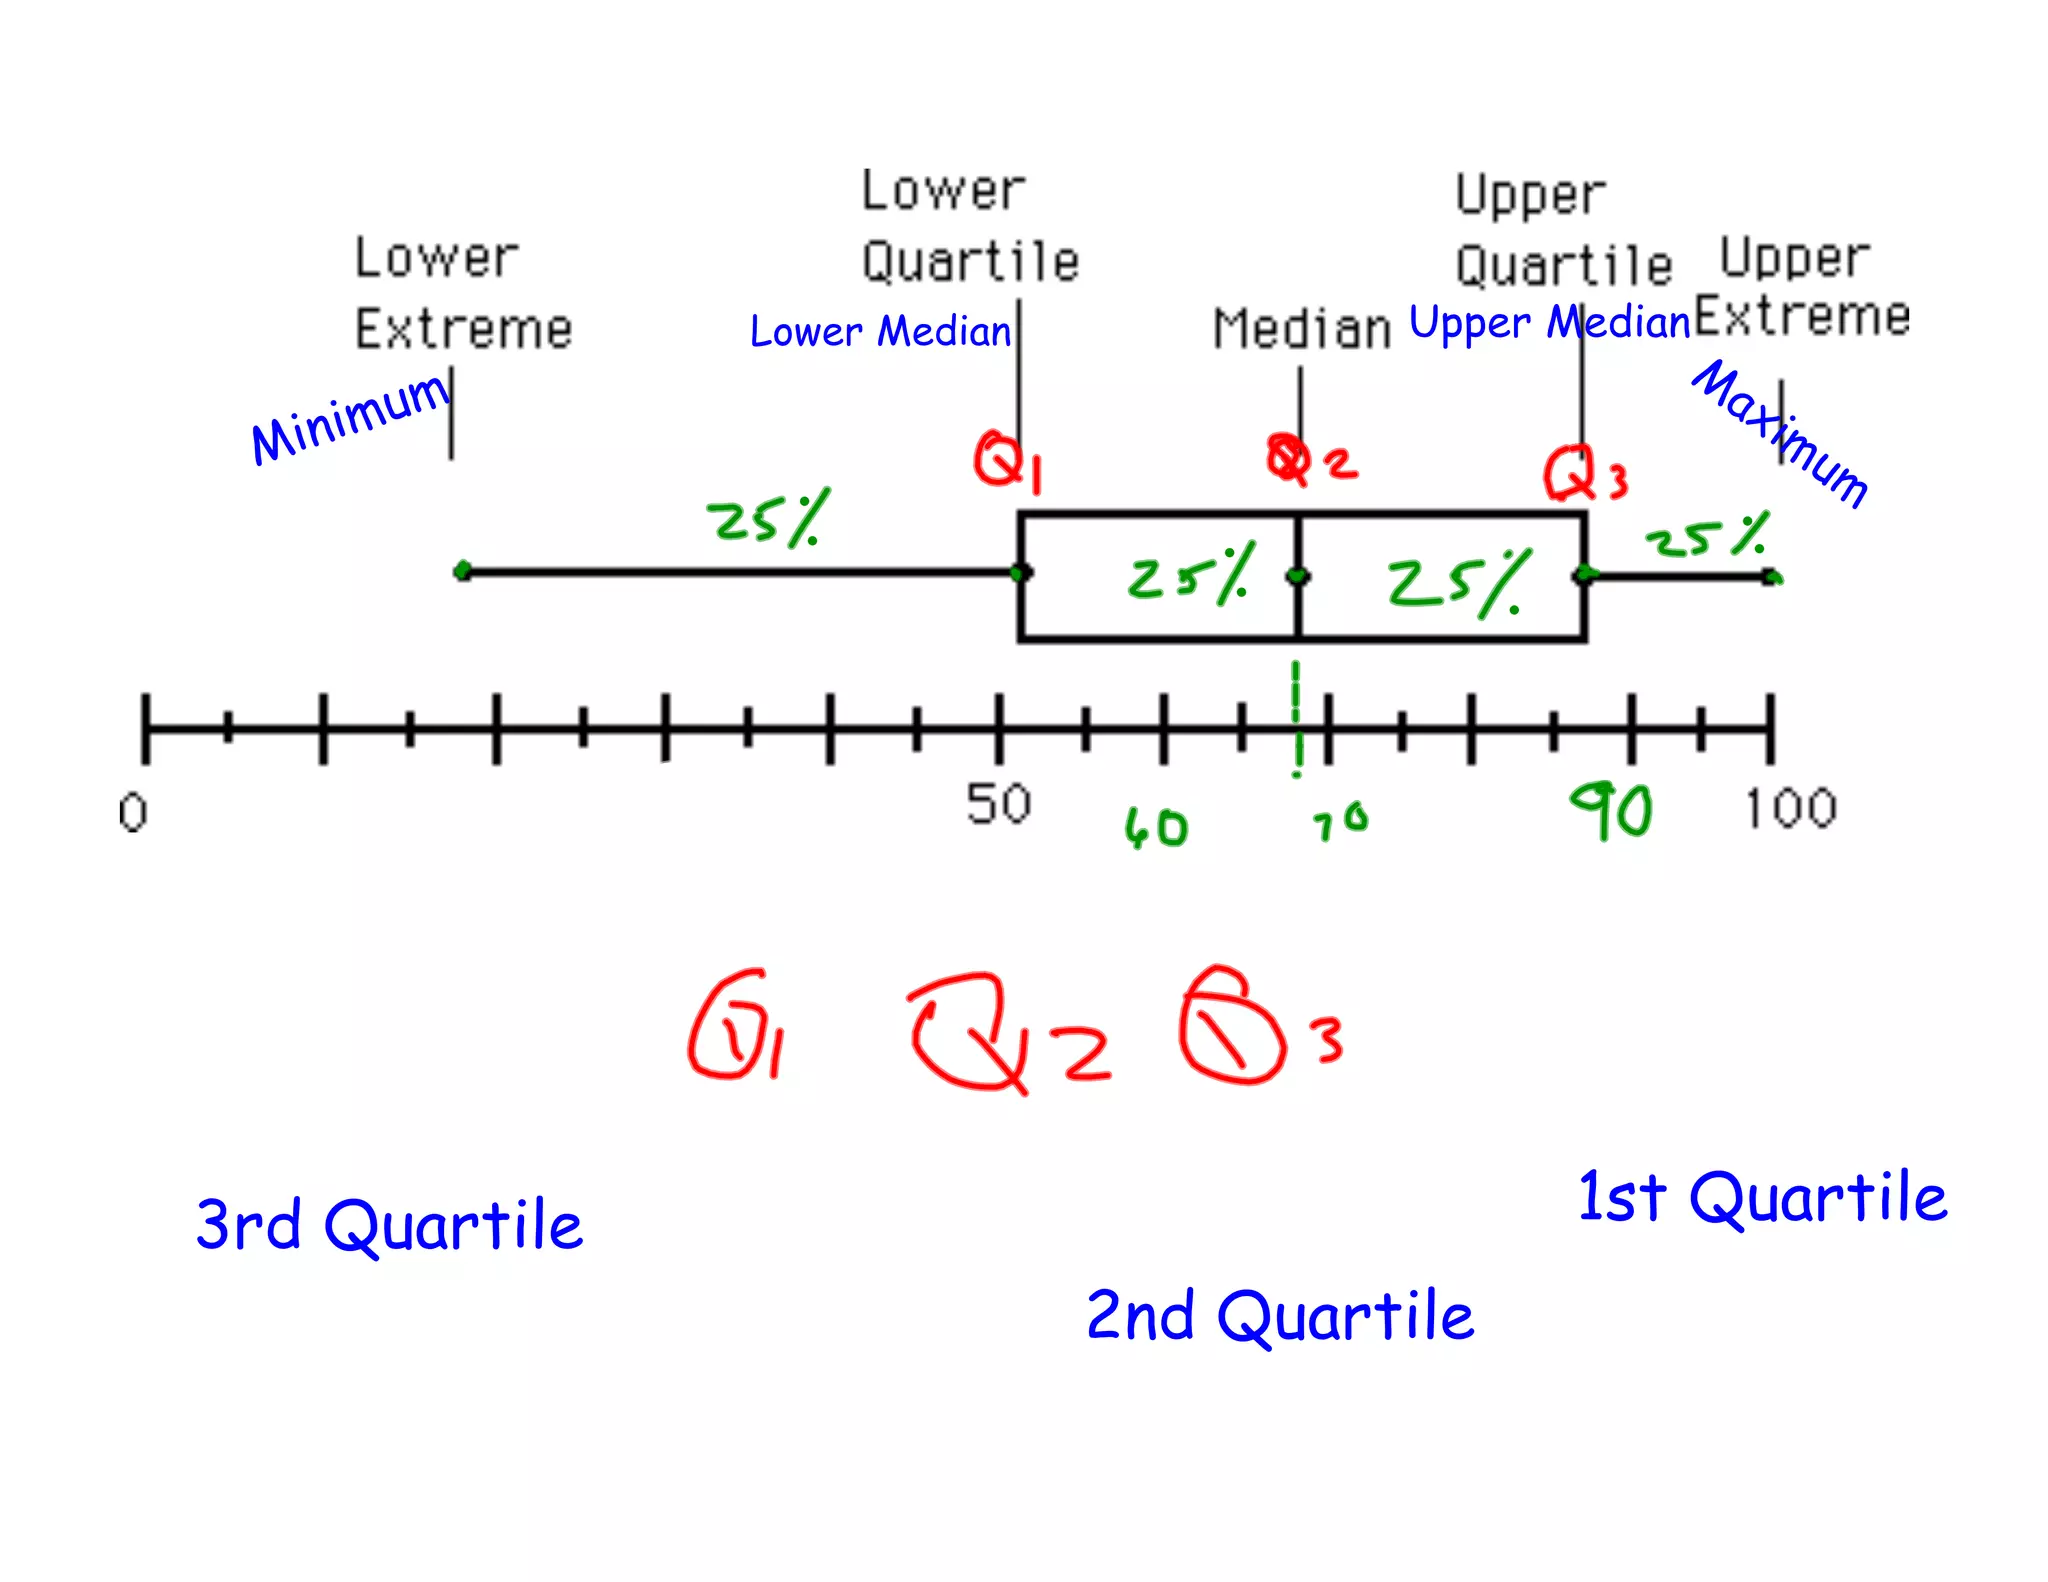
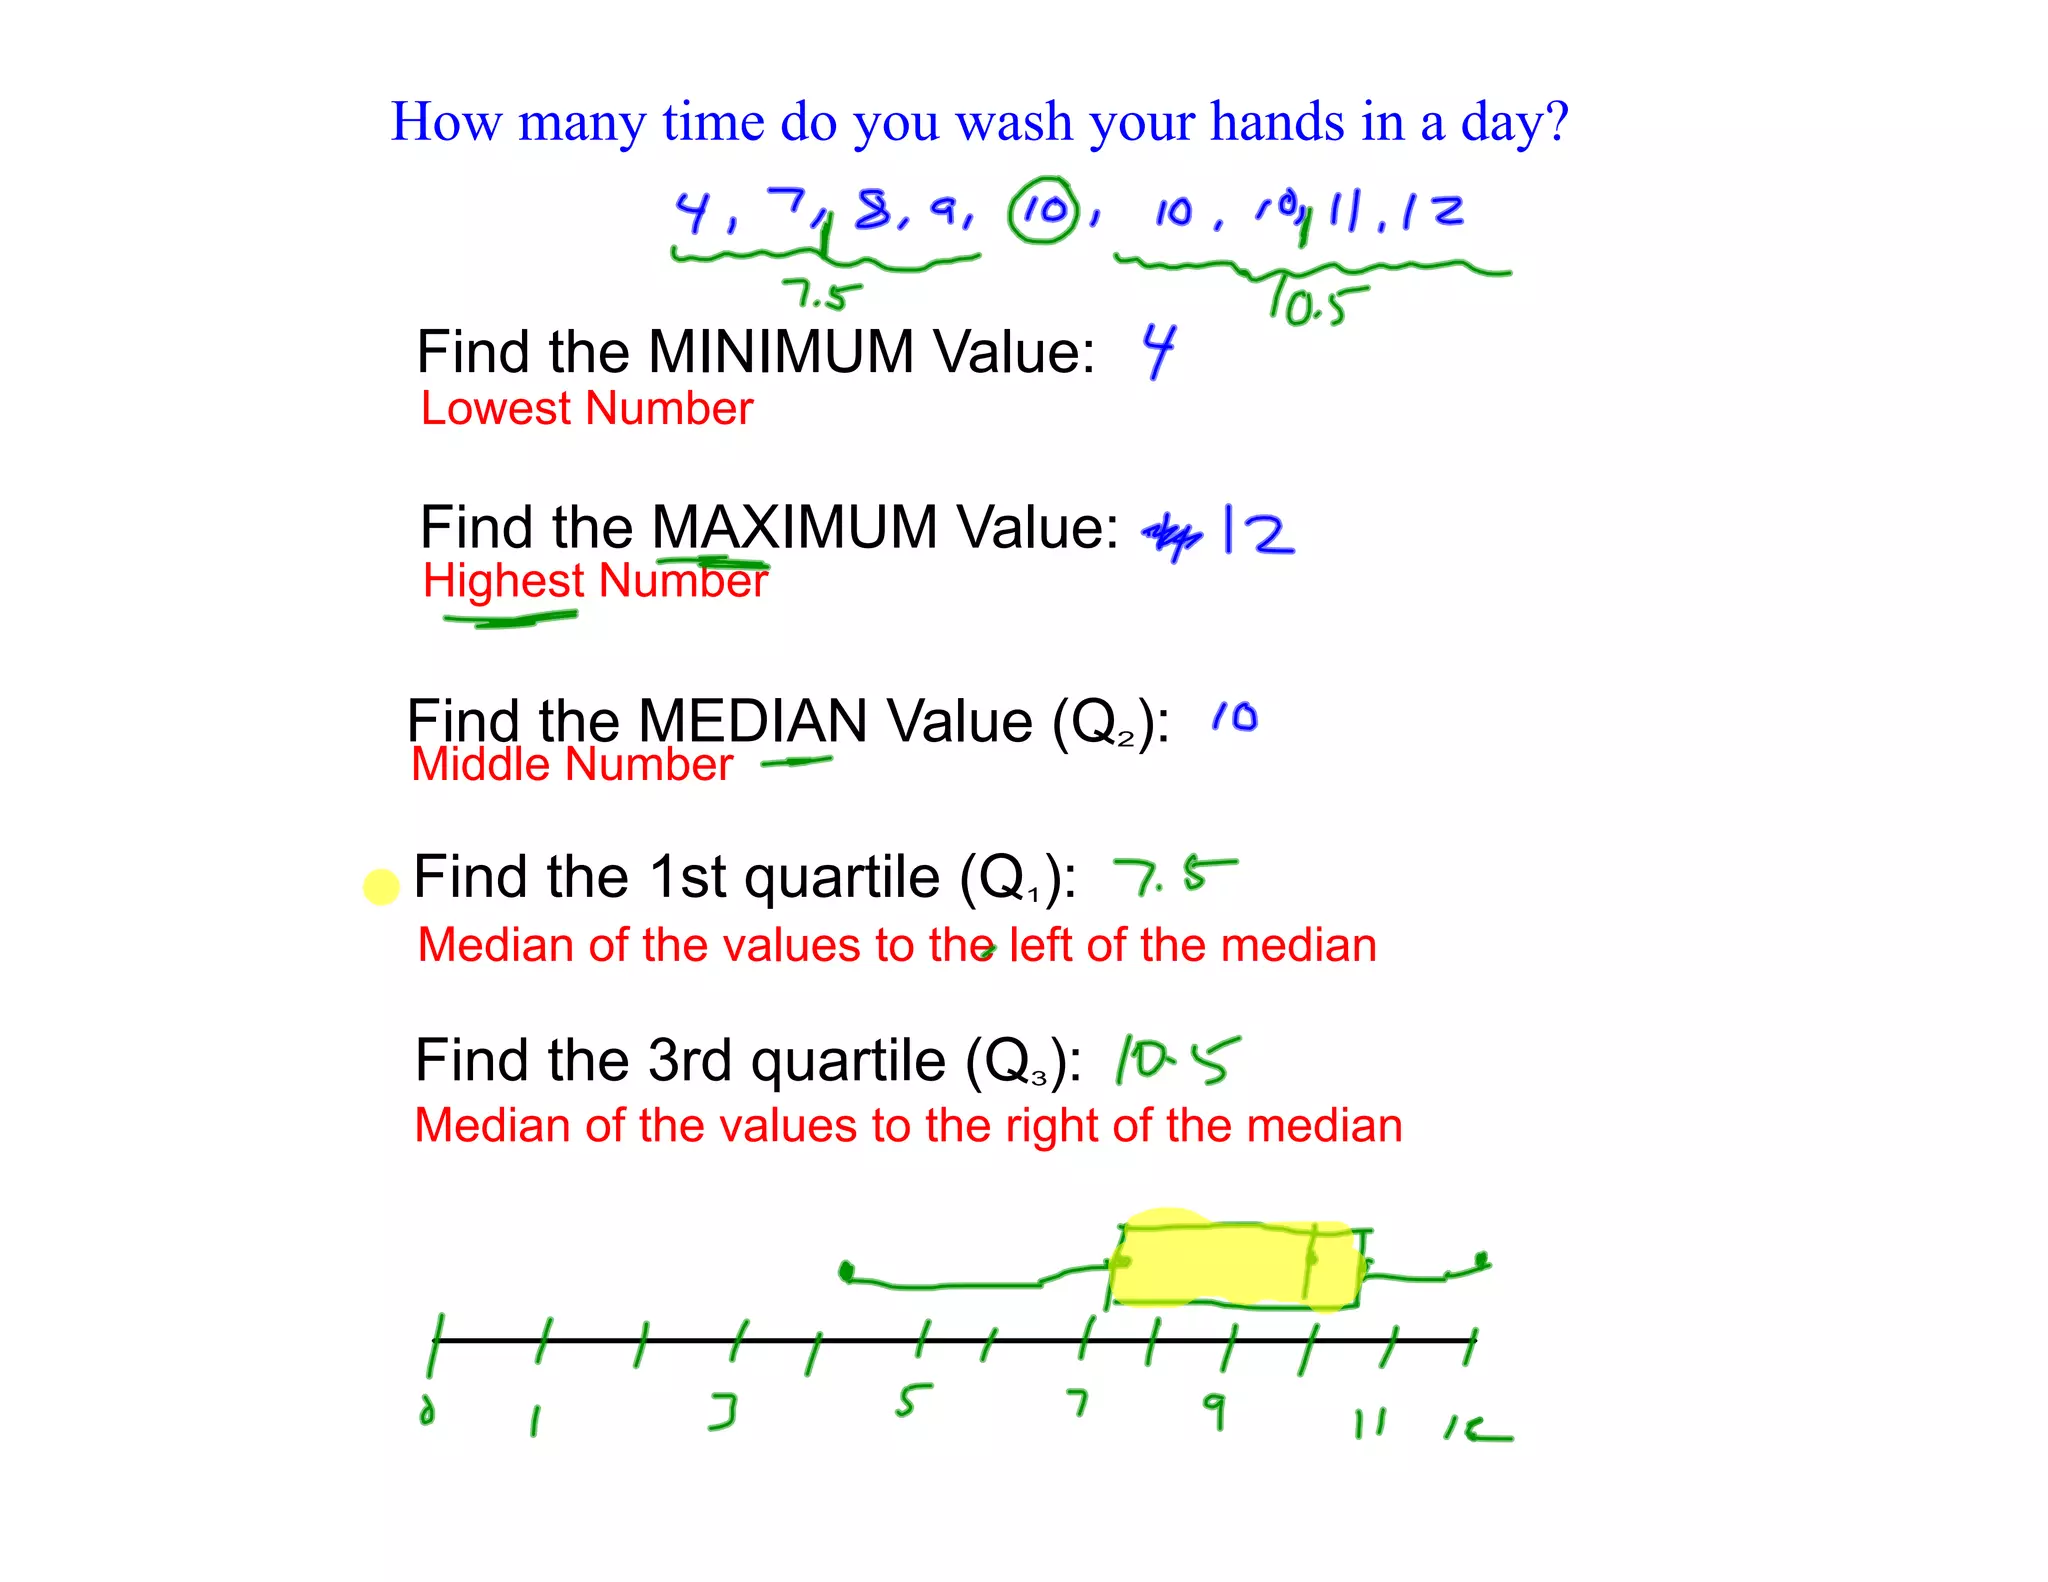
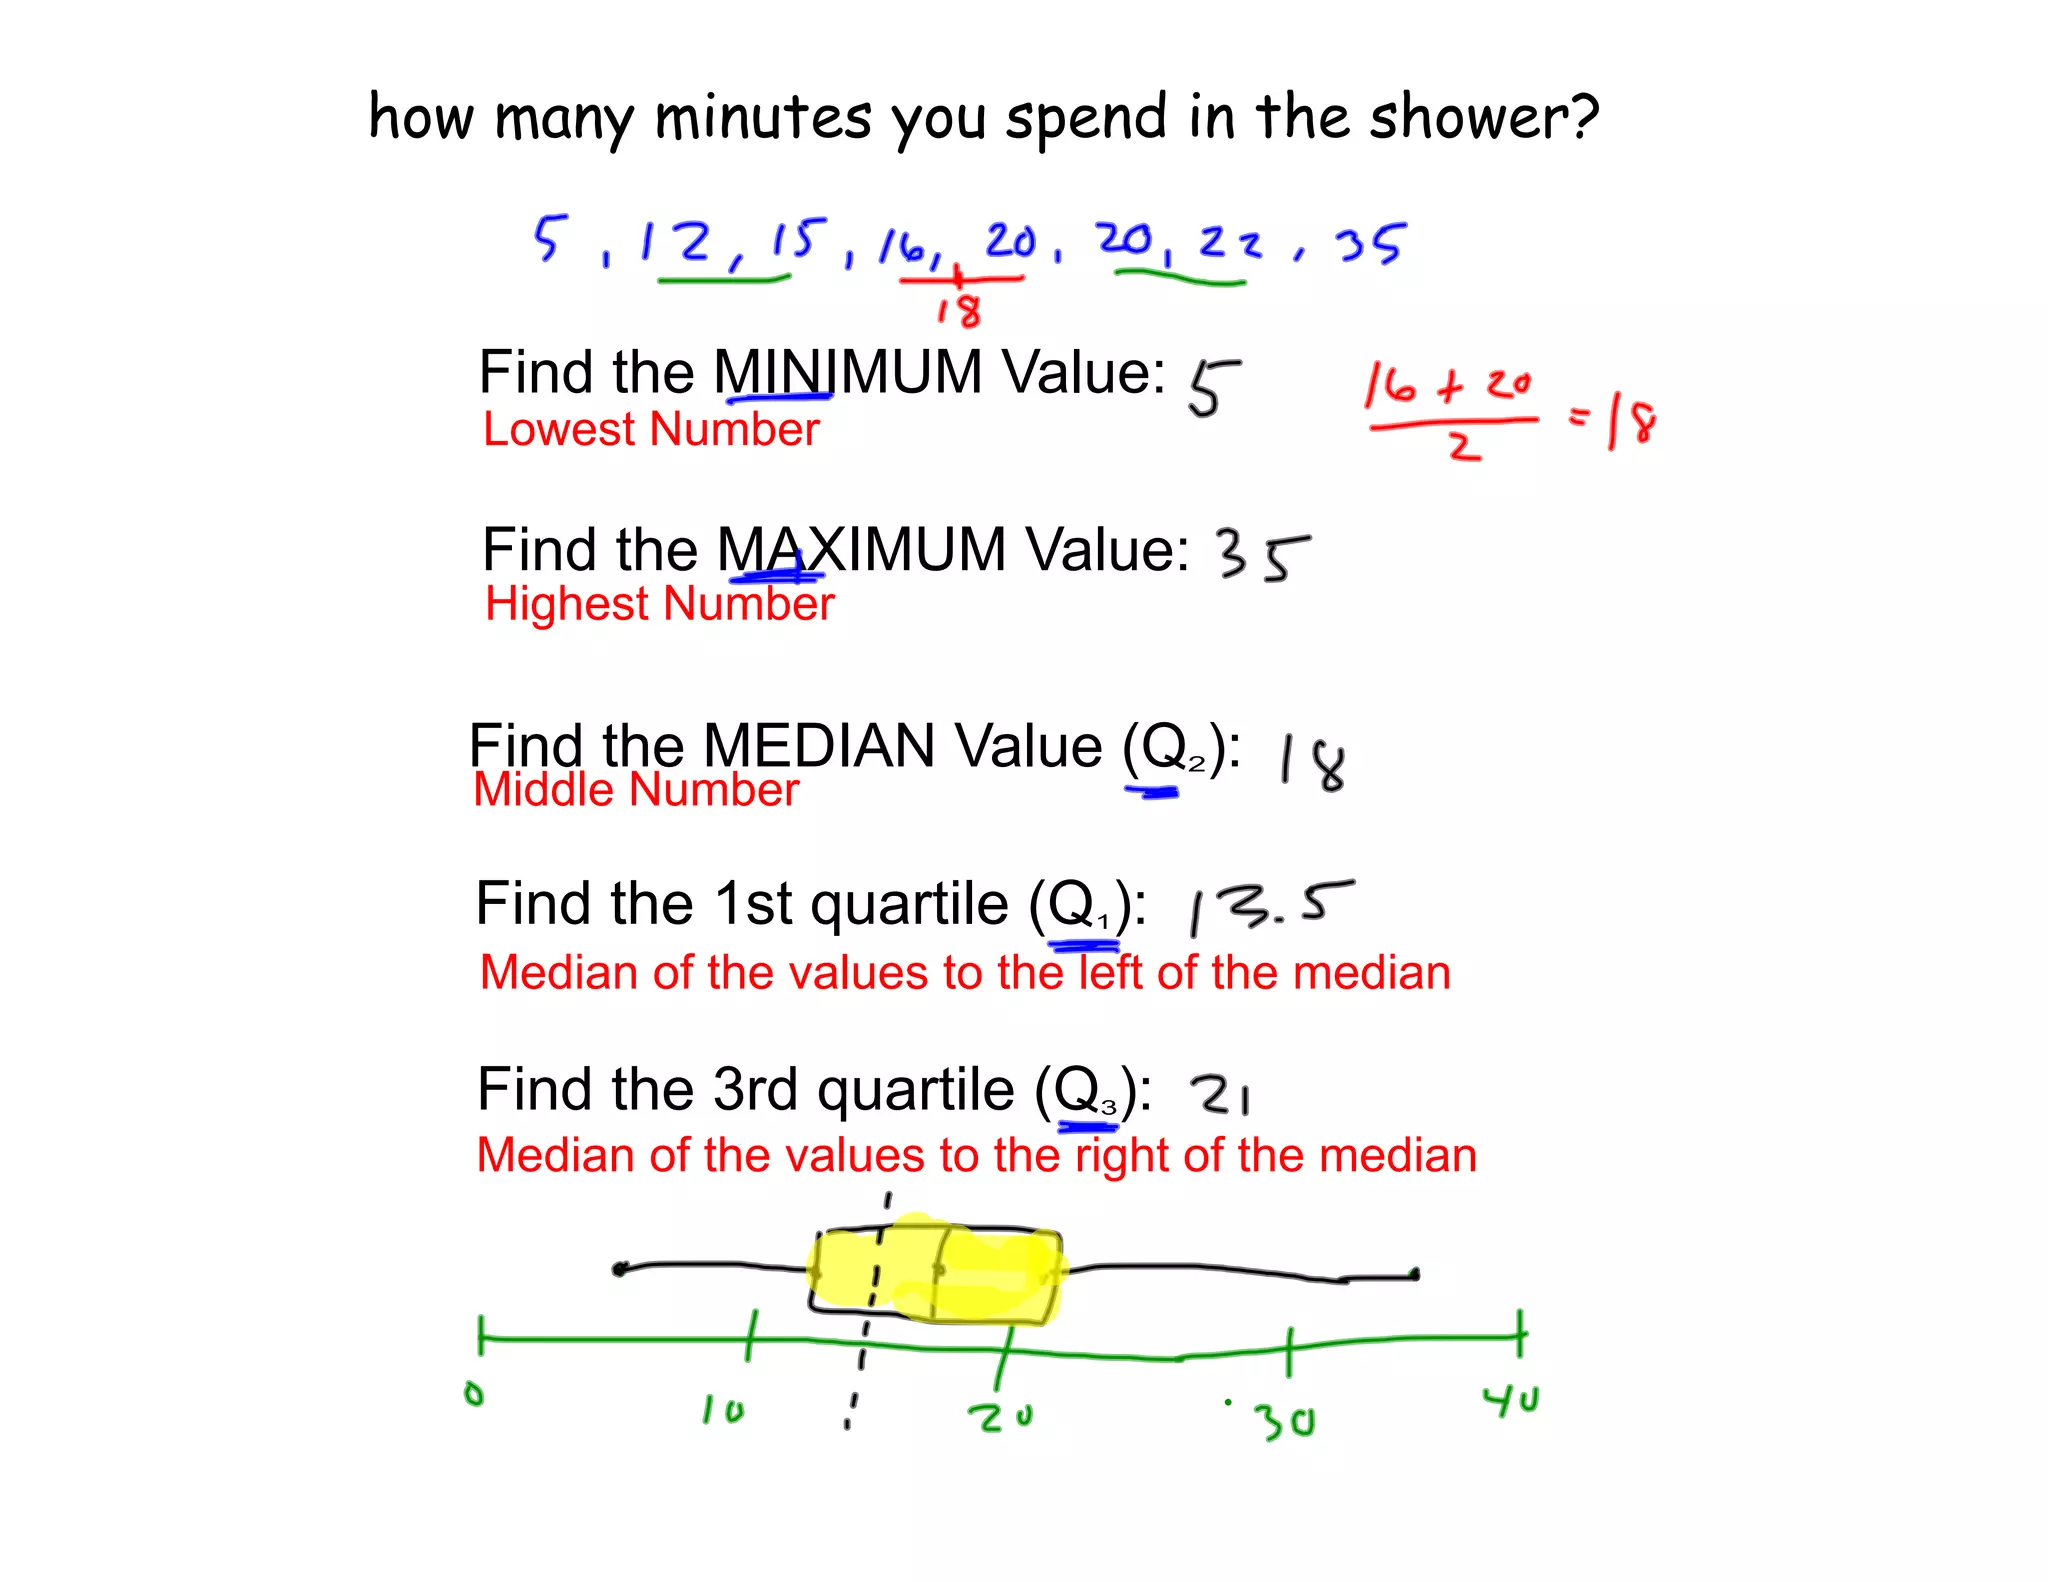

This document provides instructions for creating and interpreting a box and whisker plot. It explains how to find the minimum, maximum, median, first quartile and third quartile values from a data set. These values are used to construct the box and whisker plot, with examples given for number of times washing hands per day and minutes spent showering. Students are then asked to choose a meaningful topic for a data set to analyze using a box and whisker plot.


![Boxand whiskerplots[1]ppt](https://cdn.slidesharecdn.com/ss_thumbnails/boxandwhiskerplots1ppt-100504002713-phpapp02-thumbnail.jpg?width=640&height=640&fit=bounds)


