Book2 Copy
•Download as XLSX, PDF•
0 likes•93 views
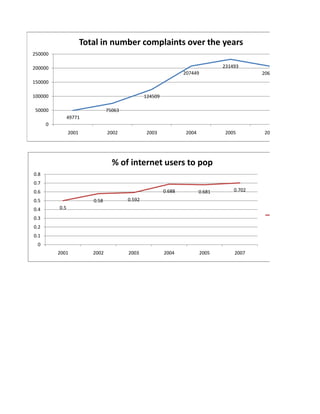
The document shows two line graphs. The first graph shows the total number of complaints over the years from 2001 to 2007, peaking at around 230,000 in 2005. The second graph shows the percentage of internet users compared to the total population from 2001 to 2007, increasing each year from 0.5 to 0.7.
Report
Share
Report
Share

Recommended
Comparison of Internet Users and Cyber Crime Rates
The document contains two line graphs. The first graph shows the total number of complaints over several years, ranging from around 50,000 in 2001 to over 230,000 in 2007. The second graph shows the percentage of internet users compared to the total population over the same years, ranging from 0.5% in 2001 to 0.7% in 2007.
Cases and places
The document shows sales data from 2005 to 2008 for various mobile device categories including standard mobile phones, camera phones, music phones, wireless PDAs, satellite radios, headsets, and other accessories. Standard mobile phone sales saw the largest increase over the four year period, growing from about 87,598 units in 2005 to over 188,785 units in 2008, while music phone sales decreased from around 65,942 units in 2005 to 15,696 units in 2008.
Cases and places
College costs continue to rise each year, putting more financial pressure on students and families. There are options for financial support available, such as scholarships, grants, work-study programs, and student loans. However, the rising costs mean that these options may not cover all expenses associated with obtaining a college degree.
Cases and place
The document shows sales data from 2005 to 2008 for various mobile device categories including standard mobile phones, camera phones, music phones, wireless PDAs, satellite radios, headsets, and other accessories. Standard mobile phone sales saw the largest increase over the four years, growing from about 87,598 units in 2005 to over 188,785 units in 2008, while music phone sales decreased from around 65,942 units in 2005 to 15,696 units in 2008.
Livro+sobre+autismo
Este documento conta a história de uma criança que apresenta sintomas de autismo, como dificuldades de comunicação e interação social. O Capitão Mundo Brilhante detecta a presença do "Fantasma do Autismo" e estabelece o diagnóstico da criança. A história termina em suspense, desafiando o leitor a imaginar como o Capitão poderá ajudar a enfrentar os desafios do autismo.
Letters to zog
The document discusses the benefits of exercise for mental health. Regular physical activity can help reduce anxiety and depression and improve mood and cognitive function. Exercise causes chemical changes in the brain that may help protect against mental illness and improve symptoms.
Modelamiento basico
El documento describe las funciones básicas de modelado como seleccionar, mover, rotar y escalar objetos. Se explica que seleccionar un objeto permite moverlo usando las teclas de flecha o el mouse, y rotarlo haciendo clic en el botón de rotación. También permite agrandar u reducir uniformemente los objetos seleccionados.
High level integrated security measures
Protection Strategies, Inc. is a consulting firm that assists clients with developing high-level integrated security plans to protect against natural and manmade threats. They help organizations secure physical facilities with trained security guards if needed, and protect critical data through operational security efforts. A truly integrated security plan also addresses training security personnel and testing their efficiency to ensure the organization is fully prepared for any situation.
Fit to sell
The document provides an overview of Fit To Sell membership sales training which includes 4 modules: why people buy, building rapport, needs analysis, and closing the sale. It discusses the psychological and emotional reasons why people purchase items and outlines 5 keys to influencing the buying process: addressing wants/needs, appealing to identity and values, compelling action, focusing on what is thought/felt, and desiring pleasure over pain. Effective sales techniques like asking influential questions, establishing rapport, identifying customer needs through questioning, and handling objections are also summarized.
Posicionar tu marca session 3
El documento habla sobre la importancia de tener presencia en la web para las empresas. Explica que es necesario ir más allá de las 4P y posicionarse en buscadores. También discute elementos clave para diseñar una web como contar una historia, ofrecer testimonios de clientes, mensajes orientados a la acción y diseño atractivo. El comercio electrónico u otras plataformas pueden usarse para vender productos en línea. Lo más importante es tener una web dinámica, coherente y con credibilidad.
The microstructure of the european sovereign bond market. Loriana Pellizzon. ...
This study analyzes the microstructure of the European sovereign bond market during the Eurozone crisis between 2011-2012. It finds that credit risk, as measured by CDS spreads, is non-linearly related to market liquidity, as higher credit risk leads to much greater illiquidity. Market makers temporarily stopped participating when CDS spreads widened significantly. ECB interventions successfully reduced solvency concerns and improved liquidity. The analysis uses a unique high-frequency dataset of order and trade data from the Italian sovereign bond market, the largest in the Eurozone, to examine changes in liquidity measures like bid-ask spreads and quote quantities around periods of financial stress.
New Testament Lesson 14
The document discusses the parable of the Good Samaritan from the Bible and how Christians should treat their neighbors with compassion. It encourages class members to forgive others, be charitable, and help those in need as the Good Samaritan did. A video is presented on the parable and President Howard W. Hunter is quoted teaching that believers should have no boundaries or narrow loyalties in showing love to their neighbors.
Presentation slides - Gigabit
Gigabit is a web application that aims to streamline the process of booking artists for concerts by allowing artists to advertise their availability and promoters to view artists' profiles and schedules. The document discusses research conducted with promoters, bands, and the public to determine pain points in the current booking process and interest in using a calendar-based system. It also outlines the prototype created, planned implementation strategy including alpha and beta testing, and project plan for the upcoming year.
Noticia de agosto
Un estudio encontró que los estudiantes que guardaron sus preguntas en una computadora podían recordar más fácilmente en qué carpeta estaban guardadas las preguntas que las propias preguntas. Esto sugiere que las personas están dependiendo más de las computadoras para almacenar conocimiento en lugar de memorizarlo internamente. Aunque las computadoras no reemplazarán la mente humana, parece que están cambiando la forma en que las personas almacenan información y aprenden.
Internal training - Human Resource Management
Internal Training is a crucial part for an organization. Here i discussed some important points regarding this process. It will help the org. to increase their productivity.
Líder Treinador #1
Disney anima a los lectores a perseguir sus sueños con valentía y determinación, asegurando que si tienen el coraje para hacerlo, pueden hacer que sus sueños se hagan realidad.
005 NCWRM 2011 Karamanos_AIA
Regional Conference on Advancing Non Conventional Water Resources Management in the Mediterranean, 14-15 September 2011, Athens, Greece
Images presentation
Madain Saleh is an archaeological site located in Saudi Arabia that contains well-preserved ruins and tombs from the Nabataean kingdom. The site includes tombs carved into sandstone cliffs, structures such as the Diwan where the Nabataeans conducted business and governance activities, and evidence of wind erosion shaping the landscape over centuries.
Packaging Examples
The document discusses the benefits of exercise for mental health. Regular physical activity can help reduce anxiety and depression and improve mood and cognitive functioning. Exercise causes chemical changes in the brain that may help protect against mental illness and improve symptoms.
Annual Report 2012
This document appears to be an annual report from 2012 that includes:
1) A welcome from Kenichi Ishigaki and information about YAPC::Asia 2012.
2) Lists of the top 10 qualitative Japanese authors for 2012 and statistics on new CPAN authors in Japan and worldwide from 2000-2012.
3) Charts showing trends in the number of releases by Japanese authors, worldwide releases, active authors in Japan, and active authors worldwide from 2000-2012.
4) A thank you message at the end.
[Gleap] Agribank Report
GLEAP Việt Nam khởi nguồn là nhóm tư vấn độc lập hoạt động trong lĩnh vực truyền thông và công nghệ cao từ năm 2005.
Năm 2011, nhóm chính thức thành lập Công ty TNHH GLEAP Việt Nam, tiếp tục phát huy kinh nghiệm và thế mạnh trong các lĩnh vực tư vấn truyền thông, tư vấn thương hiệu, thiết kế sáng tạo và tổ chức sự kiện.
GLEAP tự tin hỗ trợ khách hàng:
Nâng cao giá trị doanh nghiệp thông qua tư vấn, xây dựng và phát triển thương hiệu một cách có hệ thống, độc đáo và sáng tạo.
Song hành cùng thành công của khách hàng,
GLEAP đặt mục tiêu trở thành một trong 05 công ty hàng đầu về tư vấn thương hiệu và truyền thông tại Việt Nam năm 2020
Công ty TNHH GLEAP Việt Nam
Địa chỉ: B20, Lô 6, Khu Đô thị Định Công, Phường Định Công, Quận Hoàng Mai, Hà Nội
Điện thoại/ Fax: (+84)4.3640.0776
Email: contact@gleap.vn
Website: www.gleap.vn
UNDP Bratislava Regional Centre - Carbon Neutral Office
The UNDP Bratislava Regional Centre offset its 2011 greenhouse gas emissions of 707.8 tons of CO2e through the purchase of carbon credits totaling 5,325 USD. This made the Centre's net emissions for 2011 zero tons of CO2e. Air travel accounted for 76% of the Centre's emissions in 2011. Through energy savings and solar panels, the Centre offset its 2010 emissions of 623.4 tons of CO2e.
San Antonio Underage Drinking Data
Data presented at our Social Host Town Hall on March 22nd. Thank you to the Texas Alcoholic Beverage Commission, the San Antonio Police Department, and local schools and universities for contributing data to elaborate on the problem of underage drinking and social hosting in San Antonio.
2012 Academic Achievement Report
The data is used to guide continuous improvement efforts. Teachers and administrators carefully examine performance trends to identify strengths and needs at the student, classroom, school and district level. This informs targeted interventions, curriculum revisions, and instructional goal-setting to help all students succeed.
More Related Content
Viewers also liked
High level integrated security measures
Protection Strategies, Inc. is a consulting firm that assists clients with developing high-level integrated security plans to protect against natural and manmade threats. They help organizations secure physical facilities with trained security guards if needed, and protect critical data through operational security efforts. A truly integrated security plan also addresses training security personnel and testing their efficiency to ensure the organization is fully prepared for any situation.
Fit to sell
The document provides an overview of Fit To Sell membership sales training which includes 4 modules: why people buy, building rapport, needs analysis, and closing the sale. It discusses the psychological and emotional reasons why people purchase items and outlines 5 keys to influencing the buying process: addressing wants/needs, appealing to identity and values, compelling action, focusing on what is thought/felt, and desiring pleasure over pain. Effective sales techniques like asking influential questions, establishing rapport, identifying customer needs through questioning, and handling objections are also summarized.
Posicionar tu marca session 3
El documento habla sobre la importancia de tener presencia en la web para las empresas. Explica que es necesario ir más allá de las 4P y posicionarse en buscadores. También discute elementos clave para diseñar una web como contar una historia, ofrecer testimonios de clientes, mensajes orientados a la acción y diseño atractivo. El comercio electrónico u otras plataformas pueden usarse para vender productos en línea. Lo más importante es tener una web dinámica, coherente y con credibilidad.
The microstructure of the european sovereign bond market. Loriana Pellizzon. ...
This study analyzes the microstructure of the European sovereign bond market during the Eurozone crisis between 2011-2012. It finds that credit risk, as measured by CDS spreads, is non-linearly related to market liquidity, as higher credit risk leads to much greater illiquidity. Market makers temporarily stopped participating when CDS spreads widened significantly. ECB interventions successfully reduced solvency concerns and improved liquidity. The analysis uses a unique high-frequency dataset of order and trade data from the Italian sovereign bond market, the largest in the Eurozone, to examine changes in liquidity measures like bid-ask spreads and quote quantities around periods of financial stress.
New Testament Lesson 14
The document discusses the parable of the Good Samaritan from the Bible and how Christians should treat their neighbors with compassion. It encourages class members to forgive others, be charitable, and help those in need as the Good Samaritan did. A video is presented on the parable and President Howard W. Hunter is quoted teaching that believers should have no boundaries or narrow loyalties in showing love to their neighbors.
Presentation slides - Gigabit
Gigabit is a web application that aims to streamline the process of booking artists for concerts by allowing artists to advertise their availability and promoters to view artists' profiles and schedules. The document discusses research conducted with promoters, bands, and the public to determine pain points in the current booking process and interest in using a calendar-based system. It also outlines the prototype created, planned implementation strategy including alpha and beta testing, and project plan for the upcoming year.
Noticia de agosto
Un estudio encontró que los estudiantes que guardaron sus preguntas en una computadora podían recordar más fácilmente en qué carpeta estaban guardadas las preguntas que las propias preguntas. Esto sugiere que las personas están dependiendo más de las computadoras para almacenar conocimiento en lugar de memorizarlo internamente. Aunque las computadoras no reemplazarán la mente humana, parece que están cambiando la forma en que las personas almacenan información y aprenden.
Internal training - Human Resource Management
Internal Training is a crucial part for an organization. Here i discussed some important points regarding this process. It will help the org. to increase their productivity.
Líder Treinador #1
Disney anima a los lectores a perseguir sus sueños con valentía y determinación, asegurando que si tienen el coraje para hacerlo, pueden hacer que sus sueños se hagan realidad.
005 NCWRM 2011 Karamanos_AIA
Regional Conference on Advancing Non Conventional Water Resources Management in the Mediterranean, 14-15 September 2011, Athens, Greece
Images presentation
Madain Saleh is an archaeological site located in Saudi Arabia that contains well-preserved ruins and tombs from the Nabataean kingdom. The site includes tombs carved into sandstone cliffs, structures such as the Diwan where the Nabataeans conducted business and governance activities, and evidence of wind erosion shaping the landscape over centuries.
Packaging Examples
The document discusses the benefits of exercise for mental health. Regular physical activity can help reduce anxiety and depression and improve mood and cognitive functioning. Exercise causes chemical changes in the brain that may help protect against mental illness and improve symptoms.
Viewers also liked (17)
The microstructure of the european sovereign bond market. Loriana Pellizzon. ...
The microstructure of the european sovereign bond market. Loriana Pellizzon. ...
Similar to Book2 Copy
Annual Report 2012
This document appears to be an annual report from 2012 that includes:
1) A welcome from Kenichi Ishigaki and information about YAPC::Asia 2012.
2) Lists of the top 10 qualitative Japanese authors for 2012 and statistics on new CPAN authors in Japan and worldwide from 2000-2012.
3) Charts showing trends in the number of releases by Japanese authors, worldwide releases, active authors in Japan, and active authors worldwide from 2000-2012.
4) A thank you message at the end.
[Gleap] Agribank Report
GLEAP Việt Nam khởi nguồn là nhóm tư vấn độc lập hoạt động trong lĩnh vực truyền thông và công nghệ cao từ năm 2005.
Năm 2011, nhóm chính thức thành lập Công ty TNHH GLEAP Việt Nam, tiếp tục phát huy kinh nghiệm và thế mạnh trong các lĩnh vực tư vấn truyền thông, tư vấn thương hiệu, thiết kế sáng tạo và tổ chức sự kiện.
GLEAP tự tin hỗ trợ khách hàng:
Nâng cao giá trị doanh nghiệp thông qua tư vấn, xây dựng và phát triển thương hiệu một cách có hệ thống, độc đáo và sáng tạo.
Song hành cùng thành công của khách hàng,
GLEAP đặt mục tiêu trở thành một trong 05 công ty hàng đầu về tư vấn thương hiệu và truyền thông tại Việt Nam năm 2020
Công ty TNHH GLEAP Việt Nam
Địa chỉ: B20, Lô 6, Khu Đô thị Định Công, Phường Định Công, Quận Hoàng Mai, Hà Nội
Điện thoại/ Fax: (+84)4.3640.0776
Email: contact@gleap.vn
Website: www.gleap.vn
UNDP Bratislava Regional Centre - Carbon Neutral Office
The UNDP Bratislava Regional Centre offset its 2011 greenhouse gas emissions of 707.8 tons of CO2e through the purchase of carbon credits totaling 5,325 USD. This made the Centre's net emissions for 2011 zero tons of CO2e. Air travel accounted for 76% of the Centre's emissions in 2011. Through energy savings and solar panels, the Centre offset its 2010 emissions of 623.4 tons of CO2e.
San Antonio Underage Drinking Data
Data presented at our Social Host Town Hall on March 22nd. Thank you to the Texas Alcoholic Beverage Commission, the San Antonio Police Department, and local schools and universities for contributing data to elaborate on the problem of underage drinking and social hosting in San Antonio.
2012 Academic Achievement Report
The data is used to guide continuous improvement efforts. Teachers and administrators carefully examine performance trends to identify strengths and needs at the student, classroom, school and district level. This informs targeted interventions, curriculum revisions, and instructional goal-setting to help all students succeed.
広島大学平成18年環境報告書
This document profiles a university over several years. It includes statistics on enrollment numbers, degrees awarded, expenditures, admission rates, and more. Specifically, it shows that from 2001-2005 enrollment increased from around 300,000 to over 600,000 students. During this same period, degrees awarded also increased significantly from around 200,000 to over 400,000. Finally, the university's expenditures grew substantially from around $20 billion to over $80 billion.
Canada New England Cruise Symposium Cruise 101 Michael Crye
The cruise industry has evolved tremendously over the past few decades from converted ocean liners to a modern fleet of over 200 purpose-built cruise ships. The industry has grown from a small niche market to serving over 14 million passengers annually with an economic impact of over $40 billion in North America alone. Continuous innovation and adaptation have allowed the cruise industry to overcome challenges and achieve continued growth despite economic downturns.
Cne Cruise 101 Michael Crye
The document summarizes the evolution of the cruise industry over the past several decades. It notes that the industry has grown from a small boutique industry utilizing converted ocean liners to a $40 billion industry with over 200 purpose-built cruise ships. It highlights some of the major milestones and innovations that have occurred, such as the addition of new amenities on ships and efforts to improve environmental stewardship. Industry passenger numbers have grown significantly despite economic downturns and events like 9/11, with over 14 million passengers annually. The cruise industry has become a major economic driver and employer in North America and Europe.
2012 carolinas festival overall results
The document summarizes the results of a survey of festivals in North and South Carolina between 2008-2012. Key findings include: average festival attendance decreased from 2008 to 2012 while average festival length also decreased; total estimated number of festivals decreased from 853 in 2008 to 725 in 2012; average number of paid employees and volunteers fluctuated but generally decreased from 2008-2012 while average number of board members also decreased; and total estimated festival spending decreased from $42 million in 2008 to $21.6 million in 2012 while median festival budgets also decreased. The document also analyzes trends in areas like sponsorship, marketing budgets, revenues, vendors, attendance and ticket prices. Festival organizers generally overestimated revenues and underestimated expenses compared to actual results.
Social media
Korea's population grew steadily between 2007 and 2012, reaching over 50 million people according to government statistics. A market research firm projected that the population will surpass 60 million by 2020 due to increased life expectancy and immigration. Several charts and graphs showed population trends and forecasts over this period.
Presentation-Cyprus debt crisis
Presentation at Columbia University School of International Affairs, April 22, 2013. Full details of the event here https://www.facebook.com/events/249889465155114/
N screen trend in 2012
This document discusses trends in mobile devices and screens in Korea in 2012. It notes that:
- Smartphone usage in Korea was growing rapidly, with the market size reaching 2,000 billion won in 2011.
- Mobile traffic in Korea was increasingly dominated by apps and mobile web browsing over sites like Naver and Cyworld.
- Many services were aiming to work across multiple screens like smartphones, tablets, TVs and more in a seamless way using cloud technologies.
- Social TV and interacting with content on multiple connected devices was an emerging trend.
- Surveys found people increasingly using their mobile devices while watching TV or for activities like social media while viewing.
Similar to Book2 Copy (12)
UNDP Bratislava Regional Centre - Carbon Neutral Office
UNDP Bratislava Regional Centre - Carbon Neutral Office
Canada New England Cruise Symposium Cruise 101 Michael Crye
Canada New England Cruise Symposium Cruise 101 Michael Crye
Recently uploaded
Digital Artifact 1 - 10VCD Environments Unit
Digital Artifact 1 - 10VCD Environments Unit - NGV Pavilion Concept Design
The simplified electron and muon model, Oscillating Spacetime: The Foundation...
Discover the Simplified Electron and Muon Model: A New Wave-Based Approach to Understanding Particles delves into a groundbreaking theory that presents electrons and muons as rotating soliton waves within oscillating spacetime. Geared towards students, researchers, and science buffs, this book breaks down complex ideas into simple explanations. It covers topics such as electron waves, temporal dynamics, and the implications of this model on particle physics. With clear illustrations and easy-to-follow explanations, readers will gain a new outlook on the universe's fundamental nature.
বাংলাদেশ অর্থনৈতিক সমীক্ষা (Economic Review) ২০২৪ UJS App.pdf
বাংলাদেশের অর্থনৈতিক সমীক্ষা ২০২৪ [Bangladesh Economic Review 2024 Bangla.pdf] কম্পিউটার , ট্যাব ও স্মার্ট ফোন ভার্সন সহ সম্পূর্ণ বাংলা ই-বুক বা pdf বই " সুচিপত্র ...বুকমার্ক মেনু 🔖 ও হাইপার লিংক মেনু 📝👆 যুক্ত ..
আমাদের সবার জন্য খুব খুব গুরুত্বপূর্ণ একটি বই ..বিসিএস, ব্যাংক, ইউনিভার্সিটি ভর্তি ও যে কোন প্রতিযোগিতা মূলক পরীক্ষার জন্য এর খুব ইম্পরট্যান্ট একটি বিষয় ...তাছাড়া বাংলাদেশের সাম্প্রতিক যে কোন ডাটা বা তথ্য এই বইতে পাবেন ...
তাই একজন নাগরিক হিসাবে এই তথ্য গুলো আপনার জানা প্রয়োজন ...।
বিসিএস ও ব্যাংক এর লিখিত পরীক্ষা ...+এছাড়া মাধ্যমিক ও উচ্চমাধ্যমিকের স্টুডেন্টদের জন্য অনেক কাজে আসবে ...
Community pharmacy- Social and preventive pharmacy UNIT 5
Covered community pharmacy topic of the subject Social and preventive pharmacy for Diploma and Bachelor of pharmacy
Pollock and Snow "DEIA in the Scholarly Landscape, Session One: Setting Expec...
Pollock and Snow "DEIA in the Scholarly Landscape, Session One: Setting Expec...National Information Standards Organization (NISO)
This presentation was provided by Steph Pollock of The American Psychological Association’s Journals Program, and Damita Snow, of The American Society of Civil Engineers (ASCE), for the initial session of NISO's 2024 Training Series "DEIA in the Scholarly Landscape." Session One: 'Setting Expectations: a DEIA Primer,' was held June 6, 2024.ANATOMY AND BIOMECHANICS OF HIP JOINT.pdf
it describes the bony anatomy including the femoral head , acetabulum, labrum . also discusses the capsule , ligaments . muscle that act on the hip joint and the range of motion are outlined. factors affecting hip joint stability and weight transmission through the joint are summarized.
BÀI TẬP BỔ TRỢ TIẾNG ANH 8 CẢ NĂM - GLOBAL SUCCESS - NĂM HỌC 2023-2024 (CÓ FI...
BÀI TẬP BỔ TRỢ TIẾNG ANH 8 CẢ NĂM - GLOBAL SUCCESS - NĂM HỌC 2023-2024 (CÓ FI...Nguyen Thanh Tu Collection
https://app.box.com/s/y977uz6bpd3af4qsebv7r9b7s21935vdThe History of Stoke Newington Street Names
Presented at the Stoke Newington Literary Festival on 9th June 2024
www.StokeNewingtonHistory.com
Hindi varnamala | hindi alphabet PPT.pdf
हिंदी वर्णमाला पीपीटी, hindi alphabet PPT presentation, hindi varnamala PPT, Hindi Varnamala pdf, हिंदी स्वर, हिंदी व्यंजन, sikhiye hindi varnmala, dr. mulla adam ali, hindi language and literature, hindi alphabet with drawing, hindi alphabet pdf, hindi varnamala for childrens, hindi language, hindi varnamala practice for kids, https://www.drmullaadamali.com
Executive Directors Chat Leveraging AI for Diversity, Equity, and Inclusion
Let’s explore the intersection of technology and equity in the final session of our DEI series. Discover how AI tools, like ChatGPT, can be used to support and enhance your nonprofit's DEI initiatives. Participants will gain insights into practical AI applications and get tips for leveraging technology to advance their DEI goals.
Recently uploaded (20)
The simplified electron and muon model, Oscillating Spacetime: The Foundation...
The simplified electron and muon model, Oscillating Spacetime: The Foundation...
বাংলাদেশ অর্থনৈতিক সমীক্ষা (Economic Review) ২০২৪ UJS App.pdf
বাংলাদেশ অর্থনৈতিক সমীক্ষা (Economic Review) ২০২৪ UJS App.pdf
Community pharmacy- Social and preventive pharmacy UNIT 5
Community pharmacy- Social and preventive pharmacy UNIT 5
Pollock and Snow "DEIA in the Scholarly Landscape, Session One: Setting Expec...
Pollock and Snow "DEIA in the Scholarly Landscape, Session One: Setting Expec...
BÀI TẬP BỔ TRỢ TIẾNG ANH 8 CẢ NĂM - GLOBAL SUCCESS - NĂM HỌC 2023-2024 (CÓ FI...
BÀI TẬP BỔ TRỢ TIẾNG ANH 8 CẢ NĂM - GLOBAL SUCCESS - NĂM HỌC 2023-2024 (CÓ FI...
Pride Month Slides 2024 David Douglas School District
Pride Month Slides 2024 David Douglas School District
Film vocab for eal 3 students: Australia the movie
Film vocab for eal 3 students: Australia the movie
Executive Directors Chat Leveraging AI for Diversity, Equity, and Inclusion
Executive Directors Chat Leveraging AI for Diversity, Equity, and Inclusion
Liberal Approach to the Study of Indian Politics.pdf
Liberal Approach to the Study of Indian Politics.pdf
Book2 Copy
- 1. Total in number complaints over the years 250000 200000 231493 207449 206884 150000 100000 124509 50000 75063 49771 0 2001 2002 2003 2004 2005 2007 % of internet users to pop 0.8 0.7 0.6 0.688 0.681 0.702 0.5 0.58 0.592 0.4 0.5 0.3 0.2 0.1 0 2001 2002 2003 2004 2005 2007
- 2. 206884 2007 % Pop.