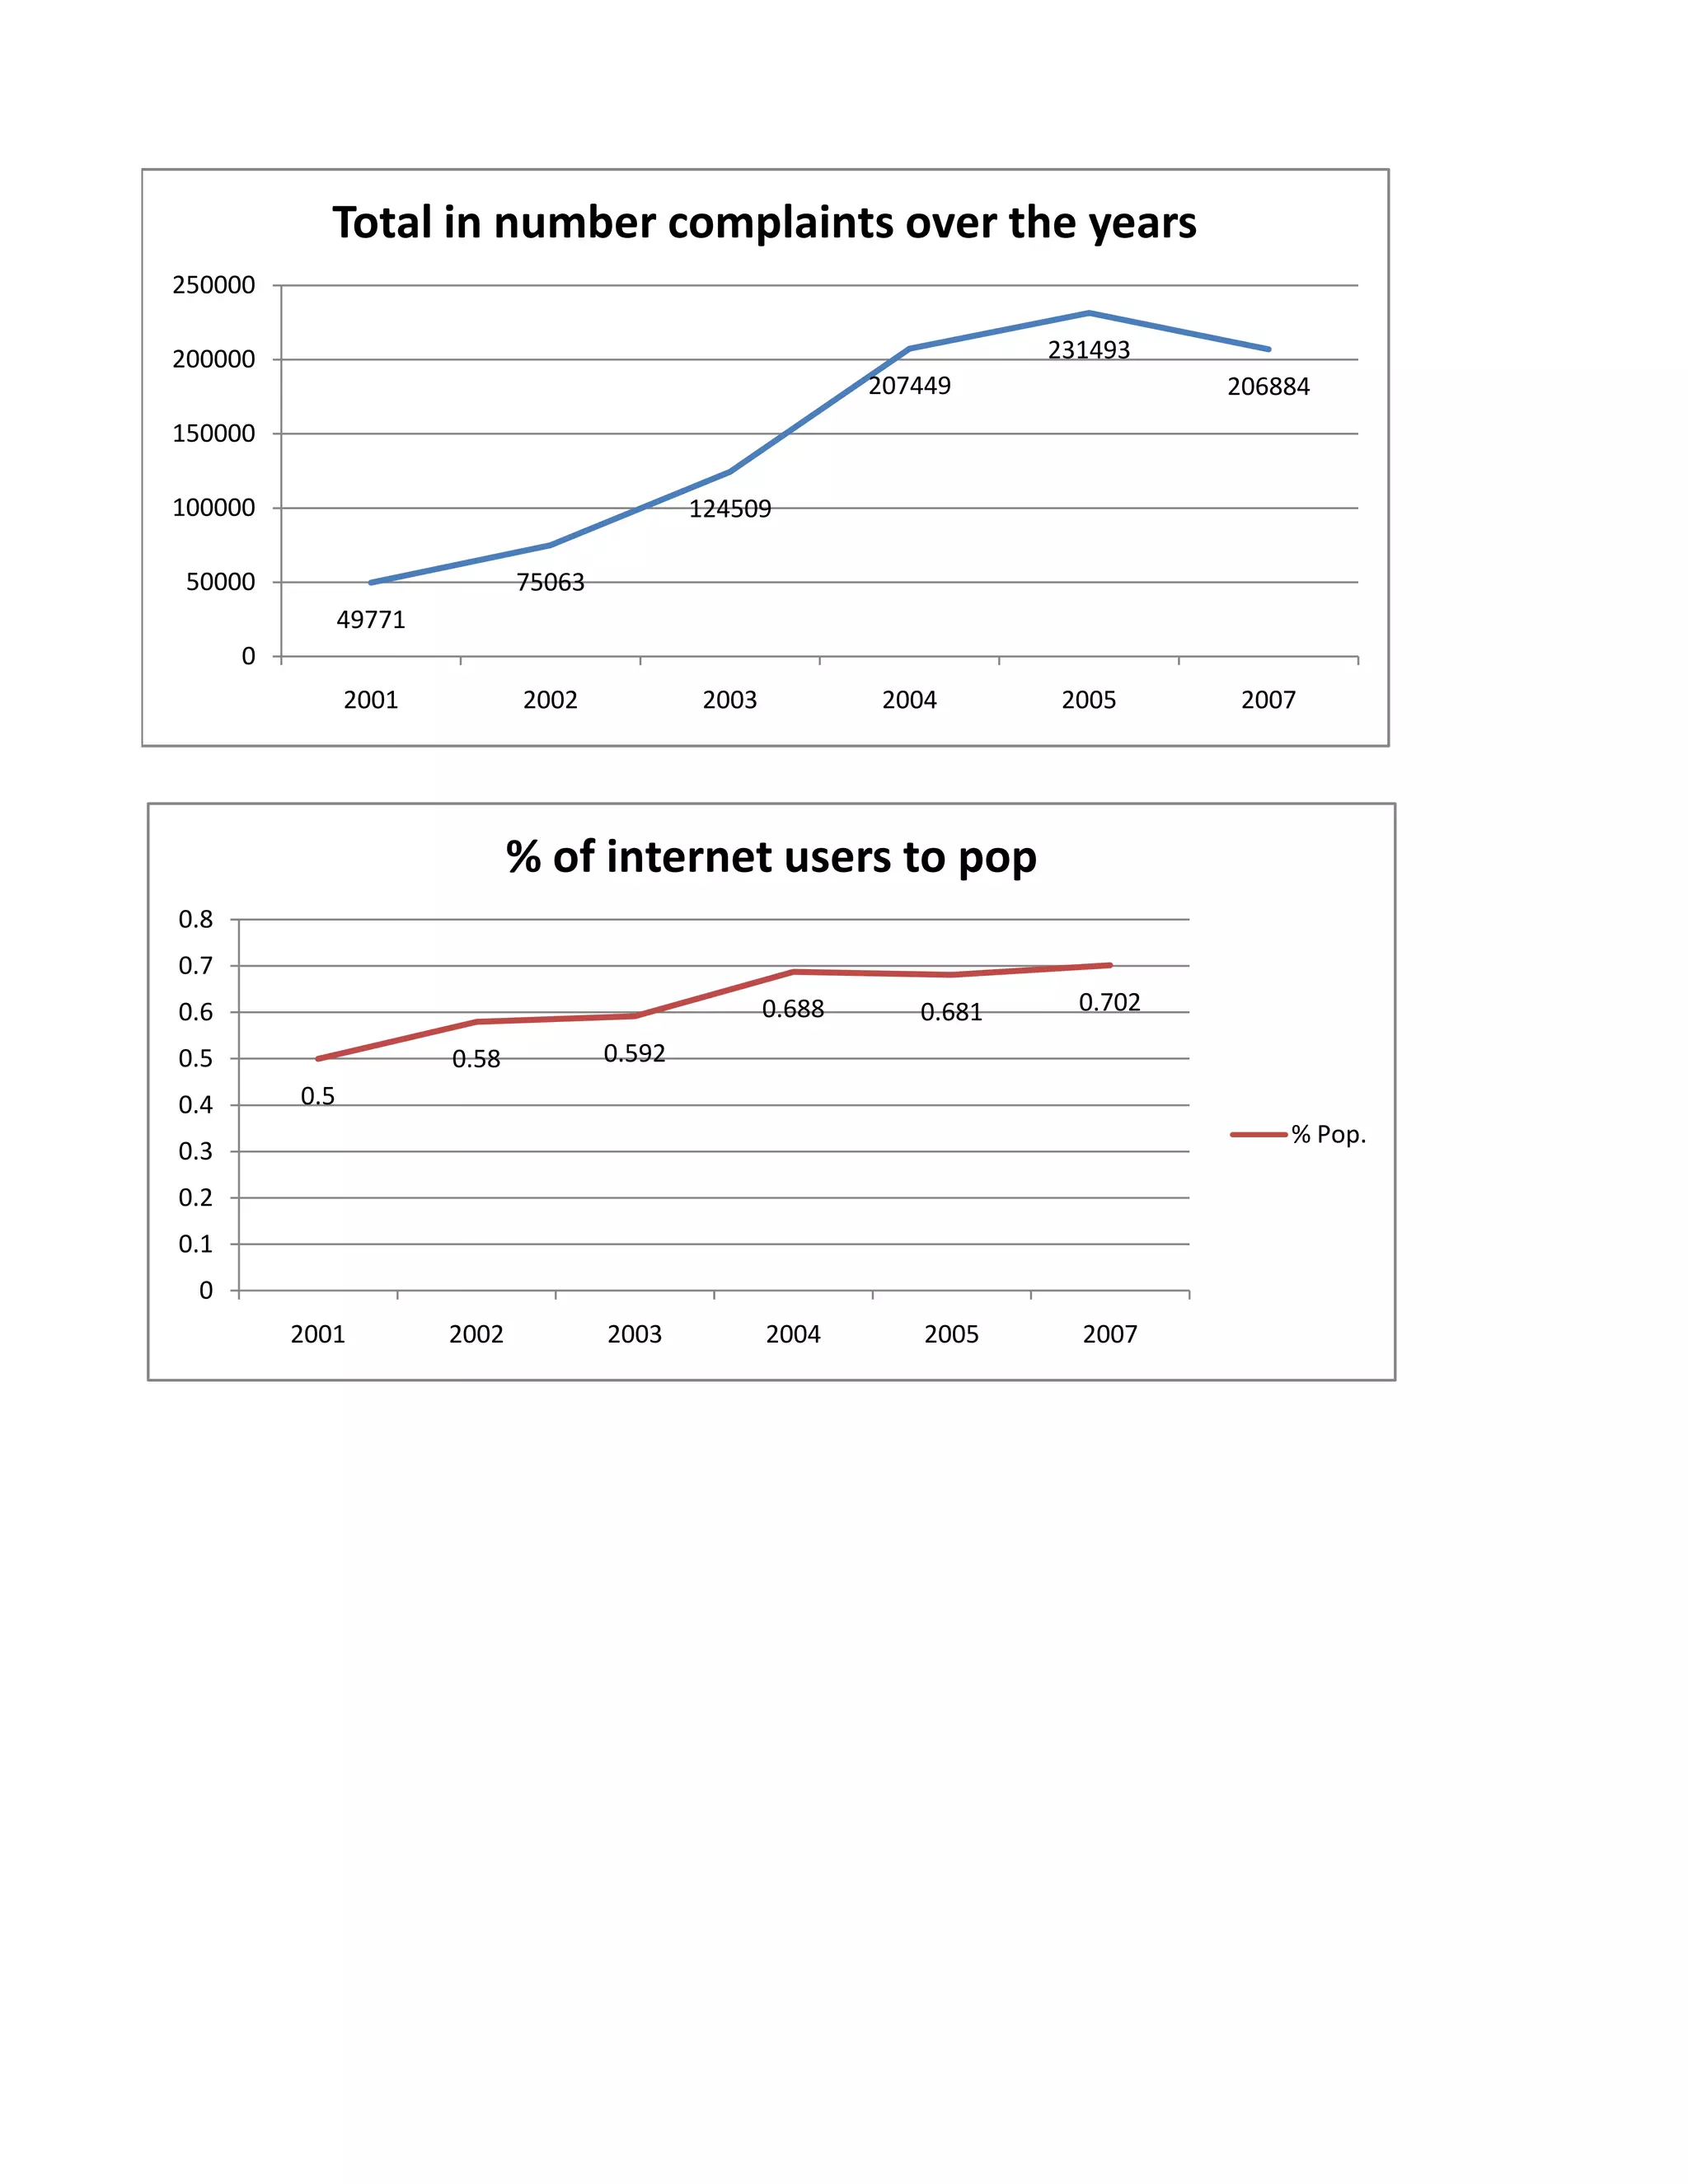
The document contains two line graphs. The first graph shows the total number of complaints over several years, ranging from around 50,000 in 2001 to over 230,000 in 2007. The second graph shows the percentage of internet users compared to the total population over the same years, ranging from 0.5% in 2001 to 0.7% in 2007.