2
Umbrex is thefastest way to find the right independent management consultant for your project.
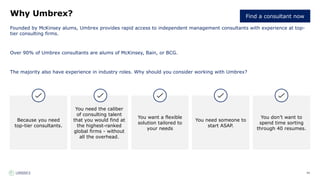
Our global community includes over 4,000 independent management consultants, all of whom have prior
experience at McKinsey, Bain, BCG, or another top firm.
To explore how we may be able to help you achieve your objectives, contact us at inquiry@umbrex.com
3.
3
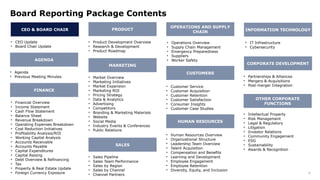
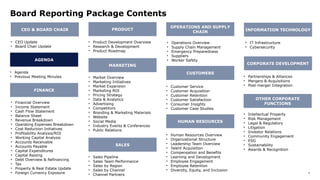
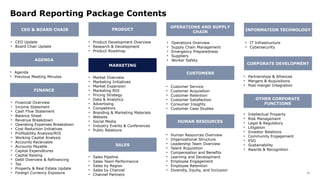
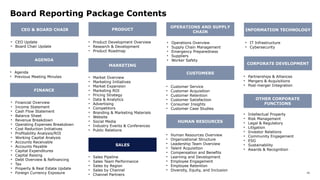
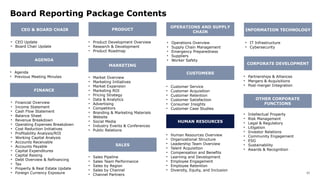
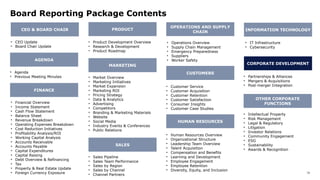
Board Reporting PackageContents
CEO & BOARD CHAIR
• CEO Update
• Board Chair Update
CORPORATE DEVELOPMENT
• Partnerships & Alliances
• Mergers & Acquisitions
• Post-merger Integration
OTHER CORPORATE
FUNCTIONS
• Intellectual Property
• Risk Management
• Legal & Regulatory
• Litigation
• Investor Relations
• Community Engagement
• ESG
• Sustainability
• Awards & Recognition
AGENDA
PRODUCT
MARKETING
• Financial Overview
• Income Statement
• Cash Flow Statement
• Balance Sheet
• Revenue Breakdown
• Operating Expenses Breakdown
• Cost Reduction Initiatives
• Profitability Analysis/ROI
• Working Capital Analysis
• Accounts Receivable
• Accounts Payable
• Capital Expenditures
• Capital Raising
• Debt Overview & Refinancing
• Tax
• Property & Real Estate Update
• Foreign Currency Exposure
• Product Development Overview
• Research & Development
• Product Roadmap
• Market Overview
• Marketing Initiatives
• Market Expansion
• Marketing ROI
• Pricing Strategy
• Data & Analytics
• Advertising
• Competitors
• Branding & Marketing Materials
• Website
• Social Media
• Industry Events & Conferences
• Public Relations
SALES
• Sales Pipeline
• Sales Team Performance
• Sales by Region
• Sales by Channel
• Channel Partners
CUSTOMERS
OPERATIONS AND SUPPLY
CHAIN INFORMATION TECHNOLOGY
HUMAN RESOURCES
• Operations Overview
• Supply Chain Management
• Emergency Preparedness
• Suppliers
• Worker Safety
• Customer Service
• Customer Acquisition
• Customer Retention
• Customer Satisfaction
• Consumer Insights
• Customer Case Studies
• IT Infrastructure
• Cybersecurity
• Human Resources Overview
• Organizational Structure
• Leadership Team Overview
• Talent Acquisition
• Compensation and Benefits
• Learning and Development
• Employee Engagement
• Employee Retention
• Diversity, Equity, and Inclusion
FINANCE
• Agenda
• Previous Meeting Minutes
4.
4
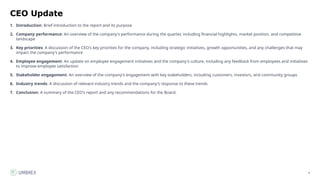
CEO Update
1. Introduction:Brief introduction to the report and its purpose
2. Company performance: An overview of the company's performance during the quarter, including financial highlights, market position, and competitive
landscape
3. Key priorities: A discussion of the CEO's key priorities for the company, including strategic initiatives, growth opportunities, and any challenges that may
impact the company's performance
4. Employee engagement: An update on employee engagement initiatives and the company's culture, including any feedback from employees and initiatives
to improve employee satisfaction
5. Stakeholder engagement: An overview of the company's engagement with key stakeholders, including customers, investors, and community groups
6. Industry trends: A discussion of relevant industry trends and the company's response to these trends
7. Conclusion: A summary of the CEO's report and any recommendations for the Board.
5.
5
Board Chair Update
1.Introduction: Overview of Board of Directors meetings held during the quarter, including dates, attendees, and agenda items.
2. Key decisions: Summary of any key decisions made by the Board of Directors during the quarter, such as changes to corporate strategy or significant
investments.
3. Actions: Overview of any actions taken by the Board of Directors during the quarter, such as the appointment of new members or the approval of financial
statements.
4. Key initiatives: Update on any key initiatives or projects assigned to the Board of Directors during the quarter, including progress and timelines.
5. Meetings: Discussion of any upcoming meetings or events related to the Board of Directors, including dates and agenda items.
6. Committee members: A list of committee members, along with their titles and any relevant expertise. This can help provide context for the committee's
work and give the Board a sense of the individuals driving key initiatives within the organization.
7. Committee activities: A summary of the activities undertaken by each committee during the quarter would be included. This could include a list of topics
discussed, initiatives undertaken, and any progress made towards achieving committee goals.
8. Committee recommendations: The committee's recommendations to the Board would be highlighted, along with any proposed action items or next steps.
This could include recommendations related to governance, risk management, strategic planning, or other areas relevant to the committee's mandate.
9. Shareholder update: Overview of the company's shareholder base, including any changes to the number or composition of shareholders during the
quarter. It should include a summary of any shareholder proposals or initiatives raised during the quarter, including the status of each proposal or initiative
and any recommended actions by management or the Board.
10.Investor relations: An update on the company's investor relations activities, including any investor conferences or meetings attended by management or
the IR team. Include a summary of any key investor feedback or concerns gathered during the quarter, including any actions taken by management or the
Board in response to this feedback or concerns.
11.Dividends: An update on the company's dividend policy, including any changes made during the quarter and any upcoming dividend payments.
12.Additional information: Any other relevant information or updates related to the Board of Directors.
6.
6
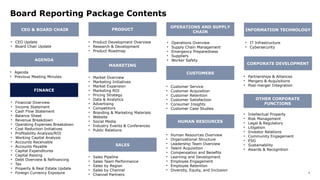
Board Reporting PackageContents
CEO & BOARD CHAIR
• CEO Update
• Board Chair Update
CORPORATE DEVELOPMENT
• Partnerships & Alliances
• Mergers & Acquisitions
• Post-merger Integration
OTHER CORPORATE
FUNCTIONS
• Intellectual Property
• Risk Management
• Legal & Regulatory
• Litigation
• Investor Relations
• Community Engagement
• ESG
• Sustainability
• Awards & Recognition
AGENDA
PRODUCT
MARKETING
• Financial Overview
• Income Statement
• Cash Flow Statement
• Balance Sheet
• Revenue Breakdown
• Operating Expenses Breakdown
• Cost Reduction Initiatives
• Profitability Analysis/ROI
• Working Capital Analysis
• Accounts Receivable
• Accounts Payable
• Capital Expenditures
• Capital Raising
• Debt Overview & Refinancing
• Tax
• Property & Real Estate Update
• Foreign Currency Exposure
• Product Development Overview
• Research & Development
• Product Roadmap
• Market Overview
• Marketing Initiatives
• Market Expansion
• Marketing ROI
• Pricing Strategy
• Data & Analytics
• Advertising
• Competitors
• Branding & Marketing Materials
• Website
• Social Media
• Industry Events & Conferences
• Public Relations
SALES
• Sales Pipeline
• Sales Team Performance
• Sales by Region
• Sales by Channel
• Channel Partners
CUSTOMERS
OPERATIONS AND SUPPLY
CHAIN INFORMATION TECHNOLOGY
HUMAN RESOURCES
• Operations Overview
• Supply Chain Management
• Emergency Preparedness
• Suppliers
• Worker Safety
• Customer Service
• Customer Acquisition
• Customer Retention
• Customer Satisfaction
• Consumer Insights
• Customer Case Studies
• IT Infrastructure
• Cybersecurity
• Human Resources Overview
• Organizational Structure
• Leadership Team Overview
• Talent Acquisition
• Compensation and Benefits
• Learning and Development
• Employee Engagement
• Employee Retention
• Diversity, Equity, and Inclusion
FINANCE
• Agenda
• Previous Meeting Minutes
7.
7
Agenda
1. Opening Remarks
2.Welcome and introductions
3. Brief overview of the purpose of the meeting
4. Any important announcements or general updates
5. Topics for discussion
6. Approval items
7. Other strategic conversations in which the board should participate
8.
8
Previous Meeting Minutes
1.Review: Recap of the key discussion points and decisions made during the previous board meeting.
2. Amend: Confirmation or amendment of the minutes from the previous meeting, if necessary.
3. Initiatives: Review any important initiatives that might be revisited in the upcoming meeting.
9.
9
Board Reporting PackageContents
CEO & BOARD CHAIR
• CEO Update
• Board Chair Update
CORPORATE DEVELOPMENT
• Partnerships & Alliances
• Mergers & Acquisitions
• Post-merger Integration
OTHER CORPORATE
FUNCTIONS
• Intellectual Property
• Risk Management
• Legal & Regulatory
• Litigation
• Investor Relations
• Community Engagement
• ESG
• Sustainability
• Awards & Recognition
AGENDA
PRODUCT
MARKETING
• Financial Overview
• Income Statement
• Cash Flow Statement
• Balance Sheet
• Revenue Breakdown
• Operating Expenses Breakdown
• Cost Reduction Initiatives
• Profitability Analysis/ROI
• Working Capital Analysis
• Accounts Receivable
• Accounts Payable
• Capital Expenditures
• Capital Raising
• Debt Overview & Refinancing
• Tax
• Property & Real Estate Update
• Foreign Currency Exposure
• Product Development Overview
• Research & Development
• Product Roadmap
• Market Overview
• Marketing Initiatives
• Market Expansion
• Marketing ROI
• Pricing Strategy
• Data & Analytics
• Advertising
• Competitors
• Branding & Marketing Materials
• Website
• Social Media
• Industry Events & Conferences
• Public Relations
SALES
• Sales Pipeline
• Sales Team Performance
• Sales by Region
• Sales by Channel
• Channel Partners
CUSTOMERS
OPERATIONS AND SUPPLY
CHAIN INFORMATION TECHNOLOGY
HUMAN RESOURCES
• Operations Overview
• Supply Chain Management
• Emergency Preparedness
• Suppliers
• Worker Safety
• Customer Service
• Customer Acquisition
• Customer Retention
• Customer Satisfaction
• Consumer Insights
• Customer Case Studies
• IT Infrastructure
• Cybersecurity
• Human Resources Overview
• Organizational Structure
• Leadership Team Overview
• Talent Acquisition
• Compensation and Benefits
• Learning and Development
• Employee Engagement
• Employee Retention
• Diversity, Equity, and Inclusion
FINANCE
• Agenda
• Previous Meeting Minutes
10.
10
Financial Overview
1. Introduction:A summary of the company's financial performance during the quarter in a table or graph format.
2. Revenue: A breakdown of revenue by product line or business segment, and the percentage change from the previous quarter and the same quarter last
year. It should also include a comparison of actual revenue to the forecasted revenue for the quarter.
3. Gross profit: A breakdown of gross profit by product line or business segment, and the percentage change from the previous quarter and the same quarter
last year. It should also include a comparison of actual gross profit to the forecasted gross profit for the quarter.
4. Operating expenses: A breakdown of operating expenses (e.g. salaries, rent, marketing expenses, etc.) and the percentage change from the previous
quarter and the same quarter last year. It should also include a comparison of actual operating expenses to the forecasted operating expenses for the
quarter.
5. EBITDA: The company's Earnings Before Interest, Taxes, Depreciation, and Amortization (EBITDA) for the quarter, including the percentage change from the
previous quarter and the same quarter last year. It should also include a comparison of actual EBITDA to the forecasted EBITDA for the quarter.
6. Net income: The company's net income for the quarter, including the percentage change from the previous quarter and the same quarter last year. It should
also include a comparison of actual net income to the forecasted net income for the quarter.
7. Cash flow: A summary of the company's cash flow during the quarter, including operating, investing, and financing activities. It should also include a
comparison of actual cash flow to the forecasted cash flow for the quarter.
8. Balance sheet: A snapshot of the company's balance sheet at the end of the quarter, including assets, liabilities, and equity. It should also include a
comparison of actual balance sheet to the forecasted balance sheet for the quarter.
9. Key financial ratios: A summary of key financial ratios (e.g. current ratio, debt-to-equity ratio, return on investment, etc.) and the percentage change from
the previous quarter and the same quarter last year. It should also include a comparison of actual financial ratios to the forecasted financial ratios for the
quarter.
10.Conclusion: A brief summary of the company's financial performance during the quarter, including any noteworthy achievements or concerns, and the
outlook for the next quarter.
11.
11
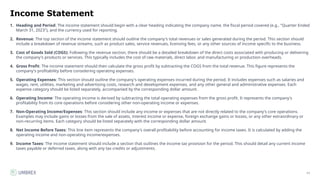
Income Statement
1. Headingand Period: The income statement should begin with a clear heading indicating the company name, the fiscal period covered (e.g., "Quarter Ended
March 31, 2023"), and the currency used for reporting.
2. Revenue: The top section of the income statement should outline the company's total revenues or sales generated during the period. This section should
include a breakdown of revenue streams, such as product sales, service revenues, licensing fees, or any other sources of income specific to the business.
3. Cost of Goods Sold (COGS): Following the revenue section, there should be a detailed breakdown of the direct costs associated with producing or delivering
the company's products or services. This typically includes the cost of raw materials, direct labor, and manufacturing or production overheads.
4. Gross Profit: The income statement should then calculate the gross profit by subtracting the COGS from the total revenue. This figure represents the
company's profitability before considering operating expenses.
5. Operating Expenses: This section should outline the company's operating expenses incurred during the period. It includes expenses such as salaries and
wages, rent, utilities, marketing and advertising costs, research and development expenses, and any other general and administrative expenses. Each
expense category should be listed separately, accompanied by the corresponding dollar amount.
6. Operating Income: The operating income is derived by subtracting the total operating expenses from the gross profit. It represents the company's
profitability from its core operations before considering other non-operating income or expenses.
7. Non-Operating Income/Expenses: This section should include any income or expenses that are not directly related to the company's core operations.
Examples may include gains or losses from the sale of assets, interest income or expense, foreign exchange gains or losses, or any other extraordinary or
non-recurring items. Each category should be listed separately with the corresponding dollar amount.
8. Net Income Before Taxes: This line item represents the company's overall profitability before accounting for income taxes. It is calculated by adding the
operating income and non-operating income/expenses.
9. Income Taxes: The income statement should include a section that outlines the income tax provision for the period. This should detail any current income
taxes payable or deferred taxes, along with any tax credits or adjustments.
12.
12
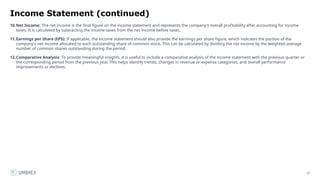
Income Statement (continued)
10.NetIncome: The net income is the final figure on the income statement and represents the company's overall profitability after accounting for income
taxes. It is calculated by subtracting the income taxes from the net income before taxes.
11.Earnings per Share (EPS): If applicable, the income statement should also provide the earnings per share figure, which indicates the portion of the
company's net income allocated to each outstanding share of common stock. This can be calculated by dividing the net income by the weighted average
number of common shares outstanding during the period.
12.Comparative Analysis: To provide meaningful insights, it is useful to include a comparative analysis of the income statement with the previous quarter or
the corresponding period from the previous year. This helps identify trends, changes in revenue or expense categories, and overall performance
improvements or declines.
13.
13
Cash Flow Statement
1.Introduction: A statement of cash flows for the quarter showing the cash inflows and outflows from operating, investing, and financing activities.
2. Cash inflows: A breakdown of the forecasted cash inflows for each week, including any major sources of revenue or funding. This could include sales
revenue, accounts receivable collections, loan proceeds, or investment income, among others.
3. Cash outflows: A breakdown of the forecasted cash outflows for each week, including any major categories of expenses. This could include payroll, rent,
utilities, taxes, loan repayments, or other operating expenses, among others.
4. Investing cash flow: A breakdown of the investing cash flow for the quarter, showing the net cash flow from investing activities and a summary of the
significant investing activities during the quarter.
5. Financing cash flow: A breakdown of the financing cash flow for the quarter, showing the net cash flow from financing activities and a summary of the
significant financing activities during the quarter.
6. Forecast summary: A summary of the forecasted cash inflows and outflows, with total forecasted net cash flow for each week and for the entire period.
7. Cash and cash equivalents: An analysis of the changes in cash and cash equivalents during the quarter, including the beginning and ending balances, and
any significant changes or events that impacted the cash position.
8. Graphical representation: A graphical representation of the cash flow statement, such as a bar chart or pie chart, to make it easier to visualize the sources
and uses of cash during the quarter.
9. Key drivers of cash flow improvement or decline: An analysis of the key drivers of cash flow improvement or decline, such as changes in revenue,
expenses, or capital expenditures.
10.Variance analysis: An analysis of any significant variances between the forecasted cash flows and the actual results for the prior period.
11.Sensitivity analysis: An analysis of the potential impact of different scenarios or assumptions on the cash flow forecast, to help identify potential risks and
opportunities.
12.Trend analysis: A comparison of the cash flow trends over the previous quarters or years, highlighting any changes or trends.
13.Conclusion: A brief summary of the company's cash flow performance during the quarter, including any noteworthy achievements or concerns, and the
outlook for the next quarter.
14.
14
Balance Sheet
1. Introduction:A balance sheet for the quarter showing the company's assets, liabilities, and equity at the end of the quarter.
2. Asset analysis: A breakdown of the company's assets, including current assets and long-term assets, such as cash and cash equivalents, accounts
receivable, inventory, property, plant, and equipment, and intangible assets.
3. Liability analysis: A breakdown of the company's liabilities, including current liabilities and long-term liabilities, such as accounts payable, accrued
expenses, notes payable, and long-term debt.
4. Equity analysis: A breakdown of the company's equity, including common stock, retained earnings, and other comprehensive income.
5. Graphical representation: A graphical representation of the balance sheet, such as a stacked bar chart or pie chart, to make it easier to visualize the
composition of the assets, liabilities, and equity.
6. Key drivers of balance sheet changes: An analysis of the key drivers of changes in the balance sheet, such as changes in revenue, expenses, capital
expenditures, or financing activities.
7. Trend analysis: A comparison of the balance sheet trends over the previous quarters or years, highlighting any changes or trends.
8. Liquidity analysis: An analysis of the company's liquidity position, including the current ratio and quick ratio, and any significant changes or events that
impacted the liquidity position.
9. Conclusion: A brief summary of the company's balance sheet performance during the quarter, including any noteworthy achievements or concerns, and the
outlook for the next quarter.
15.
15
Revenue Breakdown
1. Introduction:A summary of the company's revenue performance during the quarter in a table or graph format.
2. Revenue breakdown: A breakdown of revenue by product, service, or customer segment. This should include the percentage contribution of each segment
to the overall revenue for the quarter, as well as a comparison of actual revenue to the forecasted revenue for each segment.
3. Graphical representation: A graphical representation of the revenue breakdown, such as a pie chart or bar chart, to make it easier to visualize the
contribution of each segment to the overall revenue.
4. Key drivers of revenue growth or decline: An analysis of the key drivers of revenue growth or decline for each segment. This could include factors such as
changes in market demand, pricing, competition, and product/service innovation.
5. Key customers: A breakdown of revenue by key customers or customer groups, and the percentage change from the previous quarter and the same quarter
last year. It should also include a comparison of actual revenue to the forecasted revenue for each key customer or customer group.
6. Sales channels: A breakdown of revenue by sales channels (e.g. direct sales, online sales, resellers, etc.) and the percentage change from the previous
quarter and the same quarter last year. It should also include a comparison of actual revenue to the forecasted revenue for each sales channel.
7. Conclusion: A brief summary of the company's revenue performance during the quarter, including any noteworthy achievements or concerns, and the
outlook for the next quarter.
16.
16
Operating Expenses Breakdown
1.Introduction: A summary of the company's operating expenses performance during the quarter in a table or graph format.
2. Operating expenses breakdown: A breakdown of operating expenses, including salaries, marketing, and other expenses. This should include the
percentage contribution of each category to the overall operating expenses for the quarter, as well as a comparison of actual operating expenses to the
forecasted operating expenses for each category.
3. Graphical representation: A graphical representation of the operating expenses breakdown, such as a pie chart or bar chart, to make it easier to visualize
the contribution of each category to the overall operating expenses.
4. Key drivers of operating expenses growth or reduction: An analysis of the key drivers of operating expenses growth or reduction for each category. This
could include factors such as changes in headcount, salary, marketing spend, or other costs related to the business operations.
5. Trend analysis: A comparison of the operating expenses trends for each category over the previous quarters or years, highlighting any changes or trends.
6. Efficiency metrics: Metrics that show the company's efficiency in managing its operating expenses, such as operating expenses as a percentage of revenue,
or operating expenses per employee.
7. Conclusion: A brief summary of the company's operating expenses performance during the quarter, including any noteworthy achievements or concerns,
and the outlook for the next quarter.
17.
17
Cost Reduction Initiatives
1.Introduction: A brief overview of the company's financial performance during the quarter, highlighting any areas where costs have been a concern.
2. Description of cost reduction initiatives: A list of the cost reduction initiatives implemented during the quarter, including details on what each initiative
involved and the expected savings. This section may also include any challenges faced in implementing the initiatives.
3. Savings achieved: An overview of the savings achieved through the cost reduction initiatives, including both absolute dollar savings and as a percentage of
total costs.
4. Future plans: A discussion of any further cost reduction initiatives planned for the future, along with a timeline for implementation and expected savings.
5. Conclusion: A summary of the cost reduction initiatives and their impact on the company's financial performance, along with any key takeaways for the
board.
18.
18
Profitability Analysis/ROI
1. Introduction:A summary of the company's profitability performance during the quarter, including the return on investment (ROI) percentage and an
analysis of the trend compared to previous quarters or years.
2. Net income margin analysis: An analysis of the net income margin for the quarter, including a breakdown of revenue, cost of goods sold, and operating
expenses. This should include a comparison of the net income margin to the forecasted net income margin.
3. Gross margin breakdown: A breakdown of gross margin by product, service, or customer segment. This should include the percentage contribution of each
segment to the overall gross margin for the quarter, as well as a comparison of actual gross margin to the forecasted gross margin for each segment.
4. Key drivers of gross margin improvement or decline: An analysis of the key drivers of gross margin improvement or decline for each segment. This could
include factors such as changes in cost of goods sold, pricing, mix of products/services sold, and changes in customer demand.
5. Gross margin trends: A comparison of the gross margin trends for each segment over the previous quarters or years, highlighting any changes or trends.
6. Return on assets analysis: An analysis of the return on assets for the quarter, including a breakdown of net income and total assets. This should include a
comparison of the return on assets to the forecasted return on assets.
7. Graphical representation: A graphical representation of the net income margin and return on assets analysis, such as a line chart or bar chart.
8. Key drivers of profitability improvement or decline: An analysis of the key drivers of profitability improvement or decline, such as changes in revenue mix,
pricing, cost structure, or operational efficiencies.
9. Trend analysis: A comparison of the profitability trends over the previous quarters or years, highlighting any changes or trends.
10.Industry benchmarking: A comparison of the company's profitability performance to the industry benchmarks or peers, if available.
11.ROI breakdown: A breakdown of the ROI by product, service, or customer segment, and an analysis of the trend compared to previous quarters or years,
with an analysis of the factors contributing to the ROI for each product, service, or customer segment, including sales volume, pricing, cost of goods sold,
and operating expenses.
12.ROI improvement plan: An analysis of the areas where the company can improve the ROI for each product, service, or customer segment, and a plan for
addressing those areas.
13.Conclusion: A brief summary of the company's ROI during the quarter, including any noteworthy achievements or concerns, and the outlook for the next
19.
19
Working Capital Analysis
1.Introduction: An analysis of working capital for the quarter, including the calculation and interpretation of key metrics such as inventory turnover, days sales
outstanding (DSO), and days payable outstanding (DPO).
2. Inventory turnover: A calculation of inventory turnover, showing the number of times inventory is sold and replaced during the quarter, and an analysis of
the trend compared to previous quarters or years.
3. Days sales outstanding: A calculation of days sales outstanding (DSO), showing the average number of days it takes to collect payment from customers,
and an analysis of the trend compared to previous quarters or years.
4. Days payable outstanding: A calculation of days payable outstanding (DPO), showing the average number of days it takes to pay suppliers, and an analysis
of the trend compared to previous quarters or years.
5. Working capital cycle: An analysis of the company's working capital cycle, showing the time it takes to convert inventory into sales and collect payment
from customers, and the time it takes to pay suppliers.
6. Graphical representation: A graphical representation of the working capital metrics, such as a line graph or bar chart, to make it easier to visualize the
trends and changes over time.
7. Key drivers of working capital changes: An analysis of the key drivers of changes in working capital, such as changes in sales volume, pricing, inventory
levels, or payment terms.
8. Benchmarking: A comparison of the working capital metrics to industry benchmarks or peer companies, highlighting any areas of strength or weakness.
9. Conclusion: A brief summary of the company's working capital performance during the quarter, including any noteworthy achievements or concerns, and
the outlook for the next quarter.
20.
20
Accounts Receivable
1. Summaryof accounts receivable status: An overview of the company's accounts receivable status during the quarter, including the total amount
outstanding and any changes from the previous quarter.
2. Aging report: An aging report of accounts receivable, showing the length of time outstanding for each invoice and the total amount overdue. This report
would likely be broken down into categories based on the age of the invoice (e.g., 0-30 days, 31-60 days, 61-90 days, over 90 days).
3. Collection efforts: An overview of the company's efforts to collect outstanding accounts receivable during the quarter, including any changes to the
collections process or policies.
4. Bad debt expense: Any bad debt expense recognized during the quarter, including the total amount and any changes from the previous quarter.
5. Conclusion: A summary of the overall accounts receivable status, including any challenges faced and plans for improving collections in the future.
21.
21
Accounts Payable
1. Summaryof accounts payable status: An overview of the company's accounts payable balance at the end of the quarter
2. Aging report: An aging report of accounts payable, showing the amount and age of outstanding payables
3. Payment terms: An update on any changes to the company's payment terms with suppliers or vendors during the quarter
4. Invoicing: Information on the company's approach to paying invoices, including whether it is taking advantage of early payment discounts or delaying
payment to maximize net working capital
5. Issues or disputes: Any significant issues related to accounts payable, such as disputes or delays in payment, and how these are being addressed.
22.
22
Capital Expenditures
1. Introduction:A summary of the company's capital expenditures during the quarter including the total amount of capital expenditures and an analysis of
the trend compared to previous quarters or years.
2. Capital expenditures breakdown: A breakdown of the company's capital expenditures by category, such as property, plant, and equipment (PP&E),
research and development (R&D), and acquisitions, and an analysis of the trend compared to previous quarters or years.
3. Purpose: A description of the purpose of each category of capital expenditures and how they align with the company's strategic objectives.
4. ROI analysis: An analysis of the return on investment (ROI) for each category of capital expenditures, including the expected ROI, actual ROI, and an
explanation of any significant variances.
5. Graphical representation: A graphical representation of the company's capital expenditures, such as a bar chart or stacked area chart, to make it easier to
visualize the breakdown and trends over time.
6. Capex budget: An analysis of the company's capital expenditures budget for the next quarter or year, including any changes to the budget from the
previous quarter or year.
7. Conclusion: A brief summary of the company's capital expenditures during the quarter, including any noteworthy achievements or concerns, and the
outlook for the next quarter.
23.
23
Capital Raising
1. Totalamount of capital raised: The slide should provide a clear breakdown of the total amount of capital raised during the quarter, including any details on
whether the capital was raised through debt or equity financing.
2. Purpose of the capital raising: The slide should also explain the purpose behind the capital raising. This could include expanding the company's
operations, funding new projects, or paying off existing debts.
3. Investor information: The slide may also provide some information about the investors who participated in the capital raising. This could include the
names of any major investors, the amount invested by each investor, and any notable trends in investor participation.
4. Use of proceeds: The slide should also provide details on how the proceeds from the capital raising will be used. This could include a breakdown of the
specific projects or initiatives that will be funded by the capital, and any timelines associated with these projects.
5. Future plans: Finally, the slide may touch on the company's future plans for raising capital. This could include information on any upcoming capital raising
activities, or plans for future debt or equity financing.
24.
24
Debt Overview &Refinancing
1. Introduction: A summary of the company's debt position for the quarter including total debt, interest rate, and maturity.
2. Total debt: The total amount of debt outstanding during the quarter, including both short- and long-term debt, and an analysis of the trend compared to
previous quarters or years.
3. Debt breakdown: A breakdown of the company's debt by type, such as bank loans, bonds, or convertible debt, and an analysis of the trend compared to
previous quarters or years.
4. Interest rate: The weighted average interest rate of the company's debt during the quarter, and an analysis of the trend compared to previous quarters or
years.
5. Maturity: The maturity profile of the company's debt, showing the amount of debt due within the next year, within 1-3 years, within 3-5 years, and beyond 5
years, and an analysis of the trend compared to previous quarters or years.
6. Debt covenants: A summary of the debt covenants associated with the company's debt, including any financial or operational covenants, and the
company's compliance status.
7. Graphical representation: A graphical representation of the company's debt profile, such as a pie chart or stacked bar chart, to visualize the breakdown and
trends over time.
8. Debt service coverage: An analysis of the company's ability to service its debt, including debt service coverage ratios and interest coverage ratios, and an
analysis of the trend compared to previous quarters or years.
9. Overview of debt refinancing activities: The presentation would provide an overview of any debt refinancing activities that occurred during the quarter.
This would include details such as the types of debt refinanced, the reasons for the refinancing, and any benefits or drawbacks associated with the
refinancing.
10.Changes to interest rates or terms: The presentation would outline any changes made to interest rates or terms as part of the refinancing. This could
include details such as new interest rates, repayment terms, and any associated fees or costs.
11.Impact on financial performance: The presentation would discuss the impact of the debt refinancing on the company's financial performance. This could
include details such as the impact on interest expenses, debt ratios, and any changes to credit ratings.
12.Future debt refinancing plans: The presentation could include information about any future debt refinancing plans the company may have. This would
25.
25
Tax
1. Summary ofany changes to tax laws or regulations: The slide should summarize any changes to tax laws or regulations that may impact the company's
tax liability or reporting obligations.
2. Analysis of tax implications: The slide should provide an analysis of the impact of the changes on the company's financials, such as any changes to the
effective tax rate or deferred tax assets and liabilities.
3. Mitigation strategies: The slide should discuss any strategies the company has implemented or plans to implement to mitigate the impact of the changes,
such as adjusting transfer pricing policies or restructuring operations.
4. Future tax planning: The slide should also provide an overview of the company's future tax planning, including any opportunities for tax optimization or
risk management.
26.
26
Property & RealEstate Update
1. Overview of any real estate acquisitions, leases, or sales made during the quarter, including the locations and size of the properties.
2. Summary of the company's existing real estate portfolio, including the number and types of properties, their locations, and any notable developments or
renovations.
3. Discussion of any challenges or opportunities related to the company's real estate portfolio, such as changes in market conditions or upcoming lease
expirations.
4. Key metrics related to the company's real estate performance, such as occupancy rates, rental rates, and overall profitability of the portfolio.
5. Any future plans for real estate acquisitions, leases, or sales, along with the company's strategy for managing its real estate portfolio going forward.
27.
27
Foreign Currency Exposure
1.A summary of the company's exposure to foreign currency risks, including countries and currencies involved.
2. An analysis of the potential impact of foreign currency fluctuations on the company's financial statements.
3. A review of the company's current hedging strategies, including any changes made during the quarter.
4. An evaluation of the effectiveness of the company's hedging strategies in mitigating foreign currency risks.
5. A discussion of any potential future changes to the company's hedging strategies in response to market conditions.
28.
28
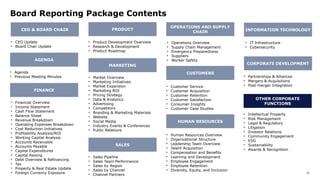
Board Reporting PackageContents
CEO & BOARD CHAIR
• CEO Update
• Board Chair Update
CORPORATE DEVELOPMENT
• Partnerships & Alliances
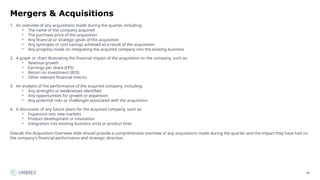
• Mergers & Acquisitions
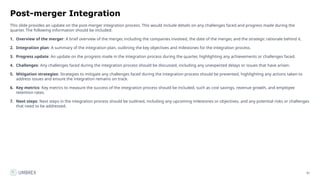
• Post-merger Integration
OTHER CORPORATE
FUNCTIONS
• Intellectual Property
• Risk Management
• Legal & Regulatory
• Litigation
• Investor Relations
• Community Engagement
• ESG
• Sustainability
• Awards & Recognition
AGENDA
PRODUCT
MARKETING
• Financial Overview
• Income Statement
• Cash Flow Statement
• Balance Sheet
• Revenue Breakdown
• Operating Expenses Breakdown
• Cost Reduction Initiatives
• Profitability Analysis/ROI
• Working Capital Analysis
• Accounts Receivable
• Accounts Payable
• Capital Expenditures
• Capital Raising
• Debt Overview & Refinancing
• Tax
• Property & Real Estate Update
• Foreign Currency Exposure
• Product Development Overview
• Research & Development
• Product Roadmap
• Market Overview
• Marketing Initiatives
• Market Expansion
• Marketing ROI
• Pricing Strategy
• Data & Analytics
• Advertising
• Competitors
• Branding & Marketing Materials
• Website
• Social Media
• Industry Events & Conferences
• Public Relations
SALES
• Sales Pipeline
• Sales Team Performance
• Sales by Region
• Sales by Channel
• Channel Partners
CUSTOMERS
OPERATIONS AND SUPPLY
CHAIN INFORMATION TECHNOLOGY
HUMAN RESOURCES
• Operations Overview
• Supply Chain Management
• Emergency Preparedness
• Suppliers
• Worker Safety
• Customer Service
• Customer Acquisition
• Customer Retention
• Customer Satisfaction
• Consumer Insights
• Customer Case Studies
• IT Infrastructure
• Cybersecurity
• Human Resources Overview
• Organizational Structure
• Leadership Team Overview
• Talent Acquisition
• Compensation and Benefits
• Learning and Development
• Employee Engagement
• Employee Retention
• Diversity, Equity, and Inclusion
FINANCE
• Agenda
• Previous Meeting Minutes
29.
29
Product Development Overview
1.Introduction: A brief introduction to the product development initiatives for the quarter, including the goals and objectives.
2. New Product Launches: Provide an overview of any new product launches that occurred during the quarter, including product features, pricing, and market
positioning. Include relevant metrics such as sales revenue, customer acquisition, and market share gains.
3. Product Updates: Highlight any updates made to existing products during the quarter, including new features, bug fixes, and performance improvements.
Include relevant metrics such as customer satisfaction, user adoption, and sales revenue impact.
4. Research and Development: Provide an overview of the research and development activities for the quarter, including any breakthroughs, patent filings, or
new technology developments.
5. Roadmap: Share the product development roadmap for the upcoming quarters, highlighting any major milestones or key initiatives.
6. Challenges and Mitigation: Discuss any challenges faced during the quarter in product development, and share the mitigation strategies put in place to
overcome them.
7. Conclusion: Summarize the key takeaways and the overall impact of product development initiatives on the company's growth and profitability.
30.
30
Research & Development
Thisslide should provide an overview of the company's research and development initiatives during the quarter. It should include the following information:
1. Total R&D expenses for the quarter
2. A breakdown of R&D expenses by project or area of focus
3. Progress made on key R&D projects or milestones achieved during the quarter
4. Any new patents filed or obtained during the quarter
31.
31
Product Roadmap
A ProductRoadmap slide should include the following information:
1. Timeline: A timeline of the upcoming product releases and updates with the expected launch dates. The timeline may include quarters, months or specific
dates.
2. Product details: The product name, description, and features of the upcoming product releases and updates should be included. This section may also
include images or mockups of the products.
3. Development status: Information on the development status of each product, including progress made, milestones achieved, and any delays or roadblocks.
4. Expected impact: A discussion on the expected impact of the product releases and updates on the company's business goals, revenue growth, and market
share.
5. Key performance indicators (KPIs): This section may include KPIs related to the product releases and updates, such as sales figures, customer
engagement, user retention rates, or other metrics relevant to the company's objectives.
6. Risks and challenges: A discussion on the potential risks and challenges associated with the product roadmap, including regulatory issues, technical
difficulties, or competition. A mitigation plan for each risk or challenge should also be included.
7. Future plans: An overview of the company's long-term plans for product development and innovation. This section may include discussion on the
company's research and development initiatives, potential collaborations or partnerships, or plans to enter new markets.
32.
32
Board Reporting PackageContents
CEO & BOARD CHAIR
• CEO Update
• Board Chair Update
CORPORATE DEVELOPMENT
• Partnerships & Alliances
• Mergers & Acquisitions
• Post-merger Integration
OTHER CORPORATE
FUNCTIONS
• Intellectual Property
• Risk Management
• Legal & Regulatory
• Litigation
• Investor Relations
• Community Engagement
• ESG
• Sustainability
• Awards & Recognition
AGENDA
PRODUCT
MARKETING
• Financial Overview
• Income Statement
• Cash Flow Statement
• Balance Sheet
• Revenue Breakdown
• Operating Expenses Breakdown
• Cost Reduction Initiatives
• Profitability Analysis/ROI
• Working Capital Analysis
• Accounts Receivable
• Accounts Payable
• Capital Expenditures
• Capital Raising
• Debt Overview & Refinancing
• Tax
• Property & Real Estate Update
• Foreign Currency Exposure
• Product Development Overview
• Research & Development
• Product Roadmap
• Market Overview
• Marketing Initiatives
• Market Expansion
• Marketing ROI
• Pricing Strategy
• Data & Analytics
• Advertising
• Competitors
• Branding & Marketing Materials
• Website
• Social Media
• Industry Events & Conferences
• Public Relations
SALES
• Sales Pipeline
• Sales Team Performance
• Sales by Region
• Sales by Channel
• Channel Partners
CUSTOMERS
OPERATIONS AND SUPPLY
CHAIN INFORMATION TECHNOLOGY
HUMAN RESOURCES
• Operations Overview
• Supply Chain Management
• Emergency Preparedness
• Suppliers
• Worker Safety
• Customer Service
• Customer Acquisition
• Customer Retention
• Customer Satisfaction
• Consumer Insights
• Customer Case Studies
• IT Infrastructure
• Cybersecurity
• Human Resources Overview
• Organizational Structure
• Leadership Team Overview
• Talent Acquisition
• Compensation and Benefits
• Learning and Development
• Employee Engagement
• Employee Retention
• Diversity, Equity, and Inclusion
FINANCE
• Agenda
• Previous Meeting Minutes
33.
33
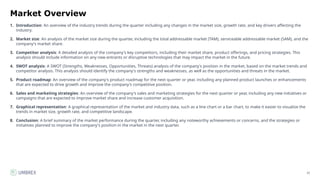
Market Overview
1. Introduction:An overview of the industry trends during the quarter including any changes in the market size, growth rate, and key drivers affecting the
industry.
2. Market size: An analysis of the market size during the quarter, including the total addressable market (TAM), serviceable addressable market (SAM), and the
company's market share.
3. Competitor analysis: A detailed analysis of the company's key competitors, including their market share, product offerings, and pricing strategies. This
analysis should include information on any new entrants or disruptive technologies that may impact the market in the future.
4. SWOT analysis: A SWOT (Strengths, Weaknesses, Opportunities, Threats) analysis of the company's position in the market, based on the market trends and
competitor analysis. This analysis should identify the company's strengths and weaknesses, as well as the opportunities and threats in the market.
5. Product roadmap: An overview of the company's product roadmap for the next quarter or year, including any planned product launches or enhancements
that are expected to drive growth and improve the company's competitive position.
6. Sales and marketing strategies: An overview of the company's sales and marketing strategies for the next quarter or year, including any new initiatives or
campaigns that are expected to improve market share and increase customer acquisition.
7. Graphical representation: A graphical representation of the market and industry data, such as a line chart or a bar chart, to make it easier to visualize the
trends in market size, growth rate, and competitive landscape.
8. Conclusion: A brief summary of the market performance during the quarter, including any noteworthy achievements or concerns, and the strategies or
initiatives planned to improve the company's position in the market in the next quarter.
34.
34
Marketing Initiatives
1. Introduction:A brief overview of the marketing objectives for the quarter.
2. Budget: The budget allocated to marketing initiatives during the quarter.
3. Campaigns: An overview of the marketing campaigns executed during the quarter, including the channels used, the target audience, and the messaging.
4. Results: A summary of the results achieved through marketing initiatives, including metrics such as website traffic, leads generated, and conversions.
5. Lessons Learned: A summary of the key lessons learned from the marketing initiatives executed during the quarter.
6. Future Plans: An overview of the marketing initiatives planned for the next quarter, including the budget allocated, campaigns planned, and objectives to be
achieved.
35.
35
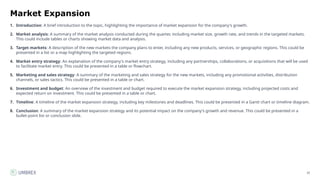
Market Expansion
1. Introduction:A brief introduction to the topic, highlighting the importance of market expansion for the company's growth.
2. Market analysis: A summary of the market analysis conducted during the quarter, including market size, growth rate, and trends in the targeted markets.
This could include tables or charts showing market data and analysis.
3. Target markets: A description of the new markets the company plans to enter, including any new products, services, or geographic regions. This could be
presented in a list or a map highlighting the targeted regions.
4. Market entry strategy: An explanation of the company's market entry strategy, including any partnerships, collaborations, or acquisitions that will be used
to facilitate market entry. This could be presented in a table or flowchart.
5. Marketing and sales strategy: A summary of the marketing and sales strategy for the new markets, including any promotional activities, distribution
channels, or sales tactics. This could be presented in a table or chart.
6. Investment and budget: An overview of the investment and budget required to execute the market expansion strategy, including projected costs and
expected return on investment. This could be presented in a table or chart.
7. Timeline: A timeline of the market expansion strategy, including key milestones and deadlines. This could be presented in a Gantt chart or timeline diagram.
8. Conclusion: A summary of the market expansion strategy and its potential impact on the company's growth and revenue. This could be presented in a
bullet-point list or conclusion slide.
36.
36
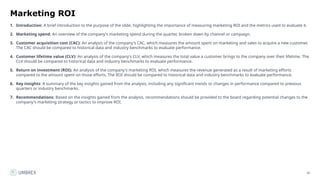
Marketing ROI
1. Introduction:A brief introduction to the purpose of the slide, highlighting the importance of measuring marketing ROI and the metrics used to evaluate it.
2. Marketing spend: An overview of the company's marketing spend during the quarter, broken down by channel or campaign.
3. Customer acquisition cost (CAC): An analysis of the company's CAC, which measures the amount spent on marketing and sales to acquire a new customer.
The CAC should be compared to historical data and industry benchmarks to evaluate performance.
4. Customer lifetime value (CLV): An analysis of the company's CLV, which measures the total value a customer brings to the company over their lifetime. The
CLV should be compared to historical data and industry benchmarks to evaluate performance.
5. Return on investment (ROI): An analysis of the company's marketing ROI, which measures the revenue generated as a result of marketing efforts
compared to the amount spent on those efforts. The ROI should be compared to historical data and industry benchmarks to evaluate performance.
6. Key insights: A summary of the key insights gained from the analysis, including any significant trends or changes in performance compared to previous
quarters or industry benchmarks.
7. Recommendations: Based on the insights gained from the analysis, recommendations should be provided to the board regarding potential changes to the
company's marketing strategy or tactics to improve ROI.
37.
37
Pricing Strategy
1. Overviewof pricing strategy: A brief overview of the company's pricing strategy, including any guiding principles or objectives.
2. Market analysis: An analysis of the market landscape and competitors' pricing strategies.
3. Customer segmentation: An overview of customer segments and their willingness to pay for the company's products or services.
4. Pricing changes: Any changes made to pricing during the quarter, including rationale for the changes and any impact on sales or revenue.
5. Future pricing plans: Plans for any future pricing changes or adjustments, including the timeline for implementation and expected impact on sales or
revenue.
38.
38
Data & Analytics
1.An overview of the company's data sources, including internal data (such as sales and customer data) and external data (such as market data and social
media data).
2. An overview of the tools and technologies being used to analyze data, such as data mining, machine learning, and predictive analytics.
3. Key metrics and KPIs that are being tracked and analyzed, such as customer retention, sales performance, and website traffic.
4. A summary of recent insights or discoveries made through data analysis, along with any actions taken as a result.
5. A summary of any ongoing data-related initiatives or projects, such as implementing a new data warehouse or hiring additional data analysts.
39.
39
Advertising
1. Introduction: Abrief introduction that highlights the importance of advertising for the company and sets the context for the rest of the presentation.
2. Advertising spend: A breakdown of the company's advertising spend, including a summary of the ad content, the amount of dollars spent on advertising,
and any changes in ad spend compared to the previous quarter or year. This may include a graph or chart that visually represents the data.
3. Channel analysis: An analysis of the channels where the company's ad dollars are being spent, such as television, radio, print, online, social media, and
other channels. This may include a breakdown of how much is being spent on each channel and any trends over time. The analysis may also include a
comparison of the effectiveness of each channel based on key metrics such as conversion rate, customer acquisition cost, or click-through rate.
4. Impact analysis: An analysis of the impact of the company's advertising efforts, including any metrics on how the advertising is contributing to revenue
growth, customer acquisition, or other key performance indicators. This analysis may include a comparison of the effectiveness of different ad campaigns,
as well as an analysis of customer feedback or sentiment related to the company's advertising efforts.
5. Future plans: A summary of the company's plans for future advertising efforts, including any new campaigns, channels, or strategies that are being
considered. The presentation may also include a discussion of any challenges or risks associated with the company's advertising efforts, as well as any
potential solutions or mitigating strategies.
40.
40
Competitors
1. Overview ofKey Competitors: This section should include a brief overview of the key competitors in the company's market. This could include information
such as their market share, size, and positioning.
2. Recent Developments: This section should provide a summary of any recent news or developments related to the company's key competitors. This could
include information such as new product launches, changes in leadership, or major acquisitions.
3. Analysis: This section should provide an analysis of the competitive landscape, highlighting any trends or shifts in the market that may impact the
company's position. It should also include an assessment of the company's strengths and weaknesses relative to its competitors.
4. Recommendations: This section should include recommendations for how the company can maintain or improve its competitive position. This could
include strategies for differentiation, product development, or partnerships with other companies.
41.
41
Branding & MarketingMaterials
This slide would feature an overview of the branding and marketing materials used by the company during the quarter. This slide should include the following:
1. A list of the different types of marketing materials used such as television commercials, social media campaigns, print ads, etc.
2. Examples of the company's marketing collateral such as images of print ads, screenshots of social media posts, and stills from TV commercials.
3. Highlight any new branding initiatives or campaigns that the company launched during the quarter, along with the goals and objectives of these initiatives.
4. An overview of the company's overall marketing strategy and how it aligns with the company's broader business goals and objectives.
5. The slide could be accompanied by metrics such as website traffic, social media engagement rates, and other relevant KPIs to measure the effectiveness of
the company's marketing efforts.
42.
42
Website
1. A briefoverview of any major changes made to the company's website during the reporting period, including new features or pages added, any redesigns,
or updates to existing content. This could be summarized in bullet points or shown visually through screenshots of the website.
2. A report on website traffic with a breakdown of sources of traffic, such as direct, organic search, paid search, referral, social media, and email marketing.
This could be displayed in a graph or chart to make it easier to understand.
3. Trends in key metrics such as the conversion rate, bounce rate, time on site, pages per visit, and average session duration. This could be shown through
visual aids such as line charts, bar graphs, or tables.
4. Any significant insights or findings related to website performance, such as opportunities for optimization or areas of improvement, along with
recommended actions to take in response. This could be presented in bullet points or as a summary paragraph.
43.
43
Social Media
1. Introduction:Provide a brief introduction to the importance of social media in the company's overall marketing and communication strategy. Explain how
social media platforms enable the company to engage with customers, build brand awareness, and drive business growth.
2. Social Media Channels: Display the company's official social media channels prominently including the number of followers or subscribers on each
platform.
3. Content Strategy: Highlight the company's social media content strategy. Describe the types of content shared on social media platforms, such as product
updates, promotions, industry insights, thought leadership, behind-the-scenes content, or user-generated content. Emphasize how the content aligns with
the company's brand voice and resonates with the target audience.
4. Engagement Metrics: Present key social media engagement metrics to demonstrate the effectiveness of the company's social media presence. Include
metrics such as likes, comments, shares, retweets, reach, impressions, and click-through rates. Showcase growth trends over time or compare metrics across
different periods.
5. Customer Feedback and Reviews: Highlight customer feedback and reviews received through social media platforms. Include positive testimonials, user-
generated content, or customer success stories shared by customers on social media.
6. Influencer Partnerships: Highlight any partnerships with social media influencers or brand ambassadors. Mention notable collaborations or campaigns
that helped increase brand visibility and reach a wider audience. Showcase examples of influencer-generated content and its impact on engagement or
brand sentiment.
7. Social Media Advertising: Discuss the company's social media advertising initiatives. Highlight any successful advertising campaigns or promotions run on
social media platforms. Mention key metrics such as ad impressions, click-through rates, conversions, or return on ad spend (ROAS) to demonstrate the
effectiveness of social media advertising.
8. Crisis Management: Briefly outline the company's approach to handling crises or negative situations on social media. Highlight examples of how the
company effectively addressed and resolved customer concerns or reputation issues through social media channels.
9. Competitor Analysis: Provide a summary of the company's performance in comparison to competitors on social media. Include relevant metrics, such as
follower growth, engagement rates, or share of voice, to demonstrate the company's position within the industry.
10.Conclusion: Summarize the key points mentioned in the slide. Reinforce the importance of social media as a strategic tool for brand building, customer
engagement, and market presence.
44.
44
Industry Events &Conferences
This slide should provide a summary of the industry events and conferences attended by the company during the quarter. The slide should be visually
engaging, with the company logo and relevant images used to support the content. It should include the following information:
1. A brief introduction of the slide with a summary of the industry events and conferences attended during the quarter.
2. The list of events with the event name, date, location, and a brief description of the event.
3. Supporting images or graphics, such as pictures from the events, or logos of the event sponsors.
4. Any key takeaways or outcomes from the events, such as networking opportunities or new insights gained.
5. Recommendations for future attendance or participation in similar events based on the outcomes and impact of the events attended.
6. Contact information for any relevant contacts or organizations that were met or discussed during the events, including any follow-up action items.
Overall, the slide should provide a comprehensive overview of the company's attendance at relevant industry events and conferences, highlighting any
significant benefits or outcomes resulting from participation.
45.
45
Public Relations
1. Introduction:A brief introduction outlining the importance of media coverage for the company and how it impacts its reputation and brand image.
2. Media outlets covered: A list of media outlets that covered the company during the quarter. This can include both positive and negative coverage.
3. Headlines: A selection of headlines from the media outlets listed, showcasing the tone of the coverage.
4. Analysis: A brief analysis of the overall sentiment of the coverage (positive, negative, or neutral) and any trends that emerged during the quarter.
5. Graphs: Graphs or charts that visually display the media coverage and sentiment over time or by media outlet.
6. Conclusion: A brief conclusion summarizing the key takeaways from the media coverage during the quarter and any actions the company may need to take
in response to it.
46.
46
Board Reporting PackageContents
CEO & BOARD CHAIR
• CEO Update
• Board Chair Update
CORPORATE DEVELOPMENT
• Partnerships & Alliances
• Mergers & Acquisitions
• Post-merger Integration
OTHER CORPORATE
FUNCTIONS
• Intellectual Property
• Risk Management
• Legal & Regulatory
• Litigation
• Investor Relations
• Community Engagement
• ESG
• Sustainability
• Awards & Recognition
AGENDA
PRODUCT
MARKETING
• Financial Overview
• Income Statement
• Cash Flow Statement
• Balance Sheet
• Revenue Breakdown
• Operating Expenses Breakdown
• Cost Reduction Initiatives
• Profitability Analysis/ROI
• Working Capital Analysis
• Accounts Receivable
• Accounts Payable
• Capital Expenditures
• Capital Raising
• Debt Overview & Refinancing
• Tax
• Property & Real Estate Update
• Foreign Currency Exposure
• Product Development Overview
• Research & Development
• Product Roadmap
• Market Overview
• Marketing Initiatives
• Market Expansion
• Marketing ROI
• Pricing Strategy
• Data & Analytics
• Advertising
• Competitors
• Branding & Marketing Materials
• Website
• Social Media
• Industry Events & Conferences
• Public Relations
SALES
• Sales Pipeline
• Sales Team Performance
• Sales by Region
• Sales by Channel
• Channel Partners
CUSTOMERS
OPERATIONS AND SUPPLY
CHAIN INFORMATION TECHNOLOGY
HUMAN RESOURCES
• Operations Overview
• Supply Chain Management
• Emergency Preparedness
• Suppliers
• Worker Safety
• Customer Service
• Customer Acquisition
• Customer Retention
• Customer Satisfaction
• Consumer Insights
• Customer Case Studies
• IT Infrastructure
• Cybersecurity
• Human Resources Overview
• Organizational Structure
• Leadership Team Overview
• Talent Acquisition
• Compensation and Benefits
• Learning and Development
• Employee Engagement
• Employee Retention
• Diversity, Equity, and Inclusion
FINANCE
• Agenda
• Previous Meeting Minutes
47.
47
Sales Pipeline
1. Introduction:A summary of the company's sales pipeline during the quarter, including the total number of leads, conversion rates, and expected revenue,
and an analysis of the trend compared to previous quarters or years.
2. Sales pipeline breakdown: A breakdown of the sales pipeline by product, service, or customer segment, and an analysis of the trend compared to previous
quarters or years.
3. Lead sources: An analysis of the sources of the leads, such as website traffic, social media, referrals, and paid advertising, and an evaluation of their
effectiveness.
4. Conversion rates: An analysis of the conversion rates for each stage of the sales pipeline, including the percentage of leads that progress to the next stage,
and an evaluation of their effectiveness.
5. Sales forecast: A sales forecast for the next quarter or year, based on the expected number of leads, conversion rates, and expected revenue.
6. Graphical representation: A graphical representation of the company's sales pipeline, such as a funnel chart, to make it easier to visualize the breakdown
and trends over time.
7. Conclusion: A brief summary of the company's sales pipeline during the quarter, including any noteworthy achievements or concerns, and the outlook for
the next quarter.
48.
48
Sales Team Performance
1.Introduction: A summary of the company's sales team performance during the quarter including the total sales revenue, and an analysis of the trend
compared to previous quarters or years.
2. Sales by representative: A breakdown of sales by each sales representative, including the total sales revenue, number of deals closed, and average deal
size, and an analysis of their performance compared to the previous quarter or year.
3. Conversion rates: An analysis of the conversion rates for each sales representative, including the percentage of leads that progress to the next stage and
convert into closed deals, and an evaluation of their effectiveness.
4. Average deal size: An analysis of the average deal size for each sales representative, including any significant changes compared to previous quarters or
years, and an evaluation of their effectiveness.
5. Sales cycle time: An analysis of the average sales cycle time for each sales representative, including any significant changes compared to previous quarters
or years, and an evaluation of their effectiveness.
6. Graphical representation: A graphical representation of the sales team performance, such as a bar chart or a scatter plot, to make it easier to visualize the
performance of each sales representative and identify any trends or patterns.
7. Conclusion: A brief summary of the sales team performance during the quarter, including any noteworthy achievements or concerns, and the strategies or
initiatives planned to improve the performance in the next quarter.
49.
49
Sales by Region
1.An overview of the company's sales performance during the quarter, broken down by geographic region.
2. A table or graph showing sales figures for each region, including revenue and units sold.
3. A comparison of the current quarter's sales figures to those of the previous quarter or year, highlighting any significant changes or trends.
4. An analysis of the factors contributing to the sales performance in each region, such as changes in market conditions or consumer behavior.
5. A summary of any actions taken or planned to improve sales performance in underperforming regions.
6. A conclusion summarizing the key takeaways and implications for the company's overall sales strategy.
50.
50
Sales by Channel
1.Introduction: A brief introduction to the slide's topic, including an overview of the company's sales channels.
2. Sales channel breakdown: A breakdown of sales by channel, including metrics such as revenue, units sold, and average order value for each channel.
3. Year-over-year comparison: A year-over-year comparison of sales by channel, highlighting any notable changes or trends.
4. Channel performance analysis: An analysis of each sales channel's performance, including strengths, weaknesses, and opportunities for improvement.
5. Key takeaways: A summary of the most important insights and takeaways from the sales by channel analysis, including any recommended actions or next
steps.
51.
51
Channel Partners
1. Overviewof current channel partners, including a breakdown by region or market segment, and any new partners added during the reporting period.
2. Discussion of key metrics such as revenue contribution, sales growth, and market share for each channel partner.
3. Summary of any changes to the channel partner program, such as incentives or support provided to partners.
4. Analysis of channel partner performance, including any challenges faced and plans to address them in the future.
5. Discussion of upcoming opportunities for channel partners and plans to leverage these opportunities.
52.
52
Board Reporting PackageContents
CEO & BOARD CHAIR
• CEO Update
• Board Chair Update
CORPORATE DEVELOPMENT
• Partnerships & Alliances
• Mergers & Acquisitions
• Post-merger Integration
OTHER CORPORATE
FUNCTIONS
• Intellectual Property
• Risk Management
• Legal & Regulatory
• Litigation
• Investor Relations
• Community Engagement
• ESG
• Sustainability
• Awards & Recognition
AGENDA
PRODUCT
MARKETING
• Financial Overview
• Income Statement
• Cash Flow Statement
• Balance Sheet
• Revenue Breakdown
• Operating Expenses Breakdown
• Cost Reduction Initiatives
• Profitability Analysis/ROI
• Working Capital Analysis
• Accounts Receivable
• Accounts Payable
• Capital Expenditures
• Capital Raising
• Debt Overview & Refinancing
• Tax
• Property & Real Estate Update
• Foreign Currency Exposure
• Product Development Overview
• Research & Development
• Product Roadmap
• Market Overview
• Marketing Initiatives
• Market Expansion
• Marketing ROI
• Pricing Strategy
• Data & Analytics
• Advertising
• Competitors
• Branding & Marketing Materials
• Website
• Social Media
• Industry Events & Conferences
• Public Relations
SALES
• Sales Pipeline
• Sales Team Performance
• Sales by Region
• Sales by Channel
• Channel Partners
CUSTOMERS
OPERATIONS AND SUPPLY
CHAIN INFORMATION TECHNOLOGY
HUMAN RESOURCES
• Operations Overview
• Supply Chain Management
• Emergency Preparedness
• Suppliers
• Worker Safety
• Customer Service
• Customer Acquisition
• Customer Retention
• Customer Satisfaction
• Consumer Insights
• Customer Case Studies
• IT Infrastructure
• Cybersecurity
• Human Resources Overview
• Organizational Structure
• Leadership Team Overview
• Talent Acquisition
• Compensation and Benefits
• Learning and Development
• Employee Engagement
• Employee Retention
• Diversity, Equity, and Inclusion
FINANCE
• Agenda
• Previous Meeting Minutes
53.
53
Operations Overview
This slideshould provide an overview of the company's operations during the quarter, focusing on supply chain management and logistics. It should include
the following information:
1. Supply Chain Management: A brief overview of the company's supply chain management during the quarter, including any improvements or challenges. A
graphical representation of the supply chain process can be included.
2. Logistics: A brief overview of the company's logistics during the quarter, including any improvements or challenges. This section should cover information
on transportation, warehousing, and inventory management. A graphical representation of the logistics process can be included.
3. Key Performance Indicators (KPIs): This section should provide an analysis of key performance indicators related to operations. Examples of KPIs to
include are inventory turnover, on-time delivery, and order fulfillment accuracy. Each KPI should be accompanied by a chart or graph that visually represents
the data and trends.
4. Initiatives and Improvements: This section should outline any initiatives or improvements made in operations during the quarter. This can include process
improvements, cost savings initiatives, or technology enhancements. Each initiative should be accompanied by a brief description and a chart or graph that
shows the impact of the initiative on operations metrics.
54.
54
Supply Chain Management
Asupply chain management update slide should include following information:
1. Overview: A brief introduction and summary of the current state of the supply chain management process.
2. Performance metrics: Key performance indicators such as on-time delivery, inventory turnover, and order cycle time.
3. Supplier management: An update on supplier management, including any new supplier onboarding, performance evaluations, and supplier risk
management.
4. Logistics and transportation: Updates on logistics and transportation, including any new partnerships, cost-saving initiatives, and delivery performance.
5. Inventory management: An update on inventory management, including inventory levels, safety stock levels, and stockouts.
6. Supply chain risks: A summary of the identified risks to the supply chain and the measures taken to mitigate them.
7. Future plans: Plans for future improvements to the supply chain management process, including any technology upgrades or process optimizations.
55.
55
Emergency Preparedness
1. Introductionand background information on the importance of an emergency preparedness plan.
2. An overview of the company's emergency preparedness plan, including key components such as risk assessment, crisis management, and business
continuity planning.
3. Specific details on the plan for different types of emergencies, including natural disasters, pandemics, and other crises.
4. A summary of any recent emergency drills or exercises conducted to test the plan's effectiveness.
5. Key performance indicators (KPIs) used to measure the success of the emergency preparedness plan.
6. Future plans for improving and updating the emergency preparedness plan, including incorporating lessons learned from previous emergencies or crises.
7. Any additional information or relevant updates regarding emergency preparedness and response.
56.
56
Suppliers
1. An overviewof the company's suppliers, including a list of the largest suppliers and any significant changes to the supplier base since the last report. This
could include information such as the number of active suppliers, total spend on suppliers, and supplier diversity metrics.
2. An update on any key initiatives related to suppliers, such as efforts to consolidate suppliers, shift to suppliers closer to home, or efforts to increase supplier
diversity. This may include details on progress made towards achieving these goals.
3. A summary of any significant risks or challenges related to the supplier base, such as supply chain disruptions, supplier quality issues, or supplier
bankruptcies.
4. Key metrics related to supplier performance, such as lead times, delivery accuracy, and defect rates. This could include any trends in these metrics over time
and any initiatives being undertaken to improve performance.
5. Any other relevant information related to suppliers, such as key supplier contracts or significant supplier negotiations that are currently underway.
57.
57
Worker Safety
1. Overviewof workplace injuries: An overview of workplace injuries since the last report, including the total number of injuries, the nature of the injuries,
and any trends or patterns observed. This information should be presented in a table or chart format.
2. Details of workplace injuries: A detailed breakdown of each injury, including the date, location, nature of the injury, and the employee's role and tenure with
the company. This information should be presented in a table format.
3. Initiatives to improve workplace safety: An update on any initiatives or programs implemented to improve workplace safety since the last report. This
may include changes in policies or procedures, training programs, equipment upgrades, or any other measures taken to prevent workplace injuries. Key
performance indicators should be included to measure the effectiveness of these initiatives.
4. Action plan for future improvement: An action plan for future improvement should be presented that outlines the steps the company plans to take to
improve workplace safety. The plan should be based on the findings and analysis presented in the previous sections and should be specific, measurable, and
time-bound. Key performance indicators should be identified to measure progress and the impact of the actions taken.
58.
58
Board Reporting PackageContents
CEO & BOARD CHAIR
• CEO Update
• Board Chair Update
CORPORATE DEVELOPMENT
• Partnerships & Alliances
• Mergers & Acquisitions
• Post-merger Integration
OTHER CORPORATE
FUNCTIONS
• Intellectual Property
• Risk Management
• Legal & Regulatory
• Litigation
• Investor Relations
• Community Engagement
• ESG
• Sustainability
• Awards & Recognition
AGENDA
PRODUCT
MARKETING
• Financial Overview
• Income Statement
• Cash Flow Statement
• Balance Sheet
• Revenue Breakdown
• Operating Expenses Breakdown
• Cost Reduction Initiatives
• Profitability Analysis/ROI
• Working Capital Analysis
• Accounts Receivable
• Accounts Payable
• Capital Expenditures
• Capital Raising
• Debt Overview & Refinancing
• Tax
• Property & Real Estate Update
• Foreign Currency Exposure
• Product Development Overview
• Research & Development
• Product Roadmap
• Market Overview
• Marketing Initiatives
• Market Expansion
• Marketing ROI
• Pricing Strategy
• Data & Analytics
• Advertising
• Competitors
• Branding & Marketing Materials
• Website
• Social Media
• Industry Events & Conferences
• Public Relations
SALES
• Sales Pipeline
• Sales Team Performance
• Sales by Region
• Sales by Channel
• Channel Partners
CUSTOMERS
OPERATIONS AND SUPPLY
CHAIN INFORMATION TECHNOLOGY
HUMAN RESOURCES
• Operations Overview
• Supply Chain Management
• Emergency Preparedness
• Suppliers
• Worker Safety
• Customer Service
• Customer Acquisition
• Customer Retention
• Customer Satisfaction
• Consumer Insights
• Customer Case Studies
• IT Infrastructure
• Cybersecurity
• Human Resources Overview
• Organizational Structure
• Leadership Team Overview
• Talent Acquisition
• Compensation and Benefits
• Learning and Development
• Employee Engagement
• Employee Retention
• Diversity, Equity, and Inclusion
FINANCE
• Agenda
• Previous Meeting Minutes
59.
59
Customer Service
1. Customerservice response times: An analysis of customer service response times during the quarter, including average response times, peak response
times, and any notable trends.
2. Customer satisfaction rates: An analysis of customer satisfaction rates, including overall satisfaction rates, ratings for specific customer service channels,
and any notable trends.
3. Resolution rates: An analysis of customer service issue resolution rates, including average resolution times, peak resolution times, and any notable trends.
4. Customer feedback: A summary of customer feedback received during the quarter, including common complaints, praise, and suggestions.
5. Action plan: An overview of any action plans or initiatives to improve customer service based on the metrics presented, including timelines and responsible
parties.
6. Conclusion: A summary of the key takeaways from the analysis and the company's overall performance in customer service during the quarter.
60.
60
Customer Acquisition
1. Introduction:An overview of customer acquisition during the quarter including the total number of new customers acquired, and an analysis of the trend
compared to previous quarters or years.
2. Cost of acquisition: An analysis of the cost of acquiring new customers, including the total marketing and sales expenses, and an evaluation of the
effectiveness of various marketing channels and campaigns.
3. Customer demographics: An analysis of the demographics of new customers, including their age, gender, location, and other relevant characteristics, and
an evaluation of the effectiveness of the company's marketing and sales strategies in targeting these customers.
4. Sales cycle time: An analysis of the average sales cycle time for new customers, including any significant changes compared to previous quarters or years,
and an evaluation of the effectiveness of the company's sales process in converting leads into closed deals.
5. Customer retention: An analysis of the customer retention rate for new customers, including any significant changes compared to previous quarters or
years, and an evaluation of the effectiveness of the company's customer service and support in keeping customers satisfied and loyal.
6. Graphical representation: A graphical representation of the customer acquisition data, such as a bar chart or a pie chart, to make it easier to visualize the
demographics and trends of new customers.
7. Conclusion: A brief summary of the customer acquisition performance during the quarter, including any noteworthy achievements or concerns, and the
strategies or initiatives planned to improve the customer acquisition in the next quarter.
61.
61
Customer Retention
1. Introduction:An overview of customer retention during the quarter including the total number of active customers and an analysis of the trend compared
to previous quarters or years.
2. Churn rate: An analysis of the churn rate during the quarter, including the total number of lost customers and the percentage of customers lost, and an
evaluation of the reasons behind the customer churn.
3. Customer lifetime value: An analysis of the customer lifetime value (CLV) during the quarter, including the average revenue generated by a customer over
their lifetime, and an evaluation of the effectiveness of the company's customer retention strategies in maximizing CLV.
4. Customer engagement: An analysis of the level of customer engagement during the quarter, including metrics such as customer satisfaction, Net Promoter
Score (NPS), and customer referrals, and an evaluation of the effectiveness of the company's customer engagement strategies.
5. Customer feedback: An analysis of the customer feedback received during the quarter, including feedback from surveys, reviews, and support tickets, and
an evaluation of the trends and patterns in customer feedback.
6. Graphical representation: A graphical representation of the customer retention data, such as a line chart or a stacked bar chart, to make it easier to
visualize the trends in customer retention and engagement.
7. Conclusion: A brief summary of the customer retention performance during the quarter, including any noteworthy achievements or concerns, and the
strategies or initiatives planned to improve customer retention in the next quarter.
62.
62
Customer Satisfaction
1. Introduction:An overview of customer satisfaction metrics during the quarter including the Net Promoter Score (NPS) and any other customer satisfaction
metrics used by the company.
2. NPS: A detailed analysis of the NPS score during the quarter, including the total number of responses and the breakdown of promoters, detractors, and
passives.
3. Customer reviews: An analysis of customer reviews received during the quarter, including feedback from review sites and social media platforms, and an
evaluation of the trends and patterns in customer feedback.
4. Customer support: An analysis of customer support during the quarter, including metrics such as response time, resolution time, and customer satisfaction
with support interactions.
5. Improvement initiatives: An overview of the initiatives implemented during the quarter to improve customer satisfaction, such as customer feedback
surveys, product enhancements, and support process improvements.
6. Graphical representation: A graphical representation of the customer satisfaction data, such as a line chart or a stacked bar chart, to make it easier to
visualize the trends in customer satisfaction metrics.
7. Conclusion: A brief summary of the customer satisfaction performance during the quarter, including any noteworthy achievements or concerns, and the
strategies or initiatives planned to improve customer satisfaction in the next quarter.
63.
63
Consumer Insights
1. Introduction:A brief introduction to the purpose of the slide, such as "Insights into customer behavior and preferences are crucial to the success of our
business."
2. Summary of recent initiatives: A summary of any recent initiatives undertaken to gain consumer insights, such as B2B surveys, B2C surveys, focus groups,
social listening, voice-of-the-customer interviews, etc. This section may also include a brief description of the methodology used and the sample size.
3. Key findings: A list of the key insights gained from the recent initiatives, such as customer preferences, pain points, and unmet needs. This section should
be supported with data, charts, or graphs, where possible.
4. Implications: A discussion of the implications of the key findings for the company's product development, marketing, and sales strategies. This section
should also include any proposed actions or recommendations based on the insights gained.
5. Conclusion: A brief summary of the key takeaways from the slide, such as "Our recent consumer insights initiatives have provided valuable insights into
customer preferences and pain points, which will inform our product development and marketing strategies moving forward."
64.
64
Customer Case Studies
1.Introduction: A brief introduction to the customer case studies, including the objective and relevance of showcasing them.
2. Case study 1: A summary of a successful customer experience with the company's products or services. This should include the customer's background, the
problem they faced, how the company's solution helped solve the problem, and the outcome.
3. Case study 2: A summary of another successful customer experience with the company's products or services, following the same structure as Case study 1.
4. Case study 3: A summary of another successful customer experience with the company's products or services, following the same structure as Case study 1.
5. Key takeaways: A summary of the key takeaways from the customer case studies, highlighting any common themes or trends.
6. Conclusion: A brief conclusion that ties back to the objective and relevance of showcasing the customer case studies, and how they relate to the company's
overall strategy and goals.
65.
65
Board Reporting PackageContents
CEO & BOARD CHAIR
• CEO Update
• Board Chair Update
CORPORATE DEVELOPMENT
• Partnerships & Alliances
• Mergers & Acquisitions
• Post-merger Integration
OTHER CORPORATE
FUNCTIONS
• Intellectual Property
• Risk Management
• Legal & Regulatory
• Litigation
• Investor Relations
• Community Engagement
• ESG
• Sustainability
• Awards & Recognition
AGENDA
PRODUCT
MARKETING
• Financial Overview
• Income Statement
• Cash Flow Statement
• Balance Sheet
• Revenue Breakdown
• Operating Expenses Breakdown
• Cost Reduction Initiatives
• Profitability Analysis/ROI
• Working Capital Analysis
• Accounts Receivable
• Accounts Payable
• Capital Expenditures
• Capital Raising
• Debt Overview & Refinancing
• Tax
• Property & Real Estate Update
• Foreign Currency Exposure
• Product Development Overview
• Research & Development
• Product Roadmap
• Market Overview
• Marketing Initiatives
• Market Expansion
• Marketing ROI
• Pricing Strategy
• Data & Analytics
• Advertising
• Competitors
• Branding & Marketing Materials
• Website
• Social Media
• Industry Events & Conferences
• Public Relations
SALES
• Sales Pipeline
• Sales Team Performance
• Sales by Region
• Sales by Channel
• Channel Partners
CUSTOMERS
OPERATIONS AND SUPPLY
CHAIN INFORMATION TECHNOLOGY
HUMAN RESOURCES
• Operations Overview
• Supply Chain Management
• Emergency Preparedness
• Suppliers
• Worker Safety
• Customer Service
• Customer Acquisition
• Customer Retention
• Customer Satisfaction
• Consumer Insights
• Customer Case Studies
• IT Infrastructure
• Cybersecurity
• Human Resources Overview
• Organizational Structure
• Leadership Team Overview
• Talent Acquisition
• Compensation and Benefits
• Learning and Development
• Employee Engagement
• Employee Retention
• Diversity, Equity, and Inclusion
FINANCE
• Agenda
• Previous Meeting Minutes
66.
66
Human Resources Overview
Thisslide should provide an overview of the human resources initiatives and performance during the quarter. It should include the following information:
1. Key Metrics: A table or chart displaying key metrics such as:
• Number of Employees: Total number of employees at the beginning and end of the quarter.
• Turnover: Employee turnover rate for the quarter.
• New Hires: Number of new hires and hires by department.
• Time to Hire: Average time-to-hire for new employees.
• Training: Number of employee training hours and training expenses.
• Other Metrics: Any other key HR metrics that are relevant to the company's goals and objectives.
2. Recruitment Initiatives: A brief overview of recruitment initiatives undertaken during the quarter, including any new recruiting channels, such as job
boards or social media platforms, and their effectiveness in attracting new hires.
3. Employee Training: A summary of employee training initiatives during the quarter, including any new training programs or tools, employee feedback on
training, and the effectiveness of training in improving employee performance.
4. Employee Engagement: A summary of employee engagement initiatives during the quarter, including any surveys or feedback mechanisms used to
measure employee satisfaction and engagement, and any actions taken to improve employee engagement.
5. Conclusion: A summary of the overall HR performance during the quarter, highlighting any successes or areas for improvement.
67.
67
Organizational Structure
1. Introduction:A brief introduction to the company's organizational structure, including its overall design and purpose.
2. Organizational chart: An organizational chart that provides a visual representation of the company's structure. The chart should include key departments,
teams, and individuals, as well as their respective roles and responsibilities. This should be up to date with any recent or planned changes.
3. Department overviews: A brief overview of each major department or business unit within the company, including their purpose, key activities, and recent
achievements or challenges.
4. Key initiatives: A summary of any major organizational initiatives or projects that are underway, including those related to organizational design, efficiency,
or culture.
5. Challenges and opportunities: A discussion of any challenges or opportunities related to the company's organizational structure, including potential
changes that may need to be considered in the future.
6. Conclusion: A conclusion that summarizes the main points of the presentation and emphasizes the importance of the company's organizational structure for
achieving its goals.
68.
68
Leadership Team Overview
1.Introduction: A brief introduction to the importance of the leadership team
2. Leadership team members: A list of the leadership team members, their roles, and their responsibilities. This section could include headshots of each
member and a brief bio that highlights their relevant experience and expertise.
3. Changes during the quarter: Any changes to the leadership team during the quarter, such as new hires, departures, or promotions. This section could also
include a timeline of any significant events or initiatives undertaken by the leadership team during the quarter.
4. Key achievements: A summary of the leadership team's key achievements during the quarter, such as successful product launches, major customer wins, or
strategic partnerships. This section could also highlight any challenges the team faced and how they were overcome.
5. Conclusion: A conclusion that summarizes the leadership team's performance during the quarter and its impact on the company's overall success. This
section could also include any recommendations or goals for the team moving forward.
69.
69
Talent Acquisition
1. Introduction:A brief overview of the current hiring landscape and any industry trends that are relevant to the company's recruitment efforts.
2. Open roles: A list of currently open roles, including job titles, locations, and a brief description of each position.
3. Metrics: Key metrics related to the recruitment function, such as average time to fill a role, average cost to fill each role, and any other relevant recruitment
KPIs.
4. Recruitment initiatives: An update on any initiatives the company is currently undertaking to improve its recruitment function, such as partnerships with
universities or job boards, employer branding campaigns, or improvements to the application process.
5. Diversity and inclusion: A summary of any efforts the company is making to improve diversity and inclusion in its hiring practices, such as setting diversity
targets or implementing blind hiring practices.
6. Conclusion: A summary of the key takeaways from the talent acquisition update and any action items or next steps for the board to consider.
70.
70
Compensation & Benefits
1.Employee compensation: An overview of changes made to employee compensation during the quarter, including any salary increases, bonuses, or equity
awards.
2. Employee benefits: An update on employee benefits, including changes to healthcare plans, retirement plans, and other benefits offered.
3. Total rewards statement: An overview of the total rewards package offered to employees, including both compensation and benefits.
4. Employee satisfaction survey results: An analysis of employee satisfaction with compensation and benefits, including areas for improvement and plans for
addressing any concerns.
71.
71
Learning & Development
Anoverview of employee training and development programs during the quarter, including metrics such as training hours and completion rates.
1. A summary of the training programs offered, including topics covered, target audience, and delivery format (e.g. in-person, virtual, self-paced).
2. Metrics on training hours and completion rates, broken down by department, job level, and type of training.
3. Feedback from employees on the effectiveness of the training programs, including areas for improvement and suggestions for future training topics.
4. A discussion of any new initiatives or updates to existing programs aimed at improving employee skills and knowledge.
72.
72
Employee Engagement
This slideprovides an analysis of employee engagement metrics, including turnover rate and employee satisfaction. It should include the following information:
1. Overview of employee engagement: A brief introduction to the concept of employee engagement and its importance for the company's success.
2. Turnover rate analysis: A breakdown of turnover rate by department, job level, and reason for leaving. This analysis can be presented using tables or
charts.
3. Employee satisfaction analysis: An overview of the company's employee satisfaction scores, such as the Employee Net Promoter Score (eNPS) and other
survey results. This analysis can also include a breakdown of satisfaction scores by department or job level.
4. Key drivers of engagement: An analysis of the key drivers of employee engagement based on survey data and other feedback mechanisms. This can
include a summary of the top drivers and any notable changes compared to previous periods.
5. Action plan: A summary of the company's action plan to improve employee engagement, including any initiatives or programs launched during the quarter.
This can also include a timeline for future activities related to employee engagement.
6. Conclusion: A brief conclusion summarizing the key findings and highlighting the company's commitment to improving employee engagement.
73.
73
Employee Retention
1. Overview:A brief summary of the company's employee retention initiatives during the quarter, including any new programs or policies implemented.
2. Employee feedback programs: An overview of employee feedback programs, such as surveys or focus groups, and any insights gained from employee
feedback.
3. Employee engagement programs: An overview of employee engagement programs, such as training and development opportunities or team-building
activities, and any impact on employee retention.
4. Retention metrics: An analysis of retention metrics, including turnover rates and reasons for attrition, and any trends observed during the quarter.
5. Future plans: An overview of future plans for employee retention initiatives, including any new programs or policies planned for implementation in the
upcoming quarter.
74.
74
Diversity, Equity &Inclusion
An overview of the company's diversity and inclusion initiatives
1. Progress made in the quarter towards diversity and inclusion goals
2. Data on employee demographics, including diversity metrics such as race, ethnicity, gender, and age
3. Employee resource group updates and events
4. Employee training and development programs related to diversity and inclusion
5. Hiring and retention initiatives aimed at promoting diversity and inclusion
6. Plans for further improvement in the upcoming quarter
75.
75
Board Reporting PackageContents
CEO & BOARD CHAIR
• CEO Update
• Board Chair Update
CORPORATE DEVELOPMENT
• Partnerships & Alliances
• Mergers & Acquisitions
• Post-merger Integration
OTHER CORPORATE
FUNCTIONS
• Intellectual Property
• Risk Management
• Legal & Regulatory
• Litigation
• Investor Relations
• Community Engagement
• ESG
• Sustainability
• Awards & Recognition
AGENDA
PRODUCT
MARKETING
• Financial Overview
• Income Statement
• Cash Flow Statement
• Balance Sheet
• Revenue Breakdown
• Operating Expenses Breakdown
• Cost Reduction Initiatives
• Profitability Analysis/ROI
• Working Capital Analysis
• Accounts Receivable
• Accounts Payable
• Capital Expenditures
• Capital Raising
• Debt Overview & Refinancing
• Tax
• Property & Real Estate Update
• Foreign Currency Exposure
• Product Development Overview
• Research & Development
• Product Roadmap
• Market Overview
• Marketing Initiatives
• Market Expansion
• Marketing ROI
• Pricing Strategy
• Data & Analytics
• Advertising
• Competitors
• Branding & Marketing Materials
• Website
• Social Media
• Industry Events & Conferences
• Public Relations
SALES
• Sales Pipeline
• Sales Team Performance
• Sales by Region
• Sales by Channel
• Channel Partners
CUSTOMERS
OPERATIONS AND SUPPLY
CHAIN INFORMATION TECHNOLOGY
HUMAN RESOURCES
• Operations Overview
• Supply Chain Management
• Emergency Preparedness
• Suppliers
• Worker Safety
• Customer Service
• Customer Acquisition
• Customer Retention
• Customer Satisfaction
• Consumer Insights
• Customer Case Studies
• IT Infrastructure
• Cybersecurity
• Human Resources Overview
• Organizational Structure
• Leadership Team Overview
• Talent Acquisition
• Compensation and Benefits
• Learning and Development
• Employee Engagement
• Employee Retention
• Diversity, Equity, and Inclusion
FINANCE
• Agenda
• Previous Meeting Minutes
76.
76
IT Infrastructure
An ITinfrastructure update slide should include the following information:
1. Overview: An overview of the current IT infrastructure, including the technology stack and the overall architecture of the system.
2. Changes: Any changes or upgrades made to the IT infrastructure during the quarter, including hardware and software updates, new installations, or system
migrations.
3. Metrics: Key performance indicators (KPIs) that measure the effectiveness and efficiency of the IT infrastructure, such as system uptime, response time, and
user satisfaction.
4. Security: An overview of the company's IT security measures, including data encryption, firewalls, access controls, and incident response plans.
5. Budget: A breakdown of the IT budget and expenditures, including investments in hardware, software, and services.
6. Future Plans: Plans for future upgrades or changes to the IT infrastructure, including potential risks and challenges, timelines, and expected outcomes.
Overall, the IT infrastructure update slide should provide the board with a clear understanding of the current state of the company's IT infrastructure and any
updates made during the quarter, as well as plans for future improvements and potential risks.
77.
77
Cybersecurity
This slide shouldprovide the board with a clear understanding of the company's cybersecurity efforts and the effectiveness of those efforts in mitigating
security incidents and threats. It should include the following information:
1. A brief introduction highlighting the importance of cybersecurity for the company and a summary of cybersecurity initiatives during the quarter.
2. A chart or graph showing the number and types of security incidents that occurred during the quarter, along with their impact on the company.
3. An overview of any cybersecurity threats that the company faced during the quarter and the steps taken to mitigate those threats.
4. An overview of any changes to the company's cybersecurity policies and procedures during the quarter.
5. Any recommendations or action items to further improve the company's cybersecurity posture.
Additionally, the slide could discuss the company's approach to testing and updating its incident response plan to ensure it remains effective in the face of
evolving cyber threats. This may include information on any recent testing or simulations of the incident response plan and the results of these exercises.
Overall, the slide should provide the board with an understanding of the company's preparedness to respond to cybersecurity incidents and the steps being
taken to mitigate the impact of any breaches.
78.
78
Board Reporting PackageContents
CEO & BOARD CHAIR
• CEO Update
• Board Chair Update
CORPORATE DEVELOPMENT
• Partnerships & Alliances
• Mergers & Acquisitions
• Post-merger Integration
OTHER CORPORATE
FUNCTIONS
• Intellectual Property
• Risk Management
• Legal & Regulatory
• Litigation
• Investor Relations
• Community Engagement
• ESG
• Sustainability
• Awards & Recognition
AGENDA
PRODUCT
MARKETING
• Financial Overview
• Income Statement
• Cash Flow Statement
• Balance Sheet
• Revenue Breakdown
• Operating Expenses Breakdown
• Cost Reduction Initiatives
• Profitability Analysis/ROI
• Working Capital Analysis
• Accounts Receivable
• Accounts Payable
• Capital Expenditures
• Capital Raising
• Debt Overview & Refinancing
• Tax
• Property & Real Estate Update
• Foreign Currency Exposure
• Product Development Overview
• Research & Development
• Product Roadmap
• Market Overview
• Marketing Initiatives
• Market Expansion
• Marketing ROI
• Pricing Strategy
• Data & Analytics
• Advertising
• Competitors
• Branding & Marketing Materials
• Website
• Social Media
• Industry Events & Conferences
• Public Relations
SALES
• Sales Pipeline
• Sales Team Performance
• Sales by Region
• Sales by Channel
• Channel Partners
CUSTOMERS
OPERATIONS AND SUPPLY
CHAIN INFORMATION TECHNOLOGY
HUMAN RESOURCES
• Operations Overview
• Supply Chain Management
• Emergency Preparedness
• Suppliers
• Worker Safety
• Customer Service
• Customer Acquisition
• Customer Retention
• Customer Satisfaction
• Consumer Insights
• Customer Case Studies
• IT Infrastructure
• Cybersecurity
• Human Resources Overview
• Organizational Structure
• Leadership Team Overview
• Talent Acquisition
• Compensation and Benefits
• Learning and Development
• Employee Engagement
• Employee Retention
• Diversity, Equity, and Inclusion
FINANCE
• Agenda
• Previous Meeting Minutes
79.
79
Partnership & Alliances
APartnership and Alliance Updates slide should include the following information:
1. A summary of any new partnerships or alliances formed during the quarter, including the name of the partner or ally and the purpose of the partnership.
2. Information on the terms of the partnership or alliance, including any financial or strategic benefits to the company.
3. Details on how the partnership or alliance is expected to impact the company, including anticipated revenue growth, market expansion, or other benefits.
4. Any updates on the progress of existing partnerships or alliances, including any challenges or opportunities that have arisen.
5. Visual aids, such as charts or graphs, to illustrate the impact of partnerships and alliances on the company's financial and strategic goals.
6. Concluding remarks on the overall success of partnerships and alliances during the quarter, and any plans for future partnerships or alliances.
80.
80
Mergers & Acquisitions
1.An overview of any acquisitions made during the quarter, including:
• The name of the company acquired
• The purchase price of the acquisition
• Any financial or strategic goals of the acquisition
• Any synergies or cost savings achieved as a result of the acquisition
• Any progress made on integrating the acquired company into the existing business
2. A graph or chart illustrating the financial impact of the acquisition on the company, such as:
• Revenue growth
• Earnings per share (EPS)
• Return on investment (ROI)
• Other relevant financial metrics
3. An analysis of the performance of the acquired company, including:
• Any strengths or weaknesses identified
• Any opportunities for growth or expansion
• Any potential risks or challenges associated with the acquisition
4. A discussion of any future plans for the acquired company, such as:
• Expansion into new markets
• Product development or innovation
• Integration into existing business units or product lines
Overall, the Acquisition Overview slide should provide a comprehensive overview of any acquisitions made during the quarter and the impact they have had on
the company's financial performance and strategic direction.
81.
81
Post-merger Integration
This slideprovides an update on the post-merger integration process. This would include details on any challenges faced and progress made during the
quarter. The following information should be included:
1. Overview of the merger: A brief overview of the merger, including the companies involved, the date of the merger, and the strategic rationale behind it.
2. Integration plan: A summary of the integration plan, outlining the key objectives and milestones for the integration process.
3. Progress update: An update on the progress made in the integration process during the quarter, highlighting any achievements or challenges faced.
4. Challenges: Any challenges faced during the integration process should be discussed, including any unexpected delays or issues that have arisen.
5. Mitigation strategies: Strategies to mitigate any challenges faced during the integration process should be presented, highlighting any actions taken to
address issues and ensure the integration remains on track.
6. Key metrics: Key metrics to measure the success of the integration process should be included, such as cost savings, revenue growth, and employee
retention rates.
7. Next steps: Next steps in the integration process should be outlined, including any upcoming milestones or objectives, and any potential risks or challenges
that need to be addressed.
82.
82
Board Reporting PackageContents
CEO & BOARD CHAIR
• CEO Update
• Board Chair Update
CORPORATE DEVELOPMENT
• Partnerships & Alliances
• Mergers & Acquisitions
• Post-merger Integration
OTHER CORPORATE
FUNCTIONS
• Intellectual Property
• Risk Management
• Legal & Regulatory
• Litigation
• Investor Relations
• Community Engagement
• ESG
• Sustainability
• Awards & Recognition
AGENDA
PRODUCT
MARKETING
• Financial Overview
• Income Statement
• Cash Flow Statement
• Balance Sheet
• Revenue Breakdown
• Operating Expenses Breakdown
• Cost Reduction Initiatives
• Profitability Analysis/ROI
• Working Capital Analysis
• Accounts Receivable
• Accounts Payable
• Capital Expenditures
• Capital Raising
• Debt Overview & Refinancing
• Tax
• Property & Real Estate Update
• Foreign Currency Exposure
• Product Development Overview
• Research & Development
• Product Roadmap
• Market Overview
• Marketing Initiatives
• Market Expansion
• Marketing ROI
• Pricing Strategy
• Data & Analytics
• Advertising
• Competitors
• Branding & Marketing Materials
• Website
• Social Media
• Industry Events & Conferences
• Public Relations
SALES
• Sales Pipeline
• Sales Team Performance
• Sales by Region
• Sales by Channel
• Channel Partners
CUSTOMERS
OPERATIONS AND SUPPLY
CHAIN INFORMATION TECHNOLOGY
HUMAN RESOURCES
• Operations Overview
• Supply Chain Management
• Emergency Preparedness
• Suppliers
• Worker Safety
• Customer Service
• Customer Acquisition
• Customer Retention
• Customer Satisfaction
• Consumer Insights
• Customer Case Studies
• IT Infrastructure
• Cybersecurity
• Human Resources Overview
• Organizational Structure
• Leadership Team Overview
• Talent Acquisition
• Compensation and Benefits
• Learning and Development
• Employee Engagement
• Employee Retention
• Diversity, Equity, and Inclusion
FINANCE
• Agenda
• Previous Meeting Minutes
83.
83
Intellectual Property
A slidefor Intellectual Property Updates should include the following information:
1. Overview of the company's intellectual property portfolio, including the number of patents, trademarks, and copyrights owned by the company.
2. Details of any new patents, trademarks, or copyrights filed during the quarter, including the type of intellectual property, the purpose, and any progress
made.
3. Updates on the status of pending intellectual property applications, including any rejections or objections received from the relevant authorities.
4. Information on any licensing agreements or infringement lawsuits related to the company's intellectual property.
5. Analysis of the competitive landscape with respect to the company's intellectual property, including any new entrants, potential threats, and opportunities
for expansion.
84.
84
Risk Management
1. Introduction:A brief introduction to the importance of risk management in business and why it's being discussed in the board report.
2. Risk management initiatives: An overview of the risk management initiatives undertaken during the quarter. This could include:
• Identification of potential risks
• Assessment of the likelihood and impact of each risk
• Implementation of risk mitigation strategies
• Regular monitoring and review of risks
3. Identified risks: A summary of any identified risks during the quarter, including their likelihood and potential impact. This could be presented in a table or
chart format.
4. Risk mitigation strategies: A summary of the strategies put in place to mitigate identified risks, including their effectiveness.
5. Emerging risks: A discussion of any emerging risks that may affect the company in the future, along with any plans to mitigate those risks.
6. Conclusion: A brief conclusion summarizing the company's overall risk management efforts and any action items for the board to consider.
85.
85
Legal and Regulatory
1.Overview of any legal or regulatory changes affecting the company during the quarter, including the nature of the changes and their impact on the
company.
2. Details on any litigation the company has been involved in, including the status of the cases and any potential impact on the company.
3. Discussion of any new regulations that may impact the company, including an analysis of potential risks and opportunities.
4. Updates on any compliance issues or regulatory inquiries the company may be facing, along with details on any actions being taken to address these issues.
5. Analysis of any other legal or regulatory developments that may impact the company, including changes in government policies or regulations in the
industry.
6. Visual aids such as charts and graphs to help illustrate the key points and trends.
86.
86
Litigation
1. Summary ofongoing litigation: A summary of any ongoing litigation affecting the company, including the nature of the claims, the parties involved, and
the status of the litigation.
2. Summary of new litigation: A summary of any new litigation affecting the company, including the nature of the claims, the parties involved, and the status
of the litigation.
3. Financial impact: An assessment of the potential financial impact of the litigation on the company, including any provisions or accruals made in the
financial statements.
4. Mitigation strategies: An overview of any strategies or actions being taken to mitigate the risks associated with the litigation, including any settlement
discussions, insurance coverage, or other legal remedies.
5. Next steps: A summary of the next steps in the litigation process, including any upcoming court dates, settlement conferences, or other key milestones.
87.
87
Investor Relations
1. Introduction:A brief overview of the company's investor relations strategy for the quarter.
2. Key Performance Indicators: A section that includes key performance indicators (KPIs) for the quarter, such as the number of investor meetings held, the
number of new institutional investors, and the percentage of shares owned by insiders.
3. Financial performance: A section that includes an analysis of the company's financial performance during the quarter, including revenue, net income, and
earnings per share. This section should also highlight any significant financial events, such as a new funding round or a major acquisition.
4. Capital expenditures: A section that details the company's capital expenditures for the quarter, including any major investments in new equipment,
facilities, or technology.
5. Investor communications: A section that summarizes the company's communications with investors during the quarter, including any press releases,
investor calls, or investor presentations.
6. Outlook: A final section that provides a brief outlook on the company's investor relations strategy for the next quarter and beyond. This section should
include any upcoming investor events or significant financial milestones.
88.
88
Community Engagement
1. Introduction:Provide a brief introduction to the importance of community engagement in the company's overall strategy and corporate social
responsibility initiatives. Explain how community engagement contributes to building positive relationships, enhancing brand reputation, and creating long-
term value for the company.
2. Community Partnerships: Highlight key partnerships and collaborations with community organizations, nonprofits, or local institutions. Include the names
of partner organizations, the nature of the partnership, and the objectives achieved through these collaborations.
3. Corporate Philanthropy: Outline the company's philanthropic efforts and contributions to the community. Mention significant donations, grants, or
sponsorships provided by the company to support local causes, education, healthcare, arts, or other areas of importance. Highlight the impact and
outcomes achieved through these philanthropic initiatives.
4. Employee Volunteerism: Showcase the company's employee volunteer programs and initiatives. Highlight the number of employees engaged in
volunteering activities, the total volunteer hours contributed, and the variety of community projects supported.
5. Community Development Projects: Highlight any community development projects initiated or supported by the company. Include details about
infrastructure improvements, educational programs, environmental sustainability initiatives, or other projects that have positively impacted the local
community. Mention key metrics or outcomes to demonstrate the effectiveness and success of these projects.
6. Community Engagement Events: List and describe significant events organized by the company to engage with the community. Include details about
community fairs, workshops, awareness campaigns, or other events aimed at fostering positive community relationships.
7. Stakeholder Engagement: Describe the company's efforts to engage with various stakeholders in the community. Highlight activities such as town hall
meetings, stakeholder consultations, or partnerships with local government bodies. Mention specific examples of how the company has incorporated
stakeholder feedback or addressed concerns.
8. Metrics and Impact: Provide relevant metrics and data to demonstrate the impact of the company's community engagement efforts. Include quantitative
measures such as the number of beneficiaries, volunteer hours, funds allocated, or social impact indicators. Incorporate qualitative measures, such as
testimonials or success stories.
9. Conclusion: Summarize the key points mentioned in the slide. Reiterate the company's commitment to community engagement and the importance of
building sustainable and mutually beneficial relationships with the community.
89.
89
Environmental, Social, andGovernance (ESG)
1. Overview of CSR initiatives: A brief overview of the company's ESG goals and CSR initiatives during the quarter and how they align with the overall strategy.
2. Environmental initiatives: An overview of the company's environmental initiatives during the quarter, including progress on reducing carbon footprint,
waste reduction, and any other relevant initiatives. This can be presented through charts or graphs showing data on energy consumption, greenhouse gas
emissions, or waste reduction.
3. Social initiatives: An overview of the company's social initiatives during the quarter, including progress on diversity and inclusion, community engagement,
and employee volunteer programs. This can be presented through charts or graphs showing data on workforce diversity or community engagement
metrics.
4. Governance initiatives: An overview of the company's governance initiatives during the quarter, including progress on board diversity, executive
compensation, and compliance with relevant regulations. This can be presented through charts or graphs showing data on governance metrics.
5. Impact reporting: A summary of the company's impact on the environment, society, and governance. This can be presented through a report that includes
data on the company's ESG performance and any relevant case studies.
6. ESG ratings and rankings: Any updates on the company's ESG ratings and rankings, including any new awards or recognition. This can be presented
through a chart or graph showing the company's rating compared to peers or industry benchmarks.
7. Progress update: A detailed update on the progress made towards achieving the company's CSR goals, such as reducing carbon emissions, promoting
diversity and inclusion, and supporting local communities.
8. Metrics and KPIs: Key performance indicators and metrics that measure the effectiveness of the CSR programs. These may include environmental impact
metrics, employee engagement metrics, and community impact metrics.
9. Case studies: Examples of successful CSR initiatives implemented by the company during the quarter, highlighting their impact on the company, employees,
and communities.
10.Future plans: An outline of the company's future plans for CSR initiatives, including any new programs or changes to existing programs that are planned for
the next quarter or year.
11.Challenges and risks: A discussion of any challenges or risks that the company faced during the quarter in implementing CSR initiatives, and how these
were addressed or mitigated.
90.
90
Sustainability
1. Overview ofthe company's sustainability strategy, including goals and targets related to reducing carbon emissions, waste reduction, sustainable sourcing,
and other sustainability initiatives.
2. An update on progress toward achieving sustainability goals, including any notable achievements or challenges encountered during the reporting period.
3. An overview of any new or ongoing sustainability initiatives, such as the adoption of renewable energy sources or the implementation of sustainable
packaging.
4. A summary of the company's environmental impact, such as carbon footprint or waste generation, and any changes from previous reporting periods.
5. Any social responsibility or governance initiatives that the company has undertaken during the reporting period, such as diversity and inclusion programs,
ethical sourcing practices, or board-level governance changes to promote sustainability.
6. Examples of stakeholder engagement on sustainability topics, including customer feedback, investor inquiries, or participation in industry-wide
sustainability initiatives.
7. Key performance indicators (KPIs) related to sustainability, such as energy usage or waste reduction, and progress toward achieving those KPIs.
8. A conclusion summarizing the company's overall sustainability performance and future outlook for sustainability initiatives.
91.
91
Awards & Recognition
1.Introduction: Provide a brief introduction to the significance of awards and recognition in building brand reputation and enhancing stakeholder confidence.
2. Key Awards and Recognition: Display the company's most prestigious awards and recognition prominently. Include the awarding bodies, year of
recognition, and a concise description of each accolade. Emphasize awards that are relevant to the industry, demonstrate excellence, or highlight significant
achievements.
3. Industry Awards: List industry-specific awards received by the company. Categorize them by relevant sectors, such as product/service excellence,
innovation, customer satisfaction, environmental sustainability, etc. Mention the awarding organizations, year, and a brief description of each accolade.
4. Customer Awards and Testimonials: Include awards or accolades received from customers or client organizations. Highlight significant partnerships or
collaborations that resulted in recognition. Incorporate relevant customer testimonials or positive feedback to showcase the company's commitment to
customer satisfaction.
5. Employee Recognition: Acknowledge and celebrate employee achievements and recognition programs within the company. Highlight notable employee
awards, such as employee of the month, team of the year, or exceptional performance recognitions. Include relevant metrics, such as employee satisfaction
ratings or retention rates, to demonstrate the positive impact of employee recognition initiatives.
6. Media Recognition: Showcase positive media coverage, reviews, or mentions received by the company. Include notable publications, journalists, or media
outlets that have recognized the company's achievements or featured its products/services. Highlight key articles, interviews, or reviews that positively
impact the company's reputation.
7. Social Responsibility Recognition: Display awards or recognition related to the company's corporate social responsibility efforts. Highlight initiatives in
areas such as philanthropy, sustainability, community engagement, or diversity and inclusion. Mention awarding bodies, year, and a brief description of each
recognition.
8. Conclusion: Summarize the key points mentioned in the slide. Reinforce the importance of awards and recognition in demonstrating the company's
excellence, reputation, and commitment to various stakeholders.
93
Umbrex is thefastest way to find the right
independent management consultant.
Find a consultant now
94.
94
Why Umbrex?
Founded byMcKinsey alums, Umbrex provides rapid access to independent management consultants with experience at top-
tier consulting firms.
Over 90% of Umbrex consultants are alums of McKinsey, Bain, or BCG.
The majority also have experience in industry roles. Why should you consider working with Umbrex?
Because you need
top-tier consultants.
You need the caliber
of consulting talent
that you would find at
the highest-ranked
global firms - without
all the overhead.
You want a flexible
solution tailored to
your needs
You need someone to
start ASAP.
You don’t want to
spend time sorting
through 40 resumes.
Find a consultant now
96
Industries Umbrex Serves
•Aerospace & Defense
• Agriculture
• Automotive
• Biotechnology
• Chemicals
• Consumer Packaged Goods
• Cosmetics & Personal Care
• Education
• Energy
• Financial Services
• Healthcare
• Insurance
• Manufacturing
• Media & Entertainment
• Medical Devices
• Metals & Mining
• Nonprofit
• Oil & Gas
• Pharmaceuticals
• Private Equity
• Professional Services
• Pulp and Paper
• Real Estate & Construction
• Restaurant
• Retail
• Social Sector & NGOs
• Software
• Technology
• Telecommunications
• Travel & Logistics
• Waste Management
• Wine, Beer, and Spirits
Find a consultant now
97.
97
Umbrex offers flexibleoptions to engage talent
Location
Seniority
Number of consultants
Time commitment
20-80% 100%
Hourly
Team
Individual
Associate
Manager
Partner
On-site
Remote
Find a consultant now
98.
98
Join our community
Wecreate opportunities for our members to meet,
build relationships, share lessons learned, and collaborate
Umbrex connects you with a community of
other top-tier independent consultants
Free access to resources
Mastermind Groups
In-person events Private online forum
Online events
100
Umbrex thought leadership
ProduceUnleashed, the leading
podcast on how to thrive as an
independent professional
Managing Partner Will Bachman
recognized as a “Power Player
Consulting” by Business Insider
Invited speaker on independent
consulting at business schools including
Harvard, Wharton, Columbia, and Kellogg
Over 1,000 consultants have
used our video guide to set up
their own practice
Organized over 300 events for
independent consultants
Find a consultant now
101.
101
How Umbrex canhelp
For Consultants
For Clients
Find a consultant now Join our community
102.
102
Umbrex provides resourcesto help consultants thrive
Guide To Setting Up Your Own Practice
How to Build a Consulting Website
How to Write a Consulting Proposal: Guide and Templates
How To Set Consulting Fees LinkedIn for Consultants: Best Practices to Optimize Your Profile
How To Find Clients For Your Consulting Practice
And dozens more
Access resources