Download to read offline

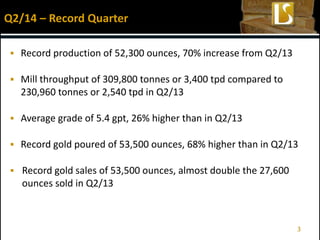
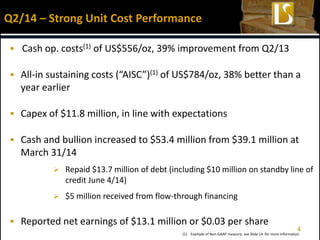
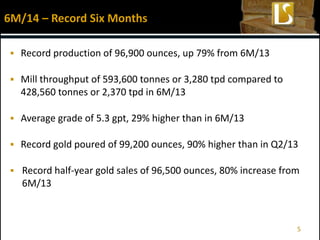
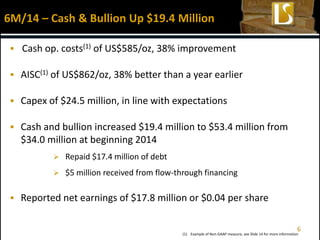
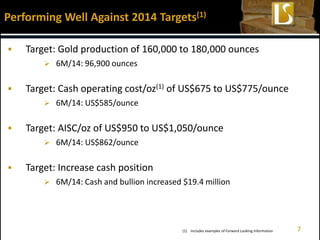
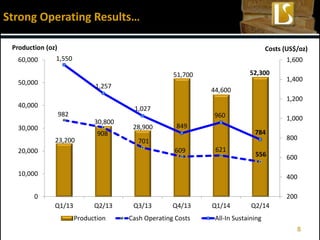
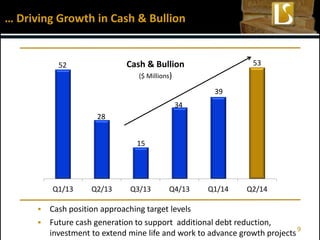
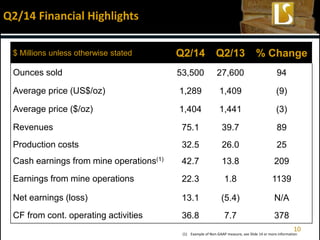
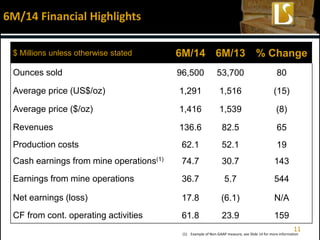
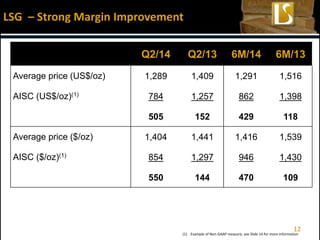
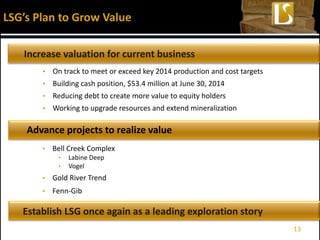

Lake Shore Gold reported record production and financial results for the second quarter and first half of 2014. Production in Q2 2014 reached a record 52,300 ounces, a 70% increase over the prior year quarter. Cash costs and all-in sustaining costs saw significant improvements of 39% and 38%, respectively, compared to Q2 2013. The company also reported record cash flow from operations and increased its cash position to $53.4 million.


![[ls머트리얼즈]LS Materials 417200 Algorithm Investment Report](https://cdn.slidesharecdn.com/ss_thumbnails/lsmaterials417200algorithminvestmentreport-260202182715-66072c7b-thumbnail.jpg?width=640&height=640&fit=bounds)

