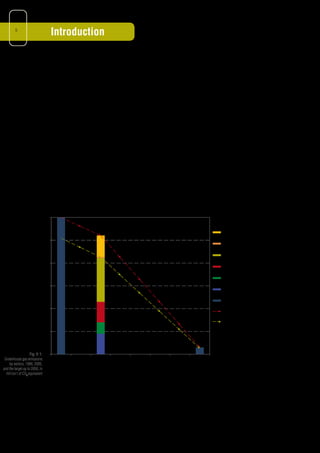
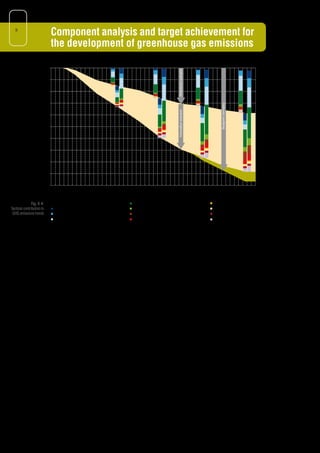
Blueprint
Germany
A strategy for a climate safe 2050
Preface


Putting the target first


Climate change is one of the greatest challenges which we face and which must be tackled in order
to sustain a living planet. To limit global warming to less than two degrees compared to pre-industrial
times, global greenhouse gas emissions must be reduced by 80 percent compared to 1990
levels. Industrial nations must even reduce their greenhouse gases by 95 percent by the year 2050.
Without such reductions in greenhouse gas emissions, humanity will rapidly head to a global
warming of up to seven degrees. The consequences would be disastrous.


A change of course is not yet in sight. Year after year, global emissions continue to rise rather than
decline. We can no longer afford to discuss ambitious reduction targets as a mere utopia. Never
before has this utopia been transformed into a thorough policy programme which is based on con-
crete measures and instruments up to the year 2030. The study presented by WWF Germany is the
first to address this issue. We are breaking new ground and are putting the target first. This is the
only way to protect our stability, security, prosperity and jobs.


‘Blueprint Germany’, which has been prepared by Prognos, Öko-Institut and Dr. Ziesing on behalf
of WWF, shows that the transformation from a high-carbon to a low-carbon economy is possible
and affordable. By committing to this transformation path, Germany could become a model for
other countries.


‘Blueprint Germany’ does not claim to show the only way. It does, however, identify one way which,
together with intensified innovation efforts, can lead to reaching the target on a sustainable basis.
There is no better time than now for setting the right course for the future – not least of all because
most greenhouse gas reduction potentials are linked to very long-term investment and infrastructure
decisions. Furthermore, ambitious climate policy must cover all sectors with immediate effect. Any
short-sighted policy geared towards seemingly low-cost reduction options is misleading. Although
power generation, the building sector, road transport and industry are central fields of action,
agriculture and issues of land use will also have to be addressed in order to achieve the ambitious
minus-95-percent target.


WWF Germany wants this study to trigger a discussion about the future. The study provides many
new and interesting answers as well as raising many new questions, which have to be tackled now.
For WWF Germany, this analysis represents only the beginning of a systematic approach to these
questions and towards presenting answers in the near future. This is why WWF Germany will not
only monitor, but will also actively drive this necessary transformation process.


Eberhard Brandes                                   Regine Günther
CEO WWF Germany                                    Director Climate and Energy Policy
Prepared by Prognos/Öko-Institut and
                                                           Dr. Hans-Joachim Ziesing for WWF Germany.


                                                                                        Contents

                                                                                           Introduction   4


                                                                        Total greenhouse gas emissions    6


               Component analysis and target achieval for the development of greenhouse gas emissions     8


Targets and strategic approaches towards achieving the climate protection goals of the Blueprint Germany 10


                                                                                       Framework data 12


                                                                              Technology development 13


                                                                              Private household sector 14


                                                                                        Services sector 16


                                                                                       Industrial sector 17


                                                                                       Transport sector 18


                                                                              Final energy consumption 20


                                                                                  Electricity generation 21


                                                                           Primary energy consumption 23


                                                                                     Costs and savings 24


                                                              Energy-related greenhouse gas emissions 25


                                                      Other greenhouse gas emissions by other sectors 27


                           Key elements of an integrated climate protection and energy programme 2030 28


        Conclusions and outlook: changes in energy and climate policy, innovation and global frameworks 29


                                                          Table of abbreviations, acronyms and symbols 31
4


        5
                                                          Introduction

                                                          In order to keep global climate warming below 2°C compared to pre-industrial levels, anthropogenic
                                                          emissions of greenhouse gases will have to be cut drastically world-wide by 2050. The only way to
                                                          achieve an international coordinated path is if industrialised nations reduce their emissions to such
                                                          an extent that this will leave emerging countries some “leeway in the greenhouse gas account” to
                                                          develop their economies and wealth further.


                                                          For Germany, this 2050 target means a reduction of greenhouse gases by approx. 95% compared
                                                          to 1990 emission levels. In other words, less than one tonne of greenhouse gases per capita may be
                                                          emitted by 2050. Latest scientific findings state that from 2005 to 2050 a global budget of around
                                                          800 billion tonnes of CO2 emissions or respectively 1,230 billion tonnes of CO2 equivalents for all
                                                          greenhouse gas emissions is available in order to keep the increase of global temperature to below
                                                          2°C compared to pre-industrial levels.
                                                          How can and must a highly industrialised and technology-based society be transformed in order to
                                                          reach this goal? Which technical measures and political instruments are required if economic growth,
                                                          safety and comfort are to be warranted in the future? Will we have to make sacrifices or can we
                                                          replace quantity by quality?
                                                          Since 1990, targets have been pursued in energy and climate policy and the related instruments
                                                          implemented. A brief look at the as-is situation clearly shows that there is still a very long way to go
                                                          before we reach the 95% target (refer to Fig. K-1)

                                                  1.200


                                                                                                                                                   Non-energy GHG

                                                  1.000
                                                                                                                                                   Other energy-related GHG


                                                                                                                                                   CO2 – electricity generation
                                                                                                                                                   and other conversion
                                                   800
                                                                                                                                                   CO2 – transport
                   Million tonnes of equivalent


                                                                                                                                                   CO2 – industry
                                                   600
                                                                                                                                                   CO2 – households/services

                                                                                                                                                   Total GHG

                                                   400
                                                                                                                                                   Target line: Blueprint Germany

                                                                                                                                                   Target line: Energy-related
                                                                                                                                                   GHG emissions
                                                   200


                                                                                                    Source: Prognos/Öko-Institut 2009
                    Fig. K 1: 0
 Greenhouse gas emissions                                   1990                 2005       2010      2020       2030        2040       2050
    by sectors, 1990, 2005,
and the target up to 2050, in
  million t of CO2 equivalent
                                                          All sectors will have to make a huge contribution in order to reach this very ambitious goal. It becomes
                                                          clear that a huge boost in efficiency to reduce energy demand and the exhaustion of renewable
                                                          energy potentials will be needed.
                                                          WWF commissioned a working group including Prognos / Öko-Institut / Dr Ziesing to perform a
                                                          quantitative analysis of this issue for Germany. In addition to the question “what can and must
                                                          happen on the technological level and how does the corresponding policy look like?”, it is also
                                                          important to assess how far these solutions are from the currently discussed political path.
This is why two quantitative scenarios have been developed: one scenario with an ambitious con-
                                             tinuation of today‘s energy and climate protection policy (reference scenario) as well as an innovation
                                             scenario that investigates the transformation to a low-carbon society geared towards a 95% reduc-
                                             tion. The continuation of today‘s energy and climate protection policy clearly fails to reach the target
                                             by 2050 (refer to Fig. K - 2). The reference scenario is used as the basis when calculating the costs
                                             and identifying the instruments of the innovation scenario. The comparison of emission trends in the
                                             reference scenario and in the innovation scenario shows that considerable greenhouse gases re-
                                             ductions are feasible up to 2050 in all sectors. Despite this, the emission reduction target of 95%
                                             against 1990 cannot be achieved with the measures considered in these scenarios. The remaining
                                             reduction gap would have to be filled with measures that are beyond the general framework specified
                                             in the scenarios.


                                             With a selection of corresponding measures (refer to section “Component Analysis”), it is possible to
                                             describe a version of a “Blueprint Germany” in which emissions levels in 2050 are 95% below 1990.


                                        1990                   2000               2010         2020              2030               2040               2050
                                        0


                                                                                                                                                             Reference scenario
                                     -200
Million tonnes of CO2 equivalents


                                     -400


                                                                                                                                       ?
                                     -600


                                                                                                                                                             and Blueprint Germany
                                                                                                                                                   45%


                                                                                                                                                             Innovation scenario
                                     -800


                                    -1.000


                                              Source: Prognos/Öko-Institut 2009                                                Reduction target: 95%
                                    -1.200
                                              Savings – total up to 2005                                  Savings – energy-related, other emissions           Fig. K 2:
                                              Savings – private households                                Savings – volatile and process-related emissions    Reference scenario:
                                              Savings – commerce, trade and services sectors              Savings – product use                               emission reductions
                                              Savings – industry                                          Savings – agriculture                               broken down into sectors,
                                              Savings – transport                                         Savings – land use and forestry
                                              Savings – conversion sector, total                          Savings – waste management                          1990 – 2050, in million t
                                                                                                                                                              of CO2 equivalent


                                             Three strategy segments are distinguished for the development of long-term strategies necessary
                                             to implement the climate protection measures required in the “Blueprint Germany” version:
                                             • strategic goals, which serve as the basis for evaluating the target achievement up to 2050 as well
                                               as progress in the different sectors, both in general and with sufficient sectoral differentiation;
                                             • implementation strategies with which interaction between the different scopes of action up
                                               to 2050 will be addressed;
                                             • instrumentation strategies which contain the long-term guidelines for the political implementa-
                                               tion instruments.


                                             The following section describes emission trends and the structure of greenhouse gas emissions. The
                                             main contributions of the different sectors to reduce emissions are then broken down and strategic
                                             goals are subsequently identified.
                                             Based on this, the most important assumptions and results of the innovation scenario as well as the
                                             implementation strategies are presented sector by sector. In addition, a set of instruments is developed
                                             for the period up to 2030 that leads to the reduction in greenhouse gas emissions required in this period.
6


  7
                                                          Total greenhouse gas emissions

                                        1.400


                                        1.200
                                                                        -14%

                                        1.000
                                                                                         -26%
               Million tonnes of CO2 equivalents


                                                                                                 -35%
                                                   800
                                                                                                           -40%                      -41%
                                                                                                                        -45%

                                                   600
                                                                                                                                             -63%


                                                                                                                                                                          Source: Prognos/Öko-Institut 2009
                                                   400
                                                                                                                                                        -77%
                                                                                                                                                                   -87%
                                                   200


                                                     0

                                                                 As-is data                     Reference scenario                          Innovation scenario
                                                   -200
                                                          1990        2005              2020    2030     2040          2050         2020    2030      2040        2050

             Fig. K 3:                                     HFC, CFC and SF6 – total                      Waste management
 Total greenhouse gas                                      N20 – total                                   Agriculture
emissions 1990-2050
                                                           CH4 – total                                   Industrial processes
                                                           CO2 – industrial processes                    Energy-related emissions
                                                           CO2 – energy-related
                                                           CO2 – land use & forestry


                                                          Overall, very different trends are shown for total greenhouse gas emissions in the two scenarios:
                                                          • In the reference scenario, greenhouse gas emissions decline by around 36% in the 2005-2050
                                                            period. Compared to 1990, this corresponds to a reduction of around 45%. In 2050, percapita
                                                            GHG and CO2 emissions amount to approx. 9 and 8 tonnes respectively. GHG and CO2 emissions
                                                            accumulated since 2005 (in terms of a carbon budget) amount to approx. 38 and 34 billion tonnes
                                                            respectively.


                                                          • In the innovation scenario, emissions are reduced by around 85% in the 2005-2050 period. This
                                                            corresponds to a reduction of 87% compared to 1990. In 2050, per-capita GHG and CO2 emis-
                                                            sions amount to approx. 2.2 and 1.6 tonnes respectively; accumulated GHG and CO2 emissions
                                                            amount to approx. 26 and 22 billion tonnes respectively.


                                                          • In the Blueprint Germany, 2050 emissions are around 94% lower than in 2005; this corresponds
                                                            to a reduction of 95% compared to 1990. Total greenhouse gas and CO2 emissions per capita in
                                                            2050 amount to 0.9 and 0.3 tonnes respectively, although these values take into account remain-
                                                            ing greenhouse gas emissions and the creation of additional CO2 sinks through CCS in the area of
                                                            biomass (-0.4 tonnes of CO2 per capita). For the 2005-2050 period, accumulated GHG and CO2
                                                            emissions total approx. 24 and 21 billion tonnes.
Emission trends are characterised by the following developments:


Relevant polluter sectors:
• Energy-related emissions are and continue to be of paramount importance for the level of green-
  house gas emissions in Germany. Accounting for around 82% of total greenhouse gas emissions
  in 2005, this share falls to around 75% by 2050 in the reference scenario and to almost 62% in
  the innovation scenario. These developments also underpin the special role played by the energy
  sector in an ambitious climate protection strategy.


• The contribution made by process-related emissions (in this case without the iron and steel
  industry) rises in the reference scenario between 2005 and 2050 from 7% to almost 8%. This con-
  tribution falls to around 5% in the innovation scenario. This suggests that a considerable potential
  for reductions is also possible in the medium term in the area of process-related emissions.


• The increasing contributions from agriculture and land use and forestry over the period are an
  indication that the options for reducing emissions in these sectors are subject to much stronger
  limitations than in other sectors. In the reference scenario, for instance, the share of greenhouse
  gases from agriculture rises between 2005 and 2050 from 5% to 7%, and to more than 19% in the
  innovation scenario. Net contributions to emissions by the LULUCF sectors increase in the 2005-
  2050 period from 4% to around 9% in the reference scenario and to around 11% in the innovation
  scenario.


• Waste management has a less important role to play since its contribution to total greenhouse
  gas emissions is below 1% in the reference scenario and below 2% in the innovation scenario.


Relevant greenhouse gases:
• Carbon dioxide is the dominant greenhouse gas in both scenarios. In the reference scenario, the
  decline in the share of CO2 in total greenhouse gas emissions is very weak, i.e. from 89% to 88%.
  In the innovation scenario, the share falls from 89% to 75% between 2005 and 2050.


• The importance of nitrous oxide increases considerably. In the reference scenario, the share
  remains stable in the range of 5% to 6%; in the innovation scenario, N2O accounts for almost 16%
  of total greenhouse gas emissions in 2050.


• The share of methane emissions declines from 4.5% to 3.6% in the reference scenario between
  2005 and 2050. This share rises in the innovation scenario to around 8.5% in 2050.


• The emission trends of fluorinated greenhouse gases, which account for a share of 1.5% to 2%
  in the reference scenario and 1% in the innovation scenario, are of lesser importance.
8


   9
                                                                          Component analysis and target achievement for
                                                                          the development of greenhouse gas emissions

                                                                     0


                                                                                                                                                  Reference scenario
                                                                   -100
              Million tonnes of CO2 equivalents compared to 2005


                                                                   -200


                                                                   -300


                                                                                                                                                                                   Blueprint Germany
                                                                                                                                                  Innovation scenario
                                                                   -400


                                                                   -500


                                                                                                                                                                                                              Source: Prognos/Öko-Institut 2009
                                                                   -600


                                                                   -700


                                                                   -800

                                                                   -900


                                                          -1.000
                                                                          2005         2010                        2020                2030                             2040                           2050


               Fig. K 4:                                                    Demands                                       Renewable energies                                   Waste management
Sectoral contribution to                                                    Efficiency – electricity application          Electrificationcation                                Agriculture
 GHG emissions trends                                                       Efficiency – buildings                        Fuel change (fossil)                                 Land use and forestry
                                                                            Other energy efficiency                       Industrial processes                                 Others


                                                                          On the whole, a 45% reduction in emissions (based on 1990) is achieved by 2050 in the reference
                                                                          scenario. The reduction amounts to 51% without land use, land use change and forestry (LULUCF).


                                                                          In the innovation scenario, a reduction of 87% (89% without LULUCF) is achieved by 2050. By the
                                                                          year 2040, emission trends in the innovation scenario roughly correspond to the trend which would
                                                                          have to be pursued to achieve the 95% reduction target.


                                                                          In order to reach the emissions level of the Blueprint Germany, additional emission reduction meas-
                                                                          ures have to be identified in order to fill the remaining gap of approx. 97 million tonnes of CO2
                                                                          equivalent.


                                                                          A component analysis has been used to systematically compare the contributory effect of the
                                                                          different sectors or sources to emissions reductions in both scenarios. For the 2005-2050 period
                                                                          this results in:


                                                                          In the reference scenario,
                                                                          • the biggest reductions in emissions are achieved by various measures in the area of energy effi-
                                                                            ciency. By 2050, these measures will be responsible for around 46% of the total reductions in
                                                                            emissions whilst the most decisive contributions are made primarily by improved efficiency in the
                                                                            building sector and in industry;
                                                                          • the use of renewable energy accounts for a 29% share in emission reductions;
                                                                          • measures in the field of industrial process emissions make a considerable contribution with
                                                                            a share of around 3% o f emissions reduction whilst the cost-efficient reduction of N2O
                                                                            emissions in the chemicals industry, in particular, has an outstanding role to play.
In the innovation scenario,
• once again improved energy efficiency accounts for a contribution of 27% of additional emission
 reductions. The hugely increased efficiency of electricity applications is here decisive, since it
 accounts for around half of the total additional reduction in the field of energy efficiency;
• additional emission reductions are largely made through the huge increase in the use of renewable
 energy which cover a share of 37% of total additional emission reductions. Around 7 percentage
 points result from the indirect effects of transport electrification (which, in the innovation scenario,
 can also be interpreted as a contribution by renewable energy);
• emission reductions resulting from substitution in the field of fossil fuels are considerable and
 account for a share of 13% of additional emission reductions;
• measures in the field of carbon sinks contribute around 4% to additional emission reductions.


In the innovation scenario, the increase in energy efficiency and the increase in the use of renewable
energy (both in the order of 35% by 2050) contribute to an almost equal extent (regarded as the
aggregate contributions of the reference and the innovation scenarios) to the total reduction of emis-
sions. Furthermore, significant contributions are also made, for instance, by the fuel switch in the case
of fossil fuels (9%) as well as emission reductions in industrial processes (6%), and in the field of soils
and forests (2%). Measures in all other areas (agriculture, etc.) add up to a share of 12% of total
emission reductions.


Around half of total additional emission reductions in the innovation scenario and around two thirds
of energy-related emission reductions up to the year 2050 are due to measures designed towards
particularly long-life capital stock (buildings, power stations, infrastructures, etc.). In their case it is
particularly important to introduce the necessary climate protection measures on time. Similarly,
around half of the emission reductions of the innovation scenario which will come into effect by 2050
are related to measures which will require considerable innovation (technology, costs, system inte-
gration) over the coming years.


Moreover, in the “Blueprint Germany”:
• the significant base of industrial CO2 emissions that remains can be cut by around another
 16 million tonnes of CO2 through the use of CCS in relevant industrial processes (pig iron
 production, cement production);
• the remaining process heat demand and natural gas and heating oil applications in the commerce,
 trade and services sectors can be replaced by the use of biomethane; this would result in an addi-
 tional reduction of approx 25 million tonnes of CO2 emissions, but – in view of availability limits –
 would require the integration of a higher-level biomass strategy or corresponding complementary
 measures in the transport sector;
• the wide replacement of conventional fuels with biofuels in aviation could additionally reduce emis-
 sions by approx. 22 million tonnes of CO2; the corresponding additional fuel quantities would have
 to be supplied by more extensive approaches in passenger transport (avoidance/shift as well as
 increase in electrification by around 20% in each case), in road freight transport (avoidance/shift of
 around 20%) or by biomass imports;
• an additional carbon sink of up to 32 million tonnes of CO2 equivalents can be achieved by storing
 carbon dioxide from biofuel production in geological formations.


These additional measures make the path for the “Blueprint Germany” possible and the reduction
target of 95% can be achieved. If the reduction in emissions is put into relation with the emissions
level without LULUCF, this results in a 96% reduction in emissions including the additional measures.
10


11
                    Targets and strategic approaches
                    to achieve the climate protection goals
                    of the Blueprint Germany
The analysis of the innovation scenario and the additional potentials        • A very high share of the additional emission reductions required (also
required in the “Blueprint Germany” provide the following strategic           around 60%) is expected, especially after 2030, to come from emis-
framework to achieve the targets:                                             sion reduction options where significant innovation still has to be
• a reduction of total greenhouse gas emissions by 40% by 2020,               achieved in terms of technology, costs and system integration/infra-
 60% by 2030, 80% by 2040 and 95% by 2050 (based on 1990);                    structure. This applies especially to electricity generation based on
• an improvement of overall economic energy productivity by 2.6%              renewable energy, electricity storage and infrastructure, the generation
 p.a.;                                                                        of sustainable biofuels and the provision of sustainably generated
• an increase in the share of renewable energy sources in overall             biomethane, energy efficiency in industry, energy efficiency in con-
 primary energy to 20% by 2020, 35% by 2030, 55% by 2040 and                  ventional and electric vehicles as well as CCS technology.
 by more than 70% by 2050.
                                                                             • Advances for a range of central emission reduction options are in-
In order to control targets and to monitor the progress achieved, it          evitably linked to complementary options; without systematically
makes sense to put safeguards in place for the different sectors. The         designed strategy approaches the reductions aimed at could fail:
respective sector-specific targets will be identified in the individual
sector chapters.                                                              - Electrification of motorised individual traffic is inevitably linked, on
                                                                                the one hand, to the development of additional options for electric-
Between the individual options for greenhouse gas reductions and in             ity generation based on renewable energies (or CCS) and, on the
the context of ambitious climate protection strategies, a series of sys-        other, on the creation of intelligent electricity grids.
tem connections and interactions have to be considered which must
also be taken into consideration in the strategic shaping of the              - The massive use of biofuels in road and air transport requires the
respective climate protection and energy policies:                              availability of biofuels which meet high sustainability standards.


• In all sectors, significant effort must be made to reduce emissions.        - The use of decentralised efficiency technologies which initially run
 However, considering the scale of the contributory effects required,           on natural gas (e.g. decentralised cogeneration), as well as the
 measures in the electricity sector (demand and generation), in the             switch of industrial process heat generation to renewable energies
 building sector (new and existing buildings), in motorised private             require in the medium to long term the availability of considerable
 transport, road freight transport, in air transport, in industry (includ-      quantities of biomethane that is fed into the gas grids.
 ing process emissions), in agriculture and in the field of land use and
 forestry are particularly important.                                        • The introduction of new electricity generation options as well as the
                                                                                                                      -

                                                                              creation of capacities for modal shift require a long-term approach
• It will not be possible to achieve the emission reduction targets by        in the respective infrastructure development (transport and distri-
 2050 without significant advances in energy efficiency, nor without          bution network, CO2 infrastructure for CCS, rail network).
 a huge increase in the share of renewable energy.
                                                                             • Limits to potential must be considered for at least two central emis-
• A very high share of the additional emission reductions required            sion reduction options, i.e. the use of biomass and the introduction
 (around 60%) is related to long-life capital stock (buildings, power         of CCS, and a suitably active approach must be pursued for
 stations, infrastructures, etc.). Delays in implementing measures will       strategic resource management:
 mean that the target will not be reached or that the costs of climate
 protection policy will rise very steeply. This is why measures are           - If for the transformation switch of the energy system in to biomass is
 urgently required over the course of time in the field of electricity          to be primarily restricted to the – limited – domestic or European po-
 demand (efficiency on the one hand and electrification on the other),          tential, sustainability requirements will have to be met. The use of bio-
 electricity generation, buildings (new and existing buildings), infra-         fuels is justifiable only on condition that these are sustainably
 structures (electricity, gas, heat, CO2, transport) as well as in the          cultivated in both social and ecological terms and according to
 transport shift.                                                               legally binding regulations and standards. Adherence to minimum
standards for sustainability must be assessed and guaranteed through       • In all areas, the political implementation measures must also promte
  certification systems. Internationally coordinated, binding regulations     a continuous and targeted innovation process in order to bring
  and minimum standards that warrant the sustainability of agricultural       climate protection options to market maturity as quickly as possible.
  resources are vital if the use of biofuels is to be expanded. When these    Support measures for early market introduction processes have an
  preconditions are fulfilled, priorities for use must be established and     important role to play here.
  monitored. In addition to usage priorities also the generation of bio-
  mass is of utmost importance in the framework of an all-encompass-         • The significant pricing of greenhouse gas emissions forms the
  ing biomass strategy. The conversion of waste and residues should be        necessary basis for an ambitious and successful climate policy.
  prioritised over the cultivation of energy plants.
                                                                             • If climate protection options with a significant solution potential are
 - Regarding biomass, priority must be given to applications that lack        not compatible with the applicable market structures (such as fluc-
   sufficient alternatives. This applies, on the one hand, to the remain-     tuating supplies of large electricity quantities from renewable energy
   ing fuel use in road transport (after extensive electrification of         sources), then the market structures must be gradually adjusted.
   motorised individual transport) and to air transport. Process heat
   applications (especially in industry) should be seen as the next          • Regulatory approaches make sense and are necessary for very
   priority, only then to be followed by electricity generation from          homogenous technologies and/or climate protection options as
   biomass. Regarding the use of biomass to generate electricity,             far as special support measures are needed.
   stricter efficiency requirements apply: generating electricity from
   biomass without using cogeneration is not compatible with a long-         • As far as market developments in the field of long-life capital stocks
   term climate protection and energy strategy.                               could lead to lock-in situations that in the long term prevent the
                                                                              achievement of ambitious climate protection targets, suitable regu-
 - The storage available for CCS is a limited resource (also in terms of      latory measures should be adopted.
   competition to use the underground) for which use priorities and
   management approaches must be developed. Priority is given                • The creation of a robust and sustainable energy efficiency market
   here to process-related CO2 emissions and the use of storage for           is vital for the broad and significant increase in energy efficiency.
   carbon dioxide from biomass conversion processes (production of
   biofuel, generation of electricity from biomass). This prioritisation     • The development of infrastructures for the energy and transport
   should also be considered when addressing the question as to               systems must be planned and pushed ahead with a long forerun
   which contribution is to be assigned to CCS in electricity genera-         and hence with considerable uncertainties. This will lead to a special
   tion in the climate protection and energy strategy.                        (new) field of government responsibility.


• The climate-friendly conversion of the energy and transport system         Finally, a careful analysis of the long-term implementation strategies and
 requires considerably improved efficiency in the use of energy-inten-       the short to medium-term political instruments must take into account
 sive materials and products.                                                the consistency of short-term, medium-term and long-term solution
                                                                             contributions. Not all approaches which will no longer be relevant in the
With a view to the political implementation tools which will and             long-term target structures are automatically problematic in the short to
must change in terms of direction and design, the following strategic        medium term (e.g. the distribution of fossil energy generation with a
approaches are of higher and more long-term importance:                      biogas potential that is limited in the long term). What is central here are
                                                                             the medium-term switch strategies and the precondition that no contra
• Securing a sufficiently diverse range of players and competitive           productive structures are created in the short to medium term. At the
 markets forms a key precondition for the development of robust              same time, the solutions required in the long term can lead to problem-
 and efficiently designed climate protection paths. An insufficiently        atic structures (e.g. biofuels with insufficient sustainability standards).
 diverse range of players increases the risk of lock-in effects and          Targeted policy and innovation approaches with clearly defined time
 could hinder or delay the innovation processes required.                    horizons are vital in these areas.
12


       13
                                Framework data
                        3.500                                                                                                        90
                                                                                                              Source: Prognos 2009

                                                                                             82,5                                    80
                        3.000                                                                              78,6
                                                                 2.981
                                                                2.981,0
                                                                                                                          72,2       70
                        2.500                     2.598
                                                                                                                                     60


                                                                                                                                          In million people
                        2.000       2.124
                                                                                                                                     50
              in bn €


                        1.500                                                                                                        40


                                                                                                                                     30
                        1.000
                                                                                                                                     20

                         500
                                                                                                                                     10


                  Fig. K 5: 0                                                                                                        0
  Framework development:            2005          2030          2050                        2005          2030           2050
 gross domestic product in
billion€ and population in                         Gross domestic product                            Population
     millions, 2005 to 2050

                                The framework data describes the assumptions regarding aBevölkerung
                                              Bruttoinlandsprodukt                       few macroeconomic variables
                                underlying the scenarios.


                                Despite average net immigration figures of approx. 150,000 persons p.a. for the period from
                                2005 to 2050, population figures will decline by 12.5% over that period, which represents about
                                10 million people.
                                Ageing will continue: The group of people over the age of 65 grows by 6.2 million while the number
                                of people under the age of 65 will fall in total by 16.5 million. In 2050, there are 12.5 million fewer
                                people of working age (20 to 65 years old) than in 2005.
                                The average household size declines from 2.10 to 1.86 persons. One and two-person house-
                                holds increase by 3.2 million while the number of larger households declines significantly.
                                The average living space per capita moderately increases further, on the whole by 253 million m2.
                                New built homes are primarily one and two-family homes. Until 2030, the addition of living space
                                in new buildings surpasses the number of age-related withdrawals. After this, the trend reverses
                                and living space then declines in total by an average of 6.6 million m2 annually.
                                Gross domestic product (GDP) in 2050 is around one third above the level of 2005. Following the
                                crisis-related decline in 2009, the previously attained growth path is scarcely reached.
                                With a declining population, average increases in GDP between 2020 and 2040 are moderate.
                                GDP growth per capita will be higher, totalling between 0.6% p.a. for the period 2025 to 2030 and
                                1.4% p.a. for the period 2045 to 2050.
                                Unemployment will substantially decrease until 2050. Due to demographic change, the workforce
                                will decrease faster than employment opportunities.
                                The services sector is becoming increasingly important for economic growth. Between 2005 and
                                2050, gross value added increases by around 46%. In the period from 2005 to 2050, industry
                                grows by almost 20%. Energy-intensive industries, which in 2005 accounted for approx. 14% of
                                overall industry production, will reduce their output by 2050 by more than 20%. However other
                                industrial sectors will grow by around 44% in that period. This confirms the continuation of structural
                                change that has been taking place since the 1980s.
                                In face of the challenges ahead, industry will secure its international competitiveness through technical
                                progress, innovative and knowledge-based products as well as through internationally coordinated
                                collaboration in technology.
Passenger transport is and remains strongly marked by motorised individual mobility. Due to the
decline in population, absolute passenger transport performance declines by 10% between 2005
and 2050. Due to economic development and the ongoing increase in international trade, freight
transport performance increases by 86% between 2005 and 2050. Rail accounts for a considerable
share of this growth since freight transport by rail increases by 191% while freight and inland
navigation increase by only 67% respectively 47%. The share of rail transport in freight rises from
almost 17% in 2005 to 26.5% in 2050.
Air transport performance rises by 7% in the period under review by, hence much slower than
road freight.
The sustainable biomass potential (without competing with food production or generating a
reduction in the ecological quality of previously high-quality land) is very limited in Germany and is
estimated at approx. 1,200 PJ of primary energy. This rules out the idea of completely replacing
fossil fuels with bio-fuels. Instead, strategic approaches will be needed to use biomass products in
areas where there are no alternatives.


                                                Technology development
Current technology developments on the demand side will continue in the areas of energy and
material efficiency. The reference scenario however shows that the climate protection targets
cannot be reached with these technologies when applied in existing structures even if upgraded in
an ambitious manner. In order to reach the targets, systematic changes will also be needed in the
development of products, materials and production processes. Key technologies, above all (nano-
technology, biotechnology and microsystem technology), must be developed with energy and
material efficiency in mind. These new technologies can pose risks. Before being put to use, each
individual technology must hence be examined in terms of its sustainability. On the other hand,
efficiency developments beyond the scope of the reference scenario are inconceivable without
such qualitatively new technology developments and approaches.
The key new fields of technology in which innovation is needed and is assumed as implemented in
the innovation scenario, are, for example (only an illustration rather than a complete listing):
• New materials: energy efficient materials, tailored according to specific properties, which avoid the
 use of metals for static functions (e.g. for load-bearing skeletal structures in buildings or resistant
 skins for vehicles).
• High-performance thermal insulation which can be easily and extensively used in existing build-
 ings; specific, reactive window coatings which enable considerable savings in room heating in winter
 and reductions in radiation exposure in summer.
• New building materials based on plastic and composite materials.
• Biological production processes in the chemicals sector, e.g. using specialised bacteria or
 enzymes to synthesize substances; use of catalytic processes to reduce excitation energy.
• Microprocesses for producing special products “on the chip” (e.g. pharmaceuticals).
• Optoelectronics to boost the bandwidth, speed and performance density of electronic applica-
 tions; reduction of waste heat with increasingly more powerful IT applications.
• Miniaturisation of displays (visors instead of monitors).
• Optimised and efficient battery systems and power storage.
• Highly efficient production of biofuels of the second (and third) generation.
• Process optimisation and optimisation of building management through control and instru-
 mentation equipment.
• Grid optimisation and demand side management to balance out peak loads, to reduce power
 storage use and losses, and to integrate fluctuating renewable energy into the power system.
• Photovoltaics of the third generation (on an organic basis).
• High performance transport infrastructures thanks to information and communication technology.
• Carbon capture and long-term storage in secure geological formations (CCS).
14


       15
                                  Private households sector
                        3.000                                                                                                          100
                                                                                                             Source: Prognos 2009
                                                          Index – CO2 emissions
                                                                                                                                       90
                        2.500
                                                                                                                                       80

                                                                                                                                       70
                        2.000
                                                                                                                                       60


                                                                                                                                             Index
                        1.500                                                                                                          50
                 PJ


                                                                                                                                       40
                        1.000
                                                                                                                                       30

                                                                                                                                       20
                          500
                                                                                                                                       10

                    Fig. K 6: 0                                                                                                        0
  Final energy consumption         2005 2005               2020 2020              2030 2030      2040 2040               2050 2050
                                      2005                    2020                   2030            2040                   2050
by private households in the
 innovation scenario broken          Solar                    Biogas                Gas               Cooking                  Index – CO2 emissions
   down according to energy
    sources and uses, in PJ,         Environmental heat       District heating      Oil               Electrical appliances
                                                           Bruttoinlandsprodukt
          index of direct CO2        Wood                     Electricity           Coal              Hot water
    emissions, 2005 – 2050
                                                                                                      Heating


                                  In the private household sector, direct CO2 emissions fall by 98% from 212 million tonnes to
                                  3 million tonnes between 2005 and 2050.
                                  • The key to reducing emissions in this sector is to reduce space heating demand. Space heating
                                   is the one application where efficiency measures can lead to the by-far greatest share of savings
                                   in final energy, both in absolute and relative terms. Specific space heating demand in buildings
                                   will be reduced to almost zero both in new buildings and in existing buildings thanks to building
                                   measures (thermal insulation of the building shell and of windows). From 2025 / 2030 onwards,
                                   suitable materials will be available for standard application. The rate of refurbishment of existing
                                   buildings will double after 2012 from almost 1% to approx. 2% p.a.,, the energy-related standard
                                   of refurbishment from 2025 onwards corresponds to an ambitious new building standard.
                                   Specific space heating demand in new buildings is reduced successively in steps by approx.
                                   50% until it reaches almost zero after 2030.
                                  • Thanks to the use of further-enhanced, water-saving fittings, hot water consumption per capita
                                   falls by more than 10% with growing comfort. By 2050, energy demand for the generation of
                                   hot water will be reduced by 37% compared to 2005.
                                  • The efficiency improvements of household appliances will be strongly developed so that by
                                   2050 average specific energy consumption will have fallen by 70% to 80%. Magnetic refrigerators
                                   will be standard, as will be waterless washing machines, thus making tumble dryers superfluous.
                                   Despite the convergence of (electronic) media, other electric applications lead to an increase in
                                   the number of appliances in households. Specific energy consumption by electronic devices and
                                   appliances will fall by 70 to 80% primarily due to new display technologies; in total, electricity
                                   demand for electric appliances will fall by 40%.
In order to achieve the required reductions, the following strategic safeguards must be put in place:
• In the building sector
 - an average annual final energy consumption standard of 20 kWh per m2 should be achieved for
   space heating in new buildings starting around 2015, and decreasing to around 10 kWh per m2
   after 2020 with the goal of zero-energy or plus-energy houses after 2025
 - specific final energy consumption in existing buildings should be cut by more than half from
   2005 to 2030 and by around 90% by 2050;
 - the share of renewable energy or (directly) emission-free energy sources (district and local heat-
   ing) in overall energy for the remaining space heating and hot water generation should be
   increased to around 40% by 2030 and to at least 75% by the year 2050.


• The following implementation instruments can be derived from this for the time horizon
 until 2030:
 Building-specific instruments to boost energy efficiency
 - Stricter new building standards with a maximum, annual final energy consumption value for
   space heating of 20 kWh per m2 starting 2015, of 10 kWh per m2 starting 2020 and the zero-
   energy or plus-energy house standard from 2025 onwards;
 - Continuation and improvement of subsidy programmes for building refurbishment to secure
   refurbishment rates of more than 2% p.a. and long-term refurbishment efficiency of 90%.


• Energy efficiency programmes specifically for electricity
 - Consistently strict consumption limits for all electric appliances according to the top-runner
   principle (consumption values of the best appliances as minimum standards to be achieved
   by the next generation of appliances within five years);
 - Ban on night storage heating after a transition period of five years (accompanied by subsidy
   programmes).
16


    17
                          Services sector
                  1.600                                                                                                               100
                                                                                                               Source: Prognos 2009
                                                                                                                                      90
                  1.400
                                                       Index – CO2 emissions
                                                                                                                                      80
                  1.200
                                                                                                                                      70

                  1.000
                                                                                                                                      60


                                                                                                                                            Index
                    800                                                                                                               50
            PJ


                                                                                                                                      40
                    600

                                                                                                                                      30
                    400
                                                                                                                                      20

                    200
                                                                                                                                      10

                    Fig. K 7: 0                                                                                                        0
  Final energy consumption
                                     2005
                                     61,78212534 59,76954403 58,00007213 2030
                               63,0582195      60,77583469 202058,76325338 57,0746667
                                                                                    56,6289752            2040
                                                                                          56,22375889 53,00551107               2050
                                                                                                   54,66826609 51,77759654 48,78789829
by the services sector in the
innovation scenario, broken         Renewable (with biofuels)              Office equipment                   Index – CO2 emissions
 down according to types of         District heating                       Power
    use and energy sources,         Electricity      Bruttoinlandsprodukt  Process heat                 Bevölkerung
   in PJ, index of direct CO2       Gas                                    Lighting
    emissions, 2005 – 2050          Fuels (including biofuels)             Cooling and ventilation
                                    Oil                                    Heating
                                    Coal


                          Between 2005 and 2050, direct energy-related CO2 emissions in the services sector fall by 85% from
                          58 million tonnes to 8 million tonnes.
                          • The greatest part of this reduction is achieved in space heating. Specific space heating demand in
                           services buildings falls to almost zero by 2050 both in the case of new buildings and existing buildings.
                           Since buildings in the commercial sector are more likely to be torn down rather than refurbished, the
                           turnover of buildings is higher than for private households.
                          • Due to cooling demand as a result of global warming, final energy demand for air conditioning
                           increases. This will be kept in check by the highly efficient production of cold (e.g. with heat pumps
                           and the use of renewable energy sources and waste heat).
                          • When it comes to providing process heat and power, the possibilities for saving energy are physi-
                           cally limited. Shifts in technology, both in the case of process design and in the organisation of services,
                           will help to achieve a 17% decline in process heat demand despite an almost 50% increase in value
                           added. Sterilisation with UV light, water-free washing machines, etc. are some examples of savings.
                          • When it comes to power applications, the most efficient cross-section technologies will be used for
                           electric motors, pumps and compressed air. Moreover, material-efficient processes and altered ma-
                           terials (e.g. in vehicle construction) will be used in a targeted manner and will reduce specific demand
                           for mechanical energy for each value added unit by up to 80%. This reduces energy demand for
                           power applications by almost 52%.
                          • Total final energy demand in the services sector in 2050 is 66% below the 2005 level. Almost half
                           of the remaining demand will be covered by electricity. Especially when it comes to providing process
                           heat, gas will remain an important energy source, accounting for 26% of the total mix. Renewable
                           energy sources (Geothermal heat, solar heat, as well as biofuels to a very small extent) will cover the
                           demand that remains.
                          The targets and instruments resulting for the 2030 time horizon for buildings match those of the
                          household sector. This is supplemented by high efficiency requirements for cooling equipment
                          (from approx. 2030 on, these will run only combined heat and power, heat pumps or with renewable
                          energies). In the case of highly standardised devices, the instruments applicable to the private house-
                          hold sector must also be applied.
Industrial sector
     2.500                                                                                                           120               Renewables
                                                                                              Source: Prognos 2009                     District heating
                                                                                                                                       Electricity
                                                                                                                     100               Gases
     2.000
                                                                                                                                       Mineral oil
                                                  Index of CO2 emissions                                                               Brown coal
                                                                                                                     80                Hard coal
     1.500                                                                                                                             Heating
                                                                                                                                       Information and


                                                                                                                          Index
                                                                                                                     60                communication
PJ


                                                                                                                                       Mechanical energy
     1.000                                                                                                                             Process heat
                                                                                                                                       Lighting
                                                                                                                     40
                                                                                                                                       Index –
                                                                                                                                       CO2 emissions
      500
                                                                                                                     20


        0                                                                                                            0            Fig. K 8:
                  2005                  2020       2005   2006 2007
                                                             2030          2008   2009 2010
                                                                                      2040    2011    2012 2013
                                                                                                         2050                     Final energy consumption
                                                                                                                                  by the industrial sector
                                                                                                                                  in the innovation scenario,
                                                                                                                                  broken down according
             Direct CO2 emissions by the industrial sector decline in the innovation scenario from 101 to 36 million              to types of use and energy
                                                                                                                                  sources, in PJ, index of
             tonnes between 2005 and 2050; this corresponds to a reduction of 64%.                                                direct CO2 emissions,
             • The main contribution to this reduction results from the reduction of process heat demand. In                      2005 – 2050

              2005, process heat had a 66% share in final energy consumption and was the main form of energy
              use in industry. Through persistent shifts in technology and processes, specific process heat con-
              sumption falls by approx. 68% by 2050. New production methods and shifts from energy-intensive
              (e.g. metal production) to less energy-intensive industrial sectors reduce absolute process heat
              demand by 50% despite an almost 20% increase in production.
             • Power applications are the second highest form of energy use in industry, accounting for 21% in
              2005. Highly efficient cross-section technologies and specially developed optimisation of materials,
              products and processes reduce final energy use here. All in all, energy demand for these applica-
              tions falls by 43% between 2005 and 2050.
             • Specific space heating demand in industrial buildings falls very steeply by the year 2050.
             • In the industrial sector, the reduction of emissions is subject to physical limits when it comes to the
              specific consumption by processes using heat and power. This is why energy savings are limited to
              53% in the industrial sector between 2005 and 2050.
             • The energy mix in industry is dominated by electricity (41%) and gas (39%).
             In order to achieve the innovation scenario and also the reductions called for in the “Blueprint
             Germany”, the following strategic safeguards must be put in place:
             • Energy productivity should be roughly doubled from 2005 to 2030 and tripled by 2050.
             • The share of renewable energy and emission-free energy sources (district and local heating, electricity)
              in total final energy demand should rise to around 60% by 2030 and to 90% by 2050.
             • By 2050, CO2-intensive industrial processes should only be operated in conjunction with CCS.
             • Process-related greenhouse gas emissions should be reduced from today’s level by more than
              50% by the year 2030 and by 90% by 2050.
             In addition to the political measures to create a flexible system allowing for the quantitative control
             of energy savings referred to in section ”Key Elements of an integrated climate protection and en-
             ergy programme” and the ability to deduct energy-saving measures from taxation, the following
             sector-specific implementation instrument for the 2030 time horizon is needed:
             • Binding introduction of energy management systems in industry.
             This must be supported by incentives for the development and use of efficient technology innova-
             tions. This applies especially to application-orientated research.
18


      19
                                 Transport sector
                                                             Passenger transport                Freight transport
                       2000
                                                                                                                Source: Prognos/Progtrans 2009
                       1800

                       1600

                       1400

                       1200
             PJ


                       1000

                         800

                         600

                         400

                         200

                   Fig. K 9: 0
Final energy consumption              2005            2030            2050                          2005                2030         2050
  by passenger and freight
transport in the innovation       Passenger rail transport                              Inland waterway transport
    scenario, broken down         Short distance public transport - roads               Rail freight transport
                                                     Bruttoinlandsprodukt
                                  Motorised individual road transport                                     Bevölkerung
                                                                                        Road freight transport
    according to modes of
           transport, in PJ,      Passenger air transport                               Air cargo transport
               2005 – 2050

                                 Direct CO2 emissions of the transport sector will decline in the innovation scenario in the period from
                                 2005 to 2050 from 180 million tonnes to 30 million tonnes, corresponding to a reduction of 83%.


                                 • Central elements for the reductions in the transport sector are vehicle efficiency in motorised indi-
                                  vidual transport, electrification of motorised individual transport and the contribution of freight
                                  transport switching to renewable energy sources.
                                 • Electric vehicles will be introduced to the passenger car fleet. Vehicles with combustion engines
                                  without a hybrid part will no longer be of any relevance after 2045. In 2050, hybrid electric vehicles
                                  account for around 36% of cars, plug-in hybrids for 28% and battery electric vehicles for 18%.
                                 • By 2040, the average specific energy consumption of new passenger cars with combustion
                                  engines declines by approx. 60%. By 2050, the average fleet consumption (calculated over the
                                  entire vehicle fleet and performance) falls by 64%; specific CO2 emissions per vehicle kilometre
                                  decline to approx. 40 g per km.
                                 • In freight transport, a large part of transport growth shifts to rail transport. Electrification of the
                                  HGV fleet is not assumed; this is due to the power density which this requires and for which no
                                  battery technologies are foreseeable. Specific consumption by HGVs falls by approx. 25%.
                                 • Air traffic performance (domestic principle) declines both for passenger and for freight transport.
                                  Between 2005 and 2050, energy efficiency increases by approx. 40%. This means that energy
                                  consumption by air traffic falls in total by 10%.
                                 • Due to the more efficient vehicles and the efficiency advantage in terms of final energy of electric
                                  vehicles and rail transport, final energy consumption by the transport sector declines in total in
                                  the period under review by 41%.
                                 • In 2005, final energy demand by transport will hence be mainly covered by biofuels (59%) of
                                  the second and third generation and by electricity (12%). Hydrogen and gas have a minor role
                                  to play.
                                 By 2050, all mineral-oil based fuels in the innovation scenario will be replaced by second and third-
                                 generation biofuels. This means that the sustainable biomass potential available in Germany is almost
                                 completely exhausted. (This calls for a strategic decision concerning the targeted use of the biomass
                                 potential in the transport sector, rather than in favour of the generation of low-temperature heat).
3000                                                                                                                     120   Electricity
                                                                                                                     Source: Prognos/Progtrans 2009         Hydrogen
                                                                      Index – CO2 emissions                                                                 Liquified
                                                                                                                                                            petroleum gas
                             2500                                                                                                                     100   Natural gas
                                                                                                                                                            Aviation fuels
                                                                                                                                                            Diesel from
                                                                                                                                                            mineral oil
                             2000                                                                                                                     80


                                         Passenger transport
                                                                                                                                                            Biodiesel
                                                                                                                                                            Petrol from
                                                                                                                                                            mineral oil
                             1500                                                                                                                     60    Bioethanol
                                                                                                                                                                             �
                        PJ


                             1000                                                                                                                     40
                                         Freight transport


                                 500                                                                                                                  20


                   Fig. K 10:     0                                                                                                                   0
   Final energy consumption
                                                               2005          2020             2030               2040                  2050
     by passenger and freight
  transport in the innovation     In order to achieve the “Blueprint Germany” in the transport sector, the following strategic safeguards
       scenario, broken down
according to energy sources,      must be put in place:
    in PJ, index of direct CO2
     emissions, 2005 – 2050       • In the field of motorised individual transport,
                                       - transport avoidance or transport shifting should reduce performance by 2030 by around 20% and by
                                        2050 by around 30%;
                                       - specific final-energy consumption of the vehicle fleet (including the efficiency effects resulting from electric
                                        vehicles) should be reduced by more than 60% by the year 2050;
                                       - the aim should be to achieve a 7% share of electric drives in total performance by 2030 and around 50%
                                        by 2050;
                                       - the aim for the year 2050 should be to achieve almost complete coverage of final energy demand through
                                        renewable (biofuels) or emission-free (electricity, hydrogen) energy sources.
                                  • In the field of road freight transport,
                                       - performance in 2050 should not exceed the current level by more than one third;
                                       - specific energy consumption by the entire vehicle fleet should be reduced from today until 2030 by 30%
                                        and by 2050 by around 50%;
                                       - the entire remaining fuel consumption must be converted to renewable energy sources (biofuels, hydrogen)
                                        by 2050.
                                  • In the field of air transport,
                                       - specific energy consumption by the entire aircraft fleet should be reduced by 20% by the year 2030;
                                       - fuel use must be fully converted to regenerative energy (biofuels) by the year 2050.


                                  With a view to the political instruments for implementation for the 2030 perspective, this means the follow-
                                  ing set of measures:
                                  • An investment programme to double the capacity of Germany’s rail network by 2030.
                                  • An investment programme to boost by 25% the performance of public passenger transport by 2030
                                       (and to make public passenger transport more attractive).
                                  • Stricter limit values for passenger cars to be set at 70g of CO2 per km in 2030 (without the inclusion of
                                       biofuels and without the non-inclusion of electric vehicles).
                                  • Creation of HGV fleet limit values of about 30% below the current values by 2030 (including the establish-
                                       ment of a suitable test cycle and calculation basis);
                                  • Increase in the HGV road toll to 50ct per km in 2030, granting of an efficiency bonus and expansion
                                       to include all HGV and the entire road network
                                  • Increase in fuel tax to a level that results in 2030 in a price of €2.50 per litre for conventional petrol.
                                  • Considerable increase in the share of biofuels by combining high and reliably verifiable sustainability standards
                                       for biomass and a further-developed biofuel quota based on a biomass strategy (the height of the quota is
                                       determined by the sustainability standards and the CO2-emissions reduction potential) by the year 2030.
                                  • A speed limit of 120kph on all motorways.
20


      21
                                 Final energy consumption
                     10.000                                                                                                                     120
                                                                                                              Source: Prognos/Progtrans 2009
                       9.000
                                                     Index – CO2 emissions
                                                                                                                                                100
                       8.000

                       7.000
                                                                                                                                                80
                       6.000


                                                                                                                                                     Index
               PJ


                       5.000                                                                                                                    60

                       4.000
                                                                                                                                                40
                       3.000

                       2.000
                                                                                                                                                20
                       1.000

                  Fig. K 11: 0                                                                                                                  0
     Total final energy con-
                                      2005                    2020
                                                           2005 2006       2007       2030
                                                                                   2008 2009   2010          2040
                                                                                                          2011 2012      2013      2050
                                                                                                                                2014 2015
sumption in the innovation
     scenario, broken down           Solar energy                  District heating            Diesel from mineral oil          Transport
        according to energy
                                     Environmental heat            Electricity                 Petrol from mineral oil          Industry
       sources and sectors,
  in PJ, index of direct CO2         Biomass                       Gases                       Fuel oil                         Commercial, trade and services sectors
   emissions, 2005 – 2050            Biogas                        Aviation fuel               Coal                             Private households
                                     Biofuel                                                                                    Index – CO2 emissions

                                 CO2 emissions from the direct, energy-related combustion of fossil fuels decline in the innovation
                                 scenario between 2005 and 2050 from 459.4 million tonnes to 77.7 million tonnes, and hence by 85%.


                                 • Final energy demand on the whole declines between 2005 and 2050 by almost 59%.
                                 • All sectors will contribute to this with considerable savings in consumption. The biggest savings
                                  are made in the private households (-76%) and services (-67%) sectors because space heating (in the
                                  2005 reference year) dominates consumption here and this can be practically fully reduced through
                                  energy efficiency measures. Savings of 53% are made in the industrial sector. Compared to the refer-
                                  ence scenario (savings between 2005 and 2050: 21%), innovation and industry shifts will cut consump-
                                  tion considerably. In the transport sector, consumption in 2050 is 41% lower than the baseline.
                                 • In 2050, mineral oil products will be primarily used in air transport and inland waterway transport,
                                  and to a very small degree to generate process heat in industry. These products continue to account
                                  for a share of almost 10% in the overall energy mix. In motorised passenger and freight transport, they
                                  will be systematically replaced by second and third-generation biofuels that have been produced with
                                  high efficiency.
                                 • In 2050, natural gas will be primarily used to generate process heat in the industrial and services
                                  sector, to a lesser degree in innovative technologies for combined generation of heat and electricity,
                                  of heat and cold, as well as in passenger cars. In 2050, natural gas accounts for 20% of the energy mix.
                                 • Electricity will be used in all sectors for additional purposes and applications, and will be introduced
                                  into the transport sector for passenger cars. Despite this expansion, the persistent implementation of
                                  efficiency technologies along with technology shifts will lead to an overall decline of 37% in electricity
                                  consumption in the period under review. The share in the final energy mix rises from 20% to 30%.
                                 • The use of renewable energy (solar heat, ambient heat, biofuels) triples in the period under
                                  review. Its share in the final energy mix rises from 4.3% to 36.6%, due to the significant decrease
                                  in overall consumption.Taking the additional measures in the “Blueprint Germany” into considera-
                                  tion, the share of renewable energy in overall final energy consumption (in a certain bandwidth –
                                  depending on the complementary development assumed in the field of transport avoidance, addi-
                                  tional electrification of transport or additional vehicle efficiency) reaches a level of around 30% in 2030,
                                  around 40% in 2040 and around 50% in 2050.
Electricity generation

                                         electricity generation without CCS
                                 700                                                                                                              Electricity imports
                                                                                                                           Source: Prognos 2009
                                                                                                                                                  Renewables
                                 600
                                                                                                                                                  Stored power
                                                                                                                                                  (pump storage,
                                                                                                                                                   others)
                                 500
                                                                                                                                                  Natural gas

                                                                                                                                                  Oil and others
                                 400
                                                                                                                                                  Brown coal
                            TWh


                                                                                                                                                  Hard coal
                                 300
                                                                                                                                                  Nuclear power

                                   200
                       Fig. K 12:
     Net electricity generation by
   German power stations in the 100
     innovation scenario (variant
     without CCS), broken down
  according to energy sources in 0
              TWh, 2005 – 2050                   2005                2020                 2030                  2040                 2050
                                                                            Steinkohle                      Braunkohle
                                         CO2 emissions from electricity generation fall between 2005 and 2050 from 323 million tonnes to
                                                                            Erdgas                          Speicher (Pumpspeicher, sonstige)
                                         14 million tonnes and hence by 96%.
                                                                            Stromimport
                                         The general decline in electricity demand (refer to section “Final energy consumption”) is a pre-
                                         condition for the growing decarbonisation of electricity generation.
                                         Renewable energy has a very high share of net electricity generation. A high share of the renewable
                                         energy (237 TWh) is supplied by variable wind and Photovoltaics, making considerable intermediate
                                         storage and balancing capacities necessary. This requires a number of gas power stations and
                                         the extensive increase in storage volumes. The infrastructure-related preconditions for this are the
                                         provision of grid capacities to integrate and transport power supplied by offshore wind power plants
                                         (38 GW) as well as grids with realtime response capability to manage decentralised feed-in (29 GW
                                         of photovoltaics, 34 GW of wind, onshore) as well as the integration and management of storage
                                         capacities.
                                         In 2050, the import balance (electricity from renewable energy) totals 48 TWh max. and is hence
                                         below the quantity assessed as possible in the 2008 Environment Ministry’s pilot study. Generally
                                         speaking, imports are not ruled out in any of the scenarios.


                                         electricity generation with CCS
                                  700                                                                                                             Electricity imports
                                                                                                                           Source: Prognos 2009   Renewables
                                  600                                                                                                             Stored power
                                                                                                                                                  (pump storage,
                                                                                                                                                   others)
                                  500                                                                                                             Natural gas

                                                                                                                                                  Oil and others
                                  400                                                                                                             Hard coal
                            TWh


                                                                                                                                                  with CCS

                                  300                                                                                                             Brown coal
                                                                                                                                                  Hard coal

                                  200                                                                                                             Hard coal
                       Fig. K 13:                                                                                                                 with CCS
    Net electricity generation by                                                                                                                 Nuclear power
   German power stations in the 100
innovation scenario (variant with
CCS), broken down according to
  energy sources, in PJ, in TWh, 0
                     2005 – 2050                 2005                2020                 2030                  2040                 2050
22


23
     >>
          In the variant “with CCS”, CO2 emissions fall from 323 to 23 million tonnes and hence by 93%.


          This variant assumes the large-scale availability and implementation of CCS technology. At the
          same time, it is estimated that the expansion of renewable energy is not fast enough. In this case,
          new fossil fuel power stations equipped with CCS technology could be erected.


          In the variant with CCS, it is assumed that starting in 2025, this technology will be the standard,
          first of all, in new lignite power stations, and starting in 2035, in new hard coal power stations also,
          and that CO2 storage is sustainable and safe. No more new coal-fired power stations without CCS
          technology will be built after 2025. The old coal-fired power stations without CCS will leave the mix
          by 2046 for reasons of age or economy.


          In 2050, there are no more coal-fired power stations without CCS in the mix, but there are still
          3 GW of hard-coal capacity and 10 GW of lignite capacity with CCS technology.


          There are still 17 GW of gas power station capacity available to produce peak load energy.


          The volume of electricity from renewable sources is lower than in the variant without CCS and in
                            Bruttoinlandsprodukt                              Bevölkerung
          2050 totals 243 TWh, accounting for around 66% of the total net electricity volume generated.
          Conventional baseload power plants also exist. That’s the reason why storage demand is lower
          than in the variant without CCS, but still has to increase five-fold compared to 2005. The require-
          ments for the expansion and conversion of infrastructural preconditions (transmission grids, smart
          grids) match those of the variant without CCS and are in line with the somewhat slower increase in
          renewable energy.


          In order to achieve the “Blueprint Germany” in the electricity sector, the following strategic safe-
          guards must be put in place:
          • By 2030, electricity demand (including new application areas, such as electrification of transport)
           should be reduced by around 25% until 2030 and subsequently further reduced by 10 percentage
           points until 2050.
          • The share of renewable energy in electricity should reach a level of 60% by 2030 and of 95%
           by 2050.
          • The remaining fossil electricity generation capacities should only be permitted to operate from
           2040 onwards if they are equipped with CCS.
          • In order to balance out the huge increase in contributions by variable power generation, existing
           storage capacity (up to now primarily pumped-storage power stations) should be increased by
           2030 by a factor of 3.5 and by a factor of 8 by the year 2050.


          In order to reach these targets, the following set of instruments is proposed:
          • Introduction of a moratorium for coal-fired power stations without CCS.
          • Further development of the renewable energy feed-in law (maintaining priority dispatch,
           innovation-orientated cost degression, promotion of the generation of electricity from biomass
           only with cogeneration);
          • Creation of additional market incentives (market model) to provide power and balancing
           capacity for the different (big and small) consumer groups.
          • Development of a long-term electricity storage expansion programme that can in the medium
           and long term supplement the interconnectivity of the German electricity system with neighbouring
           nations and regions which is also necessary.
Primary energy consumption

                           16.000                                                                                                100
                                                                                                          Source: Prognos 2009
                                                                                                                                 90
                           14.000
                                                                    Index – CO2 emissions
                                                                                                                                 80
                           12.000
                                                                                                                                 70

                           10.000
                                                                                                                                 60

                             8.000                                                                                               50
                    PJ


                                                                                                                                 40
                             6.000
                                                                                                                                 30
                             4.000
                                                                                                                                 20
                             2.000
                                                                                                                                 10

                        Fig. K 14: 0                                                                                  0   Other conversion
 Primary energy consumption (wi-
                                             2005            2020          2030             2040            2050          Electricity generation
                                       1985 1986 1987 1988 1989 1990 1991 1992 1993 1994 1995 1996 1997 1998 1999 2000 2001
thout non-energetic consumption)
                                                                                                                          Generation of district heating
in the innovation scenario (variant
   without CCS), broken down ac-          Hydropower     Environmental and    Gases               Petrol from mineral oil Transport
    cording to energy sources and         Wind energy    waste heat           Aviation fuel       Fuel oil                Industry
   sectors, index of energy-related       Solar energy   Biomass              Biofuels            Coal                    Commercial, trade and
      CO2 emissions, 2005 – 2050          Geothermal     Waste                Diesel from         Nuclear power           services sectors
                                          energy         Biogas               mineral oil         Index – CO2 emissions   Private households

                                       Direct energy-related CO2 emissions decline in the innovation scenario variant without CCS
                                       between 2005 and 2050 by 757 million tonnes, or 89%, respectively, and in the variant with CCS by
                                       748 million tonnes, or 88%, respectively.
                                       Between 2005 and 2050, primary energy consumption (without non-energetic consumption) falls
                                       by 57% from 13,546 PJ to 5,766 PJ. Consumption of conventional energy sources will decline by
                                       85% whilst use of renewable energy will rise in total by a factor of almost 6. Nuclear power and coal
                                       will no longer be part of electricity generation (in the variant without CCS), coal will only be used to a
                                       lesser degree in metal production.
                                       In the innovation scenario, mineral oil products will only continue to be used as aviation fuel and in
                                       residual quantities for the generation of process heat; its consumption will decrease by 91%. Natural
                                       gas and other gases are the only fossil sources of energy which will have any kind of a role to play in
                                       the mix. They will be used in the services and industrial sector to produce process heat. Gases will
                                       also be used to generate peak load energy and balancing energy and to a lesser extent to produce
                                       cogenerated electricity (accompanied by low-temperature heat).
                                       The use of primary energy in electricity generation will be reduced by 49%. Renewable energy
                                       sources with their per-definition excellent efficiency will contribute considerably to this development.
                                       The around 74% decline in energy used to generate district heating is largely a consequence of
                                       falling demand. In the “other conversion” area, conversion declines due to the fall in the use of min-
                                       eral oil products. In contrast to this, the increased production of biogas and biofuels leads to greater
                                       use of biomass. All in all, the use of energy sources in other conversion changes only slightly (-3%).
                                       The substitution of fossil fuels with biofuels and the (reduced) use of biomass and biogas in the gen-
                                       eration of electricity and heat result in around 1,700 PJ of biomass being used in total for primary
                                       energy. This volume exceeds the potential that can be generated in a strictly sustainable manner in
                                       Germany. As a condition for the use of imported biomass from Europe or global markets binding regula-
                                       tions and legal standards for the ecological and social integrity of the biomass have to be implemented.


                                       Taking the additional measures of the “Blueprint Germany” into consideration, the share of renew-
                                       able energy sources in overall primary energy consumption reaches a level of around 43% in 2030,
                                       of around 65% in 2040 and around 85% in 2050.
24


       25
                                      Costs and savings

                                40
                                                                                                                              Source: Prognos 2009

                                30


                                20


                                10
                       Bn €


                                  0
                                       2010        2015         2020          2025         2030          2035          2040          2045        2050

                                -10

                  Fig. K 15:
      Additional cost of the -20
 innovation scenario for the                                                                                                                                  Investments
national economy vs. saved                                                                                                                                    Results without CCS
   expenditure for imported -30
                                                                                                                                                              Results with CCS
  fossil fuels, 2010 – 2050,
      in billion (real, 2000)                                                                                                                                 Savings with CCS
                                -40                                                                                                                           Savings without CCS

                                      The innovation scenario includes investments and strategic decisions which lead to additional costs
                                      compared to the reference scenario with its continuation of current energy policy. In contrast to this, the
                                      reduced use of fossil energy sources especially means savings for the economy. All in all, integrated
                                      costs which total a maximum of 0.6% of GDP are comparatively low and economically acceptable.


                                      Additional investment and hence additional costs will be generated by:
                                      • more extensive refurbishment of existing buildings and on the whole very demanding energetic
                                        building standards, especially in the private household sector;
                                      • the introduction of electric vehicles in the field of passenger cars, including infrastructure, as well as the
                                        improvement of freight transport logistics, including handling centres;
                                      • the changeover of processes in the industrial and services sector, as well as technology development;
                                      • the changeover of power stations to renewable energies, the expansion of storage capacities and the
                                        introduction of CCS technology.


                     30.000
                                                                                                                          Source: Prognos 2009


                     25.000


                     20.000
                       Mio. €


                     15.000


                     10.000

                                                                                                                                                         Rail infrastructure
                                                                                                                                                         EV charging infrastructure
                                                                                                                                                         Electric vehicles
                    Fig. K 16:                                                                                                                           Industry
       Elements of additional                                                                                                                            services, commerce and trade
       costs in the Innovation
        scenario 2010 – 2050                                                                                                                             electricity
         in Mio. € (real, 2000)                                                                                                                          space heating (buildings)
                                         2010        2015        2020        2025        2030        2035       2040          2045       2050
This is set off by the saved expenditure for imported fossil fuels, calculated at import prices.


                                            Assuming that starting in 2010 targeted investment begins, annual additional costs rise from
                                            approx. € 6 billion in 2010 to a good € 32 billion max. in 2033; after this, they fall slowly to approx.
                                            € 22 billion per year.


                                            Annual savings from the lower use of fossil fuels grow continuously due to investment in savings and
                                            rising energy prices to € 29 billion annually, and to approx. € 30 billion in the variant with CCS.


                                            From 2044 on, savings outweigh investment. Net savings rise to € 6.6 billion p.a.


                                            In 2024, this leads to maximum net costs for the economy of almost € 16 billion (approx. 0.6%
                                            of GDP) after which time, this burden will decline.


                                            Added together over the entire period under review (and with a discounted, long-term interest rate
                                            of 1.5%), this results in a burden of approx. 0.3% of GDP.


                                                  Energy-related greenhouse gas emissions

                                    1.200
                                                                                                                               Source: Prognos 2009

                                    1.000
Million tonnes of CO2 equivalents


                                     800


                                     600


                                     400
                                                                                                                                                          Fig. K 17:
                                                                                                                                                          Energy-related green-
                                                                                                                                                          house gas emissions in
                                     200
                                                                                                                                                          the innovation scenario
                                                                                                                                                          (variant without CCS)
                                                                                                                                                          in million tonnes of CO2
                                       0                                                                                                                  equivalents, 1990 – 2050
                                                   1990                 2005         2020                2030           2040              2050

                                             N20                                   Electricity generationgeneration      Commercial, trade and services sectors
                                             CH4                                   Generation of district heating        Private households
                                             Conversion sector, total              Transport
                                             Other conversion                      Industry
26


      27
                 >>


                                                           In 2050, energy-related greenhouse gas emissions (in the variant without CCS) total 96.6 million
                                                           tonnes of carbon dioxide equivalents and are hence 91% lower than 1990. All sectors contribute to
                                                           this development although admittedly to different degrees (since it is not possible to consistently
                                                           compare emissions to 1990, the reduction rates are shown here in comparison to 2005).


                                                           Private households account for the relatively highest contribution where emissions fall by 98%
                                                           between 2005 and 2050. Heating demand for space heating will decline to practically zero.
                                                           Due to the high share of space heating and high electricity share, the services sector can also
                                                           reduce its direct emissions significantly (by approx. 85%).
                                                           The transport and industry sectors also reduce their emissions significantly (industry: 64%, trans-
                                                           port 83%), however, in 2050 they still emit greenhouse gases due to the use of fossil fuels to generate
                                                           process heat (a reduction in the metallurgical sector too) as well as fossil fuels for aviation and shipping.
                                                           Due to the high share of renewable energy in electricity generation, emissions here decline by 98%
                                                           to 14 million tonnes in 2050. Emissions from the other conversion sector will fall to around 3 million
                                                           tonnes primarily due to the decline in the generation of district heating as well as the strong reduc-
                                                           tion in the production of mineral oil products.
                                                           Other energy-related greenhouse gas emissions (N2O and CH4), primarily in conjunction with
                                                           transport and the combustion of fossil fuels, decline between 2005 and 2050 by 81% to almost
                                                           2 million tonnes of carbon dioxide equivalents .


                                                 1.200
                                                                                                                                                       Source: Prognos 2009

                                                 1.000
                 Million tonnes of CO2 equivalents


                                                     800


                                                     600


                                                     400


                                                     200


                 Fig. K 18: 0
Energy-related greenhouse                                         1990                 2005             2020                 2030              2040               2050
      gas emissions in the
                                                            N20                                    Electricity generation                  Commercial, trade and services sectors
       innovation scenario
      (variant with CCS) in                                 CH4                                    Generation of district heating          Private households
                                                            Conversion sector, total               Transport
     million tonnes of CO2
  equivalents, 1990 –2050                                   Other conversion                       Industry


                                                           With the CCS option, energy-related greenhouse gas emissions are reduced between 1990 and
                                                           2050 by 88% to 106 million tonnes of carbon dioxide equivalents. Compared to the option without
                                                           CCS, the structure of electricity generation changes. CO2 emissions by fossil power stations decline
                                                           by 93%, however, they do not disappear all together. Around 23 million tonnes of carbon dioxide
                                                           equivalents continue to be emitted by hard-coal and lignite power stations which are equipped with
                                                           CCS technology.
Other greenhouse gas emissions by other sectors


In addition to combustion-related CO2, CH4 and N2O emissions, a host             • Waste sector measures
of other sectors contribute to overall greenhouse gas emissions.                  - Promotion of waste avoidance and recycling, as well as of eco-
These emissions include:                                                           nomical material use for energy-intensive products.
• volatile greenhouse gas emissions by the energy sector,                         - Promotion measures for energetic recycling, especially the expansion
• CO2 emissions from industrial processes,                                         of gasification and fermentation capacities to approx. two thirds of
• CH4 emissions from industrial processes,                                         organic waste.
• N2O emissions from industrial processes,                                       • Agricultural measures
• emissions of fluorinated greenhouse gases,                                      - Increase in the share of organically farmed in agricultural land up to
• greenhouse gas emissions from waste management,                                  25% by 2030 at the latest.
• greenhouse gas emissions from agriculture,                                      - Initiation of a set of measures for fertiliser management comprising
• CH4 emissions from agriculture,                                                  a duty on nitrogen surpluses in farming on a farm basis as well as
• N2O emissions from agricultural soils,                                           promotion measures for improved fertiliser management, and tar-
• greenhouse gas emissions from LULUCF (land use, land use change                  geted research and information on climate friendly farming methods.
 and forestry).                                                                   - Initiation of a set of measures for climate protection and health with
                                                                                   regulatory restrictions to livestock numbers per area as well as
All in all, a host of very heterogeneous, sector-specific measures result in a     implementing an information and awareness campaign to reduce
decline of these emissions in the innovation scenario between 2005 and             meat consumption.
2050 from 188 million tonnes to 60 million tonnes of CO2 equivalents.             - Regulatory rules for the gas-tight storage of slurry and promotion
This corresponds to a reduction of 68% compared to 2005 and of 67%                 measures to boost the energetic recycling of slurry and of harvest
compared to 1990.                                                                  residues in biogas plants.
                                                                                 • Measures in land use
In order to achieve the “Blueprint Germany” in the non-energy sectors,            - Promotion of measures in forestry that are geared towards sustainable
the following strategic safeguards must be put in place:                           forestry and that maintain and/or boost the sink effect of Germany’s
• Greenhouse gas emissions from agriculture should be reduced                      forests (integration of CO2 into forest biomass).
 between 2005 and 2030 by 30% and by 40% by the year 2050.                        - Regulatory restriction of land use to convert non-sealed land into
• With a view to emissions from land use, land use change and for-                 residential, transport and settlement areas.
 estry, the release of CO2 should be reduced by 70% between 2005                  - Initiation of a set of measures for land transformation comprising
 and 2050.                                                                         promotion measures for the renaturation of peat land and drained
                                                                                   grasslands, regulatory establishment of alternative use and the imple-
The same applies to the set of instruments.                                        mentation of the goals of the Federal government’s biodiversity strategy.
The most important sector-specific instruments are listed below:                  - Stricter regulations for land protection as a precondition for payments
• Instruments in industry:                                                         within the scope of a new EU agricultural policy.
 - Fully binding introduction of CCS for process-related emissions in
   the steel, cement and lime sectors unless such a measure has
   already been implemented through the CO2 price signal of emissions
   trading.
 - Initiation of a set of measures to reduce fluorinated GHGs; compris-
   ing regulatory requirements, such as a ban on the use of F-gases
   as refrigerants from 2015 onwards and a tax on the use of F-gases
   linked to the greenhouse gas potential.
28


29
     Key elements of an integrated
     climate protection and energy programme 2030
     In addition to and to supplement the measures of the Federal government’s “Integrated Energy and
     Climate Programme” from 2008, an “Integrated climate protection and energy programme 2030”
     can be outlined that should be based on the following key elements (the sector-specific bundle has
     been described in the respective sector chapters):


     1. Legal framework for a long-term climate protection policy
       • Binding establishment of long-term goals;
       • Monitoring methods and action plans based on strategic goals;
       • Sanction and adaptation measures for cases where targets are not reached.


     2. General instruments
       • Further development of the EU emissions trading system with a cap that for 2020 is 35%
         below and for 2030 60% below the 2005 level and with a much stronger restriction of emission
         reductions made outside the sectors covered by the emissions trading system and which can
         be counted as proof of commitment;
       • Introduction of a CO2 tax for stationary use for energy sources that are not covered by the EU
         emissions trading system.


     3. General instruments to boost energy efficiency
       • Creation of a flexible quantity control system for energy savings with which energy suppliers,
         using a positive list for energy-saving projects (with defined baseline methods, etc.), must furnish
         proof each year in the form of freely tradable saving certificates of a certain energy saving amount
         which is based on the percentage of the energy supplier’s sales (rising by one percentage point
         each year after 2010);
       • Re-introduction of the deduction from taxation of investments in energy efficiency.


     4. Innovation and infrastructure-specific measures
       • Revision and expansion of the German biomass strategy which contains long-term prioritisation
        and concrete steps in the field of biofuels (including the specification of aviation fuels based on
        biomass), biomethane supplies and the generation of electricity from biomass.
       • Innovation programme for biofuels of the second generation, with a target of having only this
         biofuel quality on the market by 2020.
       • Innovation and market launch programme for electric cars, including efficiency-dependent
         bonuses.
       • Innovation programme to develop and promote smart distribution grids with intelligent load
         management options.
       • Fastest possible implementation of CCS pilot and demonstration projects and, if applicable, the
         drawing up of a “German CCS development plan” to define the solution contributions by CCS
         under different boundary conditions, the infrastructure required, underground regional planning
         to manage competition for underground use and use prioritisation.
       • Preparation of a “German energy infrastructure conversion programme”; this can be used
         as a basis for investment incentives and obligations for the transmission grids as well as for the
         expansion of the CO2 infrastructure, implementation within the framework of Deutsches Netz AG.
       • Improved promotion of research with milestones in the field of energy efficiency improvements
         through further development and the application of new key technologies, e.g. for processes
         and materials. Targeted market launch of initiatives to optimise these technologies and to achieve
         their widespread implementation.
Conclusions and outlook: changes in energy and
climate policy, innovation and global frameworks
    With a continuation – no matter how ambitious – of today’s energy and climate policy, i.e. a
    continuation of the technologies commonly used today as well as today’s consumption patterns for
    energy and resources, it will not be at all possible to reach the reduction target of 95% for total
    greenhouse gas emissions by the middle of the century (compared to the 1990 baseline). The con-
    tinuation of today’s ambitious level in energy and climate policy assumed in the reference scenario
    can at best be expected to achieve about 45% reduction of greenhouse gas emissions in the period
    from 1990 to 2050.
    An emissions reduction path that is consistent with international efforts to restrict mean global tem-
    perature rise to a value below 2°C compared to pre-industrial levels must set new courses at an
    early point in time. An analysis of the innovation scenario and the additional analyses highlight the
    following challenges for the changes necessary by the year 2050:
    • Considerable efforts must be made immediately to significantly boost energy efficiency. If energy
     productivity is not increased by at least 2.6% annually, it is extremely unlikely that this climate
     protection target will be reached.
    • In all sectors, the remaining energy demand must be almost fully covered by renewable energy,
     the use of CCS is unavoidable for the greater share of any emissions that remain from fossil fuels
     and industrial processes.
    • A large part of the changes necessary involve plants and infrastructures with a long service
     life, long lead times or complex conversion processes. Political strategies and measures will
     have to be continuously examined with a view to their compatibility with the required long-term
     developments.
    • Especially emission reductions in the mid-term and long-term perspective call for extensive
     innovations that are specifically initiated and that must be quickly launched on the market.
    • In addition to measures in the field of energy-related greenhouse gas emissions, significant
     emission reductions in the field of non-energy related emissions are also unavoidable. Greater
     reductions in emissions from industrial processes, agriculture and land use play a central role.


    Even though there are no alternatives to the efforts to reduce the entire range of greenhouse gas
    emissions, it is highly unlikely that the 95% target for the year 2050 will be reached if the following
    new courses are not set:
    • A significant decline and stabilisation of electricity demand to a level that is 25% below today’s
     values in 2030 and 35% in 2050. This also applies in the case of a large-scale launch of electric
     drivetrains in the transport sector.
    • An expansion of electricity using renewable energy sources to 95% (employing more than
     50% of CCS power stations).
    • The refurbishment of existing buildings up to a space heating demand of (practically) zero and
     the early introduction of zero-energy standards for new buildings.
    • Considerable modal shifts in transport, which, for instance, require a doubling of rail freight
     transport capacities and a huge expansion of public passenger transport.
    • Improved efficiency of the vehicle fleet by an average of 60% and improved efficiency of road
     freight transport by more than 30%.
    • Extensive shift in motorised individual transport to electric drivetrains with sustainably generated
     biofuels covering the remaining fuel demand in passenger, freight and air transport.
    • Avoidance of process-related CO2 emissions by the iron and steel industry and in cement
      production through significant material savings and/or substitution and the use of CCS in industry.
    • Sustainably generated biomethane to cover the remaining demand for process heat in industry.
    • Enormous emission reductions in agriculture and in land use.
30


31
     >>   In addition to a host of technical innovations, changes in production and consumption patterns
          will have to be made across the entire board along with huge structural change. Moreover, the
          changes will not be possible unless a persistently systematic view of the necessary changes is
          developed:
          • The diverse changes at the energy demand and supply sides call for extensive reshaping of the
           infrastructure for electricity, gas and CO2 as well as systematic and long-term approaches to
           system integration and market integration of climate-friendly technologies, especially in the
           field of fluctuating supplies of electricity from renewable energy sources.
          • The enormous reductions in emissions call for a strategic re-evaluation of the use of scarce
           resources for a series of important climate protection options. The use of biomass must not only
           be examined in view of the quantities available in Europe and the demand for the most efficient use
           possible, but also with a view to the areas where no alternative to biomass exists in the long-term.
           Limited CO2 storage reservoirs mean that priority must be given to the use of CCS and correspond-
           ing management of storage reservoirs.
          • The strategies needed to provide sustainably generated biomass will have to include the drafting
           and implementation (with a considerable lead time) of strict sustainability standards.


          The additional costs of a huge reduction in emissions for the strategies pursued in the innovation
          scenario appear to be reasonable on the investment side, totalling a max. of 0.6% of GDP. The
          burdens, however, are distributed unevenly (e.g. high, non- amortisable investments in the field of
          buildings). Suitable instruments will be needed here to allocate and distribute additional costs.


          Many more ambitious instruments will hence be needed than those discussed up to now in energy
          and climate policy; these instruments will have to be embedded in long-term, calculable targets and
          political strategies and will require widespread social consensus for the strategic goals and a
          balanced distribution of burdens. This consensus must also include the exploitation of the poten-
          tial offered by renewable energy and/or the storage options for CO2, in particular, as well as the need
          for changed mobility and consumption patterns.
          Apart from the technical/economic potential to reduce emissions and the political instruments re-
          quired to implement this, it will also be extremely important to find supportive acceptance in society
          for the restructuring process required. This calls for a broad, social discussion process. It will be a
          high priority task of politics to initiate and accompany this process with other social groups.


          The implementation of emission reductions across the board calls for new political frameworks in
          addition to a host of new actors. An energy and climate policy that is geared towards ambitious
                                                                                                       -

          climate protection goals will have to aim for a diverse range of actors and a high degree of compe-
          tition and will prevent the formation of market structures that hinder innovation.
          The strategic goals along with the required development of technologies, infrastructures and busi-
          ness models call for integration into an international context which avoids one-sided burdens for
          industries competing on a global level and leakage effects. This integration should include compara-
          ble (ambitious) commitments by all industrial nations and today’s newly industrialised countries, tech-
          nology transfer as well as international balancing mechanisms. In order to save time and in the inter-
          est of cost efficiency, technology development should be internationally co-ordinated and based on
          co-operative work sharing.
          Irrespective of the apparent nature and necessity of the European and international integration of
          many implementation measures for an emissions reduction path based on the “Blueprint Germany”,
          this does not alter the fact that a country like Germany should develop a sound, national strategy for
          a long-term reduction in emissions along the lines of the 95% reduction target. Such a strategy is
          needed to test the consistency of all political measures. The strategies and measures outlined in this
          study could form a reliable basis for a national policy development process that is strictly orientated
          towards innovation, climate protection and a pioneering role.
Table of abbreviations,
                                                              acronyms and symbols

                                                                 GDP    Gross domestic product
                                                                 CCS    Carbon Capture and Storage
                                                                 CH4    Methane
                                                                 CO2    Carbon dioxide
                                                                 EU     European Union
                                                                 EUR    Euro
                                                                 g      Gram
                                                                 IPCC   Intergovernmental Panel on Climate Change
                                                                 J      Joule (physical unit for work)
                                                                 km     Kilometre
                                                                 kWh    Kilowatt hour
                                                                 l      Litre
                                                                 LED    Light Emitting Diode
                                                                 HGV    Heavy goods vehicle
                                                                 m3     Cubic metre
                                                                 max.   Maximum
                                                                 m      Millions
                                                                 N2O    Nitrogen oxide
                                                                 NOx    Oxides of nitrogen
                                                                 O2     Oxygen
                                                                 OLED   Organic Light Emitting Diode
                                                                        (LED based on organic materials, e.g. dyestuffs)
                                                                 PV     Photovoltaics
                                                                 t      tonne
                                                                 GHG    Greenhouse gases
                                                                 cf.    compare
                                                                 V      Volt
                                                                 W      Watt (physical unit for power)
Prefix signs:                                                    Wh     Watt hours
Designation Factor                 Designation Factor
Nano (n)        10-9               Mega (M)     106
Micro (μ)       10  -6
                                   Giga (G)     109
Milli (m)       10-3               Tera (T)     1012
Kilo (k)        103                Peta (P)     1015


Energy units (conversion factors):
from  to       J                  TJ           kWh
J               1                  1x10-12      0.2778x10⁻⁶
TJ              1x10     12
                                   1            0.2778x10⁶
kWh             3.6x10⁶            3.6x10⁻⁶     1
GWh             3.6x10        12
                                   3.6          1x10⁶
34


35
          List of figures

      4   Fig. K 1: Greenhouse gas emissions by sectors, 1990, 2005, and the target up to 2050, in million t of CO2 equivalents


      5   Fig. K 2: Reference scenario: emission reductions broken down into sectors, 1990 – 2050, in million t of CO2 equivalents


      6   Fig. K 3: Total greenhouse gas emissions 1990 – 2050


      8   Fig. K 4: Contributors from different fields of action to the development of total greenhouse gas emissions


     12   Fig. K 5: Framework development: gross domestic product in billion € and population in millions, 2005 – 2050


     14   Fig. K 6: Final energy consumption by private households in the innovation scenario broken down according to energy
                   sources and uses, in PJ, index of direct CO2 emissions, 2005 – 2050


     16   Fig. K 7: Final energy consumption by the services sector in the innovation scenario, broken down according to types of use
                   and energy sources, in PJ, index of direct CO2 emissions, 2005 – 2050


     17   Fig. K 8: Final energy consumption by the industrial sector in the innovation scenario, broken down according to types of use
                   and energy sources, in PJ, index of direct CO2 emissions,2005 – 2050


     18   Fig. K 9: Final energy consumption by passenger and freight transport in the innovation scenario, broken down according
                   to forms of transport, in PJ, 2005 – 2050


     19   Fig. K 10: Final energy consumption by passenger and freight transport in the innovation scenario, broken down according to
                    energy sources, in PJ, index of direct CO2 emissions, 2005 – 2050


     20   Fig. K 11: Total final energy consumption in the innovation scenario, broken down according to energy sources and sectors,
                    in PJ, index of direct CO2 emissions, 2005 – 2050


     21   Fig. K 12: Net electricity generation by German power stations in the innovation scenario (variant without CCS), broken down
                    according to energy sources in TWh, 2005 – 2050


     21   Fig. K 13: Net electricity generation by German power stations in the innovation scenario (variant with CCS), broken down into
                    energy sources, in PJ, in TWh, 2005 – 2050


     23   Fig. K 14: Primary energy consumption (without non-energetic consumption) in the innovation scenario (variant without CCS),
                    broken down according to energy sources and sectors, index of energy-related CO2 emissions, 2005 – 2050


     24   Fig. K 15: Additional cost of the innovation scenario for the national economy vs. saved expenditure for imported fossil fuels,
                    2010 – 2050, in billion € (real, 2000)


     24   Fig. K 16: Elements of additional costs in the innovation scenario in Mio. € (real, 2000)


     25   Fig. K 17: Energy-related greenhouse gas emissions in the innovation scenario (variant with CCS) in million tonnes of
                    CO2 equivalents, 1990 – 2050


     26   Fig. K 18: Energy-related greenhouse gas emissions in the innovation scenario (variant with CCS) in million tonnes of
                      CO2 equivalents, 1990 – 2050
Prepared by Prognos/Öko-Institut and
Dr. Hans-Joachim Ziesing for WWF Germany.


                                    Prognos AG
           Dr. Almut Kirchner (project manager)
                        Dr. Michael Schlesinger
                           Dr. Bernd Weinmann
                                     Peter Hofer
                                    Vincent Rits
                                 Marco Wünsch
                                 Marcus Koepp
                                 Lucas Kemper
                                     Ute Zweers
                              Samuel Straßburg
              Redaktionsassistenz: Andrea Ley


        Dr. Felix Chr. Matthes (project manager)
                                    Julia Busche
                                Verena Graichen
                             Dr. Wiebke Zimmer
                                Hauke Hermann
                             Gerhard Penninger
                                   Lennart Mohr


                    Dr. Hans-Joachim Ziesing


                                  impressum:
                WWF Germany, Frankfurt/ Main
                                 October 2009
 Coordination: Regine Günther, Viviane Raddatz
© Copyright WWF International ® Registered by WWF International • Printed on 100% recycling paper


                                                                    WWF Germany

WWF is one of the world’s largest and most experienced indepen-     Reinhardtstraße 14
dent conservation organizations, with almost 5 million supporters   10117 Berlin
and a global network active in more than 100 countries.             tel: +49 30 308742-0
                                                                    fax: +49 30 308742-50
WWF’s mission is to stop the degradation of the planet’s natural    info@wwf.de
environment and to build a future in which humans live in harmony
with nature, by:
                                                                      www.
                                                                      wwf
• conserving the world’s biological diversity
• ensuring that the use of renewable natural
  resources is sustainable
• promoting the reduction of pollution and wasteful consumption.
                                                                        .de

Blueprint Germany - Summary

  • 1.
  • 2.
    Preface Putting the targetfirst Climate change is one of the greatest challenges which we face and which must be tackled in order to sustain a living planet. To limit global warming to less than two degrees compared to pre-industrial times, global greenhouse gas emissions must be reduced by 80 percent compared to 1990 levels. Industrial nations must even reduce their greenhouse gases by 95 percent by the year 2050. Without such reductions in greenhouse gas emissions, humanity will rapidly head to a global warming of up to seven degrees. The consequences would be disastrous. A change of course is not yet in sight. Year after year, global emissions continue to rise rather than decline. We can no longer afford to discuss ambitious reduction targets as a mere utopia. Never before has this utopia been transformed into a thorough policy programme which is based on con- crete measures and instruments up to the year 2030. The study presented by WWF Germany is the first to address this issue. We are breaking new ground and are putting the target first. This is the only way to protect our stability, security, prosperity and jobs. ‘Blueprint Germany’, which has been prepared by Prognos, Öko-Institut and Dr. Ziesing on behalf of WWF, shows that the transformation from a high-carbon to a low-carbon economy is possible and affordable. By committing to this transformation path, Germany could become a model for other countries. ‘Blueprint Germany’ does not claim to show the only way. It does, however, identify one way which, together with intensified innovation efforts, can lead to reaching the target on a sustainable basis. There is no better time than now for setting the right course for the future – not least of all because most greenhouse gas reduction potentials are linked to very long-term investment and infrastructure decisions. Furthermore, ambitious climate policy must cover all sectors with immediate effect. Any short-sighted policy geared towards seemingly low-cost reduction options is misleading. Although power generation, the building sector, road transport and industry are central fields of action, agriculture and issues of land use will also have to be addressed in order to achieve the ambitious minus-95-percent target. WWF Germany wants this study to trigger a discussion about the future. The study provides many new and interesting answers as well as raising many new questions, which have to be tackled now. For WWF Germany, this analysis represents only the beginning of a systematic approach to these questions and towards presenting answers in the near future. This is why WWF Germany will not only monitor, but will also actively drive this necessary transformation process. Eberhard Brandes Regine Günther CEO WWF Germany Director Climate and Energy Policy
  • 3.
    Prepared by Prognos/Öko-Institutand Dr. Hans-Joachim Ziesing for WWF Germany. Contents Introduction 4 Total greenhouse gas emissions 6 Component analysis and target achieval for the development of greenhouse gas emissions 8 Targets and strategic approaches towards achieving the climate protection goals of the Blueprint Germany 10 Framework data 12 Technology development 13 Private household sector 14 Services sector 16 Industrial sector 17 Transport sector 18 Final energy consumption 20 Electricity generation 21 Primary energy consumption 23 Costs and savings 24 Energy-related greenhouse gas emissions 25 Other greenhouse gas emissions by other sectors 27 Key elements of an integrated climate protection and energy programme 2030 28 Conclusions and outlook: changes in energy and climate policy, innovation and global frameworks 29 Table of abbreviations, acronyms and symbols 31
  • 4.
    4 5 Introduction In order to keep global climate warming below 2°C compared to pre-industrial levels, anthropogenic emissions of greenhouse gases will have to be cut drastically world-wide by 2050. The only way to achieve an international coordinated path is if industrialised nations reduce their emissions to such an extent that this will leave emerging countries some “leeway in the greenhouse gas account” to develop their economies and wealth further. For Germany, this 2050 target means a reduction of greenhouse gases by approx. 95% compared to 1990 emission levels. In other words, less than one tonne of greenhouse gases per capita may be emitted by 2050. Latest scientific findings state that from 2005 to 2050 a global budget of around 800 billion tonnes of CO2 emissions or respectively 1,230 billion tonnes of CO2 equivalents for all greenhouse gas emissions is available in order to keep the increase of global temperature to below 2°C compared to pre-industrial levels. How can and must a highly industrialised and technology-based society be transformed in order to reach this goal? Which technical measures and political instruments are required if economic growth, safety and comfort are to be warranted in the future? Will we have to make sacrifices or can we replace quantity by quality? Since 1990, targets have been pursued in energy and climate policy and the related instruments implemented. A brief look at the as-is situation clearly shows that there is still a very long way to go before we reach the 95% target (refer to Fig. K-1) 1.200 Non-energy GHG 1.000 Other energy-related GHG CO2 – electricity generation and other conversion 800 CO2 – transport Million tonnes of equivalent CO2 – industry 600 CO2 – households/services Total GHG 400 Target line: Blueprint Germany Target line: Energy-related GHG emissions 200 Source: Prognos/Öko-Institut 2009 Fig. K 1: 0 Greenhouse gas emissions 1990 2005 2010 2020 2030 2040 2050 by sectors, 1990, 2005, and the target up to 2050, in million t of CO2 equivalent All sectors will have to make a huge contribution in order to reach this very ambitious goal. It becomes clear that a huge boost in efficiency to reduce energy demand and the exhaustion of renewable energy potentials will be needed. WWF commissioned a working group including Prognos / Öko-Institut / Dr Ziesing to perform a quantitative analysis of this issue for Germany. In addition to the question “what can and must happen on the technological level and how does the corresponding policy look like?”, it is also important to assess how far these solutions are from the currently discussed political path.
  • 5.
    This is whytwo quantitative scenarios have been developed: one scenario with an ambitious con- tinuation of today‘s energy and climate protection policy (reference scenario) as well as an innovation scenario that investigates the transformation to a low-carbon society geared towards a 95% reduc- tion. The continuation of today‘s energy and climate protection policy clearly fails to reach the target by 2050 (refer to Fig. K - 2). The reference scenario is used as the basis when calculating the costs and identifying the instruments of the innovation scenario. The comparison of emission trends in the reference scenario and in the innovation scenario shows that considerable greenhouse gases re- ductions are feasible up to 2050 in all sectors. Despite this, the emission reduction target of 95% against 1990 cannot be achieved with the measures considered in these scenarios. The remaining reduction gap would have to be filled with measures that are beyond the general framework specified in the scenarios. With a selection of corresponding measures (refer to section “Component Analysis”), it is possible to describe a version of a “Blueprint Germany” in which emissions levels in 2050 are 95% below 1990. 1990 2000 2010 2020 2030 2040 2050 0 Reference scenario -200 Million tonnes of CO2 equivalents -400 ? -600 and Blueprint Germany 45% Innovation scenario -800 -1.000 Source: Prognos/Öko-Institut 2009 Reduction target: 95% -1.200 Savings – total up to 2005 Savings – energy-related, other emissions Fig. K 2: Savings – private households Savings – volatile and process-related emissions Reference scenario: Savings – commerce, trade and services sectors Savings – product use emission reductions Savings – industry Savings – agriculture broken down into sectors, Savings – transport Savings – land use and forestry Savings – conversion sector, total Savings – waste management 1990 – 2050, in million t of CO2 equivalent Three strategy segments are distinguished for the development of long-term strategies necessary to implement the climate protection measures required in the “Blueprint Germany” version: • strategic goals, which serve as the basis for evaluating the target achievement up to 2050 as well as progress in the different sectors, both in general and with sufficient sectoral differentiation; • implementation strategies with which interaction between the different scopes of action up to 2050 will be addressed; • instrumentation strategies which contain the long-term guidelines for the political implementa- tion instruments. The following section describes emission trends and the structure of greenhouse gas emissions. The main contributions of the different sectors to reduce emissions are then broken down and strategic goals are subsequently identified. Based on this, the most important assumptions and results of the innovation scenario as well as the implementation strategies are presented sector by sector. In addition, a set of instruments is developed for the period up to 2030 that leads to the reduction in greenhouse gas emissions required in this period.
  • 6.
    6 7 Total greenhouse gas emissions 1.400 1.200 -14% 1.000 -26% Million tonnes of CO2 equivalents -35% 800 -40% -41% -45% 600 -63% Source: Prognos/Öko-Institut 2009 400 -77% -87% 200 0 As-is data Reference scenario Innovation scenario -200 1990 2005 2020 2030 2040 2050 2020 2030 2040 2050 Fig. K 3: HFC, CFC and SF6 – total Waste management Total greenhouse gas N20 – total Agriculture emissions 1990-2050 CH4 – total Industrial processes CO2 – industrial processes Energy-related emissions CO2 – energy-related CO2 – land use & forestry Overall, very different trends are shown for total greenhouse gas emissions in the two scenarios: • In the reference scenario, greenhouse gas emissions decline by around 36% in the 2005-2050 period. Compared to 1990, this corresponds to a reduction of around 45%. In 2050, percapita GHG and CO2 emissions amount to approx. 9 and 8 tonnes respectively. GHG and CO2 emissions accumulated since 2005 (in terms of a carbon budget) amount to approx. 38 and 34 billion tonnes respectively. • In the innovation scenario, emissions are reduced by around 85% in the 2005-2050 period. This corresponds to a reduction of 87% compared to 1990. In 2050, per-capita GHG and CO2 emis- sions amount to approx. 2.2 and 1.6 tonnes respectively; accumulated GHG and CO2 emissions amount to approx. 26 and 22 billion tonnes respectively. • In the Blueprint Germany, 2050 emissions are around 94% lower than in 2005; this corresponds to a reduction of 95% compared to 1990. Total greenhouse gas and CO2 emissions per capita in 2050 amount to 0.9 and 0.3 tonnes respectively, although these values take into account remain- ing greenhouse gas emissions and the creation of additional CO2 sinks through CCS in the area of biomass (-0.4 tonnes of CO2 per capita). For the 2005-2050 period, accumulated GHG and CO2 emissions total approx. 24 and 21 billion tonnes.
  • 7.
    Emission trends arecharacterised by the following developments: Relevant polluter sectors: • Energy-related emissions are and continue to be of paramount importance for the level of green- house gas emissions in Germany. Accounting for around 82% of total greenhouse gas emissions in 2005, this share falls to around 75% by 2050 in the reference scenario and to almost 62% in the innovation scenario. These developments also underpin the special role played by the energy sector in an ambitious climate protection strategy. • The contribution made by process-related emissions (in this case without the iron and steel industry) rises in the reference scenario between 2005 and 2050 from 7% to almost 8%. This con- tribution falls to around 5% in the innovation scenario. This suggests that a considerable potential for reductions is also possible in the medium term in the area of process-related emissions. • The increasing contributions from agriculture and land use and forestry over the period are an indication that the options for reducing emissions in these sectors are subject to much stronger limitations than in other sectors. In the reference scenario, for instance, the share of greenhouse gases from agriculture rises between 2005 and 2050 from 5% to 7%, and to more than 19% in the innovation scenario. Net contributions to emissions by the LULUCF sectors increase in the 2005- 2050 period from 4% to around 9% in the reference scenario and to around 11% in the innovation scenario. • Waste management has a less important role to play since its contribution to total greenhouse gas emissions is below 1% in the reference scenario and below 2% in the innovation scenario. Relevant greenhouse gases: • Carbon dioxide is the dominant greenhouse gas in both scenarios. In the reference scenario, the decline in the share of CO2 in total greenhouse gas emissions is very weak, i.e. from 89% to 88%. In the innovation scenario, the share falls from 89% to 75% between 2005 and 2050. • The importance of nitrous oxide increases considerably. In the reference scenario, the share remains stable in the range of 5% to 6%; in the innovation scenario, N2O accounts for almost 16% of total greenhouse gas emissions in 2050. • The share of methane emissions declines from 4.5% to 3.6% in the reference scenario between 2005 and 2050. This share rises in the innovation scenario to around 8.5% in 2050. • The emission trends of fluorinated greenhouse gases, which account for a share of 1.5% to 2% in the reference scenario and 1% in the innovation scenario, are of lesser importance.
  • 8.
    8 9 Component analysis and target achievement for the development of greenhouse gas emissions 0 Reference scenario -100 Million tonnes of CO2 equivalents compared to 2005 -200 -300 Blueprint Germany Innovation scenario -400 -500 Source: Prognos/Öko-Institut 2009 -600 -700 -800 -900 -1.000 2005 2010 2020 2030 2040 2050 Fig. K 4: Demands Renewable energies Waste management Sectoral contribution to Efficiency – electricity application Electrificationcation Agriculture GHG emissions trends Efficiency – buildings Fuel change (fossil) Land use and forestry Other energy efficiency Industrial processes Others On the whole, a 45% reduction in emissions (based on 1990) is achieved by 2050 in the reference scenario. The reduction amounts to 51% without land use, land use change and forestry (LULUCF). In the innovation scenario, a reduction of 87% (89% without LULUCF) is achieved by 2050. By the year 2040, emission trends in the innovation scenario roughly correspond to the trend which would have to be pursued to achieve the 95% reduction target. In order to reach the emissions level of the Blueprint Germany, additional emission reduction meas- ures have to be identified in order to fill the remaining gap of approx. 97 million tonnes of CO2 equivalent. A component analysis has been used to systematically compare the contributory effect of the different sectors or sources to emissions reductions in both scenarios. For the 2005-2050 period this results in: In the reference scenario, • the biggest reductions in emissions are achieved by various measures in the area of energy effi- ciency. By 2050, these measures will be responsible for around 46% of the total reductions in emissions whilst the most decisive contributions are made primarily by improved efficiency in the building sector and in industry; • the use of renewable energy accounts for a 29% share in emission reductions; • measures in the field of industrial process emissions make a considerable contribution with a share of around 3% o f emissions reduction whilst the cost-efficient reduction of N2O emissions in the chemicals industry, in particular, has an outstanding role to play.
  • 9.
    In the innovationscenario, • once again improved energy efficiency accounts for a contribution of 27% of additional emission reductions. The hugely increased efficiency of electricity applications is here decisive, since it accounts for around half of the total additional reduction in the field of energy efficiency; • additional emission reductions are largely made through the huge increase in the use of renewable energy which cover a share of 37% of total additional emission reductions. Around 7 percentage points result from the indirect effects of transport electrification (which, in the innovation scenario, can also be interpreted as a contribution by renewable energy); • emission reductions resulting from substitution in the field of fossil fuels are considerable and account for a share of 13% of additional emission reductions; • measures in the field of carbon sinks contribute around 4% to additional emission reductions. In the innovation scenario, the increase in energy efficiency and the increase in the use of renewable energy (both in the order of 35% by 2050) contribute to an almost equal extent (regarded as the aggregate contributions of the reference and the innovation scenarios) to the total reduction of emis- sions. Furthermore, significant contributions are also made, for instance, by the fuel switch in the case of fossil fuels (9%) as well as emission reductions in industrial processes (6%), and in the field of soils and forests (2%). Measures in all other areas (agriculture, etc.) add up to a share of 12% of total emission reductions. Around half of total additional emission reductions in the innovation scenario and around two thirds of energy-related emission reductions up to the year 2050 are due to measures designed towards particularly long-life capital stock (buildings, power stations, infrastructures, etc.). In their case it is particularly important to introduce the necessary climate protection measures on time. Similarly, around half of the emission reductions of the innovation scenario which will come into effect by 2050 are related to measures which will require considerable innovation (technology, costs, system inte- gration) over the coming years. Moreover, in the “Blueprint Germany”: • the significant base of industrial CO2 emissions that remains can be cut by around another 16 million tonnes of CO2 through the use of CCS in relevant industrial processes (pig iron production, cement production); • the remaining process heat demand and natural gas and heating oil applications in the commerce, trade and services sectors can be replaced by the use of biomethane; this would result in an addi- tional reduction of approx 25 million tonnes of CO2 emissions, but – in view of availability limits – would require the integration of a higher-level biomass strategy or corresponding complementary measures in the transport sector; • the wide replacement of conventional fuels with biofuels in aviation could additionally reduce emis- sions by approx. 22 million tonnes of CO2; the corresponding additional fuel quantities would have to be supplied by more extensive approaches in passenger transport (avoidance/shift as well as increase in electrification by around 20% in each case), in road freight transport (avoidance/shift of around 20%) or by biomass imports; • an additional carbon sink of up to 32 million tonnes of CO2 equivalents can be achieved by storing carbon dioxide from biofuel production in geological formations. These additional measures make the path for the “Blueprint Germany” possible and the reduction target of 95% can be achieved. If the reduction in emissions is put into relation with the emissions level without LULUCF, this results in a 96% reduction in emissions including the additional measures.
  • 10.
    10 11 Targets and strategic approaches to achieve the climate protection goals of the Blueprint Germany The analysis of the innovation scenario and the additional potentials • A very high share of the additional emission reductions required (also required in the “Blueprint Germany” provide the following strategic around 60%) is expected, especially after 2030, to come from emis- framework to achieve the targets: sion reduction options where significant innovation still has to be • a reduction of total greenhouse gas emissions by 40% by 2020, achieved in terms of technology, costs and system integration/infra- 60% by 2030, 80% by 2040 and 95% by 2050 (based on 1990); structure. This applies especially to electricity generation based on • an improvement of overall economic energy productivity by 2.6% renewable energy, electricity storage and infrastructure, the generation p.a.; of sustainable biofuels and the provision of sustainably generated • an increase in the share of renewable energy sources in overall biomethane, energy efficiency in industry, energy efficiency in con- primary energy to 20% by 2020, 35% by 2030, 55% by 2040 and ventional and electric vehicles as well as CCS technology. by more than 70% by 2050. • Advances for a range of central emission reduction options are in- In order to control targets and to monitor the progress achieved, it evitably linked to complementary options; without systematically makes sense to put safeguards in place for the different sectors. The designed strategy approaches the reductions aimed at could fail: respective sector-specific targets will be identified in the individual sector chapters. - Electrification of motorised individual traffic is inevitably linked, on the one hand, to the development of additional options for electric- Between the individual options for greenhouse gas reductions and in ity generation based on renewable energies (or CCS) and, on the the context of ambitious climate protection strategies, a series of sys- other, on the creation of intelligent electricity grids. tem connections and interactions have to be considered which must also be taken into consideration in the strategic shaping of the - The massive use of biofuels in road and air transport requires the respective climate protection and energy policies: availability of biofuels which meet high sustainability standards. • In all sectors, significant effort must be made to reduce emissions. - The use of decentralised efficiency technologies which initially run However, considering the scale of the contributory effects required, on natural gas (e.g. decentralised cogeneration), as well as the measures in the electricity sector (demand and generation), in the switch of industrial process heat generation to renewable energies building sector (new and existing buildings), in motorised private require in the medium to long term the availability of considerable transport, road freight transport, in air transport, in industry (includ- quantities of biomethane that is fed into the gas grids. ing process emissions), in agriculture and in the field of land use and forestry are particularly important. • The introduction of new electricity generation options as well as the - creation of capacities for modal shift require a long-term approach • It will not be possible to achieve the emission reduction targets by in the respective infrastructure development (transport and distri- 2050 without significant advances in energy efficiency, nor without bution network, CO2 infrastructure for CCS, rail network). a huge increase in the share of renewable energy. • Limits to potential must be considered for at least two central emis- • A very high share of the additional emission reductions required sion reduction options, i.e. the use of biomass and the introduction (around 60%) is related to long-life capital stock (buildings, power of CCS, and a suitably active approach must be pursued for stations, infrastructures, etc.). Delays in implementing measures will strategic resource management: mean that the target will not be reached or that the costs of climate protection policy will rise very steeply. This is why measures are - If for the transformation switch of the energy system in to biomass is urgently required over the course of time in the field of electricity to be primarily restricted to the – limited – domestic or European po- demand (efficiency on the one hand and electrification on the other), tential, sustainability requirements will have to be met. The use of bio- electricity generation, buildings (new and existing buildings), infra- fuels is justifiable only on condition that these are sustainably structures (electricity, gas, heat, CO2, transport) as well as in the cultivated in both social and ecological terms and according to transport shift. legally binding regulations and standards. Adherence to minimum
  • 11.
    standards for sustainabilitymust be assessed and guaranteed through • In all areas, the political implementation measures must also promte certification systems. Internationally coordinated, binding regulations a continuous and targeted innovation process in order to bring and minimum standards that warrant the sustainability of agricultural climate protection options to market maturity as quickly as possible. resources are vital if the use of biofuels is to be expanded. When these Support measures for early market introduction processes have an preconditions are fulfilled, priorities for use must be established and important role to play here. monitored. In addition to usage priorities also the generation of bio- mass is of utmost importance in the framework of an all-encompass- • The significant pricing of greenhouse gas emissions forms the ing biomass strategy. The conversion of waste and residues should be necessary basis for an ambitious and successful climate policy. prioritised over the cultivation of energy plants. • If climate protection options with a significant solution potential are - Regarding biomass, priority must be given to applications that lack not compatible with the applicable market structures (such as fluc- sufficient alternatives. This applies, on the one hand, to the remain- tuating supplies of large electricity quantities from renewable energy ing fuel use in road transport (after extensive electrification of sources), then the market structures must be gradually adjusted. motorised individual transport) and to air transport. Process heat applications (especially in industry) should be seen as the next • Regulatory approaches make sense and are necessary for very priority, only then to be followed by electricity generation from homogenous technologies and/or climate protection options as biomass. Regarding the use of biomass to generate electricity, far as special support measures are needed. stricter efficiency requirements apply: generating electricity from biomass without using cogeneration is not compatible with a long- • As far as market developments in the field of long-life capital stocks term climate protection and energy strategy. could lead to lock-in situations that in the long term prevent the achievement of ambitious climate protection targets, suitable regu- - The storage available for CCS is a limited resource (also in terms of latory measures should be adopted. competition to use the underground) for which use priorities and management approaches must be developed. Priority is given • The creation of a robust and sustainable energy efficiency market here to process-related CO2 emissions and the use of storage for is vital for the broad and significant increase in energy efficiency. carbon dioxide from biomass conversion processes (production of biofuel, generation of electricity from biomass). This prioritisation • The development of infrastructures for the energy and transport should also be considered when addressing the question as to systems must be planned and pushed ahead with a long forerun which contribution is to be assigned to CCS in electricity genera- and hence with considerable uncertainties. This will lead to a special tion in the climate protection and energy strategy. (new) field of government responsibility. • The climate-friendly conversion of the energy and transport system Finally, a careful analysis of the long-term implementation strategies and requires considerably improved efficiency in the use of energy-inten- the short to medium-term political instruments must take into account sive materials and products. the consistency of short-term, medium-term and long-term solution contributions. Not all approaches which will no longer be relevant in the With a view to the political implementation tools which will and long-term target structures are automatically problematic in the short to must change in terms of direction and design, the following strategic medium term (e.g. the distribution of fossil energy generation with a approaches are of higher and more long-term importance: biogas potential that is limited in the long term). What is central here are the medium-term switch strategies and the precondition that no contra • Securing a sufficiently diverse range of players and competitive productive structures are created in the short to medium term. At the markets forms a key precondition for the development of robust same time, the solutions required in the long term can lead to problem- and efficiently designed climate protection paths. An insufficiently atic structures (e.g. biofuels with insufficient sustainability standards). diverse range of players increases the risk of lock-in effects and Targeted policy and innovation approaches with clearly defined time could hinder or delay the innovation processes required. horizons are vital in these areas.
  • 12.
    12 13 Framework data 3.500 90 Source: Prognos 2009 82,5 80 3.000 78,6 2.981 2.981,0 72,2 70 2.500 2.598 60 In million people 2.000 2.124 50 in bn € 1.500 40 30 1.000 20 500 10 Fig. K 5: 0 0 Framework development: 2005 2030 2050 2005 2030 2050 gross domestic product in billion€ and population in Gross domestic product Population millions, 2005 to 2050 The framework data describes the assumptions regarding aBevölkerung Bruttoinlandsprodukt few macroeconomic variables underlying the scenarios. Despite average net immigration figures of approx. 150,000 persons p.a. for the period from 2005 to 2050, population figures will decline by 12.5% over that period, which represents about 10 million people. Ageing will continue: The group of people over the age of 65 grows by 6.2 million while the number of people under the age of 65 will fall in total by 16.5 million. In 2050, there are 12.5 million fewer people of working age (20 to 65 years old) than in 2005. The average household size declines from 2.10 to 1.86 persons. One and two-person house- holds increase by 3.2 million while the number of larger households declines significantly. The average living space per capita moderately increases further, on the whole by 253 million m2. New built homes are primarily one and two-family homes. Until 2030, the addition of living space in new buildings surpasses the number of age-related withdrawals. After this, the trend reverses and living space then declines in total by an average of 6.6 million m2 annually. Gross domestic product (GDP) in 2050 is around one third above the level of 2005. Following the crisis-related decline in 2009, the previously attained growth path is scarcely reached. With a declining population, average increases in GDP between 2020 and 2040 are moderate. GDP growth per capita will be higher, totalling between 0.6% p.a. for the period 2025 to 2030 and 1.4% p.a. for the period 2045 to 2050. Unemployment will substantially decrease until 2050. Due to demographic change, the workforce will decrease faster than employment opportunities. The services sector is becoming increasingly important for economic growth. Between 2005 and 2050, gross value added increases by around 46%. In the period from 2005 to 2050, industry grows by almost 20%. Energy-intensive industries, which in 2005 accounted for approx. 14% of overall industry production, will reduce their output by 2050 by more than 20%. However other industrial sectors will grow by around 44% in that period. This confirms the continuation of structural change that has been taking place since the 1980s. In face of the challenges ahead, industry will secure its international competitiveness through technical progress, innovative and knowledge-based products as well as through internationally coordinated collaboration in technology.
  • 13.
    Passenger transport isand remains strongly marked by motorised individual mobility. Due to the decline in population, absolute passenger transport performance declines by 10% between 2005 and 2050. Due to economic development and the ongoing increase in international trade, freight transport performance increases by 86% between 2005 and 2050. Rail accounts for a considerable share of this growth since freight transport by rail increases by 191% while freight and inland navigation increase by only 67% respectively 47%. The share of rail transport in freight rises from almost 17% in 2005 to 26.5% in 2050. Air transport performance rises by 7% in the period under review by, hence much slower than road freight. The sustainable biomass potential (without competing with food production or generating a reduction in the ecological quality of previously high-quality land) is very limited in Germany and is estimated at approx. 1,200 PJ of primary energy. This rules out the idea of completely replacing fossil fuels with bio-fuels. Instead, strategic approaches will be needed to use biomass products in areas where there are no alternatives. Technology development Current technology developments on the demand side will continue in the areas of energy and material efficiency. The reference scenario however shows that the climate protection targets cannot be reached with these technologies when applied in existing structures even if upgraded in an ambitious manner. In order to reach the targets, systematic changes will also be needed in the development of products, materials and production processes. Key technologies, above all (nano- technology, biotechnology and microsystem technology), must be developed with energy and material efficiency in mind. These new technologies can pose risks. Before being put to use, each individual technology must hence be examined in terms of its sustainability. On the other hand, efficiency developments beyond the scope of the reference scenario are inconceivable without such qualitatively new technology developments and approaches. The key new fields of technology in which innovation is needed and is assumed as implemented in the innovation scenario, are, for example (only an illustration rather than a complete listing): • New materials: energy efficient materials, tailored according to specific properties, which avoid the use of metals for static functions (e.g. for load-bearing skeletal structures in buildings or resistant skins for vehicles). • High-performance thermal insulation which can be easily and extensively used in existing build- ings; specific, reactive window coatings which enable considerable savings in room heating in winter and reductions in radiation exposure in summer. • New building materials based on plastic and composite materials. • Biological production processes in the chemicals sector, e.g. using specialised bacteria or enzymes to synthesize substances; use of catalytic processes to reduce excitation energy. • Microprocesses for producing special products “on the chip” (e.g. pharmaceuticals). • Optoelectronics to boost the bandwidth, speed and performance density of electronic applica- tions; reduction of waste heat with increasingly more powerful IT applications. • Miniaturisation of displays (visors instead of monitors). • Optimised and efficient battery systems and power storage. • Highly efficient production of biofuels of the second (and third) generation. • Process optimisation and optimisation of building management through control and instru- mentation equipment. • Grid optimisation and demand side management to balance out peak loads, to reduce power storage use and losses, and to integrate fluctuating renewable energy into the power system. • Photovoltaics of the third generation (on an organic basis). • High performance transport infrastructures thanks to information and communication technology. • Carbon capture and long-term storage in secure geological formations (CCS).
  • 14.
    14 15 Private households sector 3.000 100 Source: Prognos 2009 Index – CO2 emissions 90 2.500 80 70 2.000 60 Index 1.500 50 PJ 40 1.000 30 20 500 10 Fig. K 6: 0 0 Final energy consumption 2005 2005 2020 2020 2030 2030 2040 2040 2050 2050 2005 2020 2030 2040 2050 by private households in the innovation scenario broken Solar Biogas Gas Cooking Index – CO2 emissions down according to energy sources and uses, in PJ, Environmental heat District heating Oil Electrical appliances Bruttoinlandsprodukt index of direct CO2 Wood Electricity Coal Hot water emissions, 2005 – 2050 Heating In the private household sector, direct CO2 emissions fall by 98% from 212 million tonnes to 3 million tonnes between 2005 and 2050. • The key to reducing emissions in this sector is to reduce space heating demand. Space heating is the one application where efficiency measures can lead to the by-far greatest share of savings in final energy, both in absolute and relative terms. Specific space heating demand in buildings will be reduced to almost zero both in new buildings and in existing buildings thanks to building measures (thermal insulation of the building shell and of windows). From 2025 / 2030 onwards, suitable materials will be available for standard application. The rate of refurbishment of existing buildings will double after 2012 from almost 1% to approx. 2% p.a.,, the energy-related standard of refurbishment from 2025 onwards corresponds to an ambitious new building standard. Specific space heating demand in new buildings is reduced successively in steps by approx. 50% until it reaches almost zero after 2030. • Thanks to the use of further-enhanced, water-saving fittings, hot water consumption per capita falls by more than 10% with growing comfort. By 2050, energy demand for the generation of hot water will be reduced by 37% compared to 2005. • The efficiency improvements of household appliances will be strongly developed so that by 2050 average specific energy consumption will have fallen by 70% to 80%. Magnetic refrigerators will be standard, as will be waterless washing machines, thus making tumble dryers superfluous. Despite the convergence of (electronic) media, other electric applications lead to an increase in the number of appliances in households. Specific energy consumption by electronic devices and appliances will fall by 70 to 80% primarily due to new display technologies; in total, electricity demand for electric appliances will fall by 40%.
  • 15.
    In order toachieve the required reductions, the following strategic safeguards must be put in place: • In the building sector - an average annual final energy consumption standard of 20 kWh per m2 should be achieved for space heating in new buildings starting around 2015, and decreasing to around 10 kWh per m2 after 2020 with the goal of zero-energy or plus-energy houses after 2025 - specific final energy consumption in existing buildings should be cut by more than half from 2005 to 2030 and by around 90% by 2050; - the share of renewable energy or (directly) emission-free energy sources (district and local heat- ing) in overall energy for the remaining space heating and hot water generation should be increased to around 40% by 2030 and to at least 75% by the year 2050. • The following implementation instruments can be derived from this for the time horizon until 2030: Building-specific instruments to boost energy efficiency - Stricter new building standards with a maximum, annual final energy consumption value for space heating of 20 kWh per m2 starting 2015, of 10 kWh per m2 starting 2020 and the zero- energy or plus-energy house standard from 2025 onwards; - Continuation and improvement of subsidy programmes for building refurbishment to secure refurbishment rates of more than 2% p.a. and long-term refurbishment efficiency of 90%. • Energy efficiency programmes specifically for electricity - Consistently strict consumption limits for all electric appliances according to the top-runner principle (consumption values of the best appliances as minimum standards to be achieved by the next generation of appliances within five years); - Ban on night storage heating after a transition period of five years (accompanied by subsidy programmes).
  • 16.
    16 17 Services sector 1.600 100 Source: Prognos 2009 90 1.400 Index – CO2 emissions 80 1.200 70 1.000 60 Index 800 50 PJ 40 600 30 400 20 200 10 Fig. K 7: 0 0 Final energy consumption 2005 61,78212534 59,76954403 58,00007213 2030 63,0582195 60,77583469 202058,76325338 57,0746667 56,6289752 2040 56,22375889 53,00551107 2050 54,66826609 51,77759654 48,78789829 by the services sector in the innovation scenario, broken Renewable (with biofuels) Office equipment Index – CO2 emissions down according to types of District heating Power use and energy sources, Electricity Bruttoinlandsprodukt Process heat Bevölkerung in PJ, index of direct CO2 Gas Lighting emissions, 2005 – 2050 Fuels (including biofuels) Cooling and ventilation Oil Heating Coal Between 2005 and 2050, direct energy-related CO2 emissions in the services sector fall by 85% from 58 million tonnes to 8 million tonnes. • The greatest part of this reduction is achieved in space heating. Specific space heating demand in services buildings falls to almost zero by 2050 both in the case of new buildings and existing buildings. Since buildings in the commercial sector are more likely to be torn down rather than refurbished, the turnover of buildings is higher than for private households. • Due to cooling demand as a result of global warming, final energy demand for air conditioning increases. This will be kept in check by the highly efficient production of cold (e.g. with heat pumps and the use of renewable energy sources and waste heat). • When it comes to providing process heat and power, the possibilities for saving energy are physi- cally limited. Shifts in technology, both in the case of process design and in the organisation of services, will help to achieve a 17% decline in process heat demand despite an almost 50% increase in value added. Sterilisation with UV light, water-free washing machines, etc. are some examples of savings. • When it comes to power applications, the most efficient cross-section technologies will be used for electric motors, pumps and compressed air. Moreover, material-efficient processes and altered ma- terials (e.g. in vehicle construction) will be used in a targeted manner and will reduce specific demand for mechanical energy for each value added unit by up to 80%. This reduces energy demand for power applications by almost 52%. • Total final energy demand in the services sector in 2050 is 66% below the 2005 level. Almost half of the remaining demand will be covered by electricity. Especially when it comes to providing process heat, gas will remain an important energy source, accounting for 26% of the total mix. Renewable energy sources (Geothermal heat, solar heat, as well as biofuels to a very small extent) will cover the demand that remains. The targets and instruments resulting for the 2030 time horizon for buildings match those of the household sector. This is supplemented by high efficiency requirements for cooling equipment (from approx. 2030 on, these will run only combined heat and power, heat pumps or with renewable energies). In the case of highly standardised devices, the instruments applicable to the private house- hold sector must also be applied.
  • 17.
    Industrial sector 2.500 120 Renewables Source: Prognos 2009 District heating Electricity 100 Gases 2.000 Mineral oil Index of CO2 emissions Brown coal 80 Hard coal 1.500 Heating Information and Index 60 communication PJ Mechanical energy 1.000 Process heat Lighting 40 Index – CO2 emissions 500 20 0 0 Fig. K 8: 2005 2020 2005 2006 2007 2030 2008 2009 2010 2040 2011 2012 2013 2050 Final energy consumption by the industrial sector in the innovation scenario, broken down according Direct CO2 emissions by the industrial sector decline in the innovation scenario from 101 to 36 million to types of use and energy sources, in PJ, index of tonnes between 2005 and 2050; this corresponds to a reduction of 64%. direct CO2 emissions, • The main contribution to this reduction results from the reduction of process heat demand. In 2005 – 2050 2005, process heat had a 66% share in final energy consumption and was the main form of energy use in industry. Through persistent shifts in technology and processes, specific process heat con- sumption falls by approx. 68% by 2050. New production methods and shifts from energy-intensive (e.g. metal production) to less energy-intensive industrial sectors reduce absolute process heat demand by 50% despite an almost 20% increase in production. • Power applications are the second highest form of energy use in industry, accounting for 21% in 2005. Highly efficient cross-section technologies and specially developed optimisation of materials, products and processes reduce final energy use here. All in all, energy demand for these applica- tions falls by 43% between 2005 and 2050. • Specific space heating demand in industrial buildings falls very steeply by the year 2050. • In the industrial sector, the reduction of emissions is subject to physical limits when it comes to the specific consumption by processes using heat and power. This is why energy savings are limited to 53% in the industrial sector between 2005 and 2050. • The energy mix in industry is dominated by electricity (41%) and gas (39%). In order to achieve the innovation scenario and also the reductions called for in the “Blueprint Germany”, the following strategic safeguards must be put in place: • Energy productivity should be roughly doubled from 2005 to 2030 and tripled by 2050. • The share of renewable energy and emission-free energy sources (district and local heating, electricity) in total final energy demand should rise to around 60% by 2030 and to 90% by 2050. • By 2050, CO2-intensive industrial processes should only be operated in conjunction with CCS. • Process-related greenhouse gas emissions should be reduced from today’s level by more than 50% by the year 2030 and by 90% by 2050. In addition to the political measures to create a flexible system allowing for the quantitative control of energy savings referred to in section ”Key Elements of an integrated climate protection and en- ergy programme” and the ability to deduct energy-saving measures from taxation, the following sector-specific implementation instrument for the 2030 time horizon is needed: • Binding introduction of energy management systems in industry. This must be supported by incentives for the development and use of efficient technology innova- tions. This applies especially to application-orientated research.
  • 18.
    18 19 Transport sector Passenger transport Freight transport 2000 Source: Prognos/Progtrans 2009 1800 1600 1400 1200 PJ 1000 800 600 400 200 Fig. K 9: 0 Final energy consumption 2005 2030 2050 2005 2030 2050 by passenger and freight transport in the innovation Passenger rail transport Inland waterway transport scenario, broken down Short distance public transport - roads Rail freight transport Bruttoinlandsprodukt Motorised individual road transport Bevölkerung Road freight transport according to modes of transport, in PJ, Passenger air transport Air cargo transport 2005 – 2050 Direct CO2 emissions of the transport sector will decline in the innovation scenario in the period from 2005 to 2050 from 180 million tonnes to 30 million tonnes, corresponding to a reduction of 83%. • Central elements for the reductions in the transport sector are vehicle efficiency in motorised indi- vidual transport, electrification of motorised individual transport and the contribution of freight transport switching to renewable energy sources. • Electric vehicles will be introduced to the passenger car fleet. Vehicles with combustion engines without a hybrid part will no longer be of any relevance after 2045. In 2050, hybrid electric vehicles account for around 36% of cars, plug-in hybrids for 28% and battery electric vehicles for 18%. • By 2040, the average specific energy consumption of new passenger cars with combustion engines declines by approx. 60%. By 2050, the average fleet consumption (calculated over the entire vehicle fleet and performance) falls by 64%; specific CO2 emissions per vehicle kilometre decline to approx. 40 g per km. • In freight transport, a large part of transport growth shifts to rail transport. Electrification of the HGV fleet is not assumed; this is due to the power density which this requires and for which no battery technologies are foreseeable. Specific consumption by HGVs falls by approx. 25%. • Air traffic performance (domestic principle) declines both for passenger and for freight transport. Between 2005 and 2050, energy efficiency increases by approx. 40%. This means that energy consumption by air traffic falls in total by 10%. • Due to the more efficient vehicles and the efficiency advantage in terms of final energy of electric vehicles and rail transport, final energy consumption by the transport sector declines in total in the period under review by 41%. • In 2005, final energy demand by transport will hence be mainly covered by biofuels (59%) of the second and third generation and by electricity (12%). Hydrogen and gas have a minor role to play. By 2050, all mineral-oil based fuels in the innovation scenario will be replaced by second and third- generation biofuels. This means that the sustainable biomass potential available in Germany is almost completely exhausted. (This calls for a strategic decision concerning the targeted use of the biomass potential in the transport sector, rather than in favour of the generation of low-temperature heat).
  • 19.
    3000 120 Electricity Source: Prognos/Progtrans 2009 Hydrogen Index – CO2 emissions Liquified petroleum gas 2500 100 Natural gas Aviation fuels Diesel from mineral oil 2000 80 Passenger transport Biodiesel Petrol from mineral oil 1500 60 Bioethanol � PJ 1000 40 Freight transport 500 20 Fig. K 10: 0 0 Final energy consumption 2005 2020 2030 2040 2050 by passenger and freight transport in the innovation In order to achieve the “Blueprint Germany” in the transport sector, the following strategic safeguards scenario, broken down according to energy sources, must be put in place: in PJ, index of direct CO2 emissions, 2005 – 2050 • In the field of motorised individual transport, - transport avoidance or transport shifting should reduce performance by 2030 by around 20% and by 2050 by around 30%; - specific final-energy consumption of the vehicle fleet (including the efficiency effects resulting from electric vehicles) should be reduced by more than 60% by the year 2050; - the aim should be to achieve a 7% share of electric drives in total performance by 2030 and around 50% by 2050; - the aim for the year 2050 should be to achieve almost complete coverage of final energy demand through renewable (biofuels) or emission-free (electricity, hydrogen) energy sources. • In the field of road freight transport, - performance in 2050 should not exceed the current level by more than one third; - specific energy consumption by the entire vehicle fleet should be reduced from today until 2030 by 30% and by 2050 by around 50%; - the entire remaining fuel consumption must be converted to renewable energy sources (biofuels, hydrogen) by 2050. • In the field of air transport, - specific energy consumption by the entire aircraft fleet should be reduced by 20% by the year 2030; - fuel use must be fully converted to regenerative energy (biofuels) by the year 2050. With a view to the political instruments for implementation for the 2030 perspective, this means the follow- ing set of measures: • An investment programme to double the capacity of Germany’s rail network by 2030. • An investment programme to boost by 25% the performance of public passenger transport by 2030 (and to make public passenger transport more attractive). • Stricter limit values for passenger cars to be set at 70g of CO2 per km in 2030 (without the inclusion of biofuels and without the non-inclusion of electric vehicles). • Creation of HGV fleet limit values of about 30% below the current values by 2030 (including the establish- ment of a suitable test cycle and calculation basis); • Increase in the HGV road toll to 50ct per km in 2030, granting of an efficiency bonus and expansion to include all HGV and the entire road network • Increase in fuel tax to a level that results in 2030 in a price of €2.50 per litre for conventional petrol. • Considerable increase in the share of biofuels by combining high and reliably verifiable sustainability standards for biomass and a further-developed biofuel quota based on a biomass strategy (the height of the quota is determined by the sustainability standards and the CO2-emissions reduction potential) by the year 2030. • A speed limit of 120kph on all motorways.
  • 20.
    20 21 Final energy consumption 10.000 120 Source: Prognos/Progtrans 2009 9.000 Index – CO2 emissions 100 8.000 7.000 80 6.000 Index PJ 5.000 60 4.000 40 3.000 2.000 20 1.000 Fig. K 11: 0 0 Total final energy con- 2005 2020 2005 2006 2007 2030 2008 2009 2010 2040 2011 2012 2013 2050 2014 2015 sumption in the innovation scenario, broken down Solar energy District heating Diesel from mineral oil Transport according to energy Environmental heat Electricity Petrol from mineral oil Industry sources and sectors, in PJ, index of direct CO2 Biomass Gases Fuel oil Commercial, trade and services sectors emissions, 2005 – 2050 Biogas Aviation fuel Coal Private households Biofuel Index – CO2 emissions CO2 emissions from the direct, energy-related combustion of fossil fuels decline in the innovation scenario between 2005 and 2050 from 459.4 million tonnes to 77.7 million tonnes, and hence by 85%. • Final energy demand on the whole declines between 2005 and 2050 by almost 59%. • All sectors will contribute to this with considerable savings in consumption. The biggest savings are made in the private households (-76%) and services (-67%) sectors because space heating (in the 2005 reference year) dominates consumption here and this can be practically fully reduced through energy efficiency measures. Savings of 53% are made in the industrial sector. Compared to the refer- ence scenario (savings between 2005 and 2050: 21%), innovation and industry shifts will cut consump- tion considerably. In the transport sector, consumption in 2050 is 41% lower than the baseline. • In 2050, mineral oil products will be primarily used in air transport and inland waterway transport, and to a very small degree to generate process heat in industry. These products continue to account for a share of almost 10% in the overall energy mix. In motorised passenger and freight transport, they will be systematically replaced by second and third-generation biofuels that have been produced with high efficiency. • In 2050, natural gas will be primarily used to generate process heat in the industrial and services sector, to a lesser degree in innovative technologies for combined generation of heat and electricity, of heat and cold, as well as in passenger cars. In 2050, natural gas accounts for 20% of the energy mix. • Electricity will be used in all sectors for additional purposes and applications, and will be introduced into the transport sector for passenger cars. Despite this expansion, the persistent implementation of efficiency technologies along with technology shifts will lead to an overall decline of 37% in electricity consumption in the period under review. The share in the final energy mix rises from 20% to 30%. • The use of renewable energy (solar heat, ambient heat, biofuels) triples in the period under review. Its share in the final energy mix rises from 4.3% to 36.6%, due to the significant decrease in overall consumption.Taking the additional measures in the “Blueprint Germany” into considera- tion, the share of renewable energy in overall final energy consumption (in a certain bandwidth – depending on the complementary development assumed in the field of transport avoidance, addi- tional electrification of transport or additional vehicle efficiency) reaches a level of around 30% in 2030, around 40% in 2040 and around 50% in 2050.
  • 21.
    Electricity generation electricity generation without CCS 700 Electricity imports Source: Prognos 2009 Renewables 600 Stored power (pump storage, others) 500 Natural gas Oil and others 400 Brown coal TWh Hard coal 300 Nuclear power 200 Fig. K 12: Net electricity generation by German power stations in the 100 innovation scenario (variant without CCS), broken down according to energy sources in 0 TWh, 2005 – 2050 2005 2020 2030 2040 2050 Steinkohle Braunkohle CO2 emissions from electricity generation fall between 2005 and 2050 from 323 million tonnes to Erdgas Speicher (Pumpspeicher, sonstige) 14 million tonnes and hence by 96%. Stromimport The general decline in electricity demand (refer to section “Final energy consumption”) is a pre- condition for the growing decarbonisation of electricity generation. Renewable energy has a very high share of net electricity generation. A high share of the renewable energy (237 TWh) is supplied by variable wind and Photovoltaics, making considerable intermediate storage and balancing capacities necessary. This requires a number of gas power stations and the extensive increase in storage volumes. The infrastructure-related preconditions for this are the provision of grid capacities to integrate and transport power supplied by offshore wind power plants (38 GW) as well as grids with realtime response capability to manage decentralised feed-in (29 GW of photovoltaics, 34 GW of wind, onshore) as well as the integration and management of storage capacities. In 2050, the import balance (electricity from renewable energy) totals 48 TWh max. and is hence below the quantity assessed as possible in the 2008 Environment Ministry’s pilot study. Generally speaking, imports are not ruled out in any of the scenarios. electricity generation with CCS 700 Electricity imports Source: Prognos 2009 Renewables 600 Stored power (pump storage, others) 500 Natural gas Oil and others 400 Hard coal TWh with CCS 300 Brown coal Hard coal 200 Hard coal Fig. K 13: with CCS Net electricity generation by Nuclear power German power stations in the 100 innovation scenario (variant with CCS), broken down according to energy sources, in PJ, in TWh, 0 2005 – 2050 2005 2020 2030 2040 2050
  • 22.
    22 23 >> In the variant “with CCS”, CO2 emissions fall from 323 to 23 million tonnes and hence by 93%. This variant assumes the large-scale availability and implementation of CCS technology. At the same time, it is estimated that the expansion of renewable energy is not fast enough. In this case, new fossil fuel power stations equipped with CCS technology could be erected. In the variant with CCS, it is assumed that starting in 2025, this technology will be the standard, first of all, in new lignite power stations, and starting in 2035, in new hard coal power stations also, and that CO2 storage is sustainable and safe. No more new coal-fired power stations without CCS technology will be built after 2025. The old coal-fired power stations without CCS will leave the mix by 2046 for reasons of age or economy. In 2050, there are no more coal-fired power stations without CCS in the mix, but there are still 3 GW of hard-coal capacity and 10 GW of lignite capacity with CCS technology. There are still 17 GW of gas power station capacity available to produce peak load energy. The volume of electricity from renewable sources is lower than in the variant without CCS and in Bruttoinlandsprodukt Bevölkerung 2050 totals 243 TWh, accounting for around 66% of the total net electricity volume generated. Conventional baseload power plants also exist. That’s the reason why storage demand is lower than in the variant without CCS, but still has to increase five-fold compared to 2005. The require- ments for the expansion and conversion of infrastructural preconditions (transmission grids, smart grids) match those of the variant without CCS and are in line with the somewhat slower increase in renewable energy. In order to achieve the “Blueprint Germany” in the electricity sector, the following strategic safe- guards must be put in place: • By 2030, electricity demand (including new application areas, such as electrification of transport) should be reduced by around 25% until 2030 and subsequently further reduced by 10 percentage points until 2050. • The share of renewable energy in electricity should reach a level of 60% by 2030 and of 95% by 2050. • The remaining fossil electricity generation capacities should only be permitted to operate from 2040 onwards if they are equipped with CCS. • In order to balance out the huge increase in contributions by variable power generation, existing storage capacity (up to now primarily pumped-storage power stations) should be increased by 2030 by a factor of 3.5 and by a factor of 8 by the year 2050. In order to reach these targets, the following set of instruments is proposed: • Introduction of a moratorium for coal-fired power stations without CCS. • Further development of the renewable energy feed-in law (maintaining priority dispatch, innovation-orientated cost degression, promotion of the generation of electricity from biomass only with cogeneration); • Creation of additional market incentives (market model) to provide power and balancing capacity for the different (big and small) consumer groups. • Development of a long-term electricity storage expansion programme that can in the medium and long term supplement the interconnectivity of the German electricity system with neighbouring nations and regions which is also necessary.
  • 23.
    Primary energy consumption 16.000 100 Source: Prognos 2009 90 14.000 Index – CO2 emissions 80 12.000 70 10.000 60 8.000 50 PJ 40 6.000 30 4.000 20 2.000 10 Fig. K 14: 0 0 Other conversion Primary energy consumption (wi- 2005 2020 2030 2040 2050 Electricity generation 1985 1986 1987 1988 1989 1990 1991 1992 1993 1994 1995 1996 1997 1998 1999 2000 2001 thout non-energetic consumption) Generation of district heating in the innovation scenario (variant without CCS), broken down ac- Hydropower Environmental and Gases Petrol from mineral oil Transport cording to energy sources and Wind energy waste heat Aviation fuel Fuel oil Industry sectors, index of energy-related Solar energy Biomass Biofuels Coal Commercial, trade and CO2 emissions, 2005 – 2050 Geothermal Waste Diesel from Nuclear power services sectors energy Biogas mineral oil Index – CO2 emissions Private households Direct energy-related CO2 emissions decline in the innovation scenario variant without CCS between 2005 and 2050 by 757 million tonnes, or 89%, respectively, and in the variant with CCS by 748 million tonnes, or 88%, respectively. Between 2005 and 2050, primary energy consumption (without non-energetic consumption) falls by 57% from 13,546 PJ to 5,766 PJ. Consumption of conventional energy sources will decline by 85% whilst use of renewable energy will rise in total by a factor of almost 6. Nuclear power and coal will no longer be part of electricity generation (in the variant without CCS), coal will only be used to a lesser degree in metal production. In the innovation scenario, mineral oil products will only continue to be used as aviation fuel and in residual quantities for the generation of process heat; its consumption will decrease by 91%. Natural gas and other gases are the only fossil sources of energy which will have any kind of a role to play in the mix. They will be used in the services and industrial sector to produce process heat. Gases will also be used to generate peak load energy and balancing energy and to a lesser extent to produce cogenerated electricity (accompanied by low-temperature heat). The use of primary energy in electricity generation will be reduced by 49%. Renewable energy sources with their per-definition excellent efficiency will contribute considerably to this development. The around 74% decline in energy used to generate district heating is largely a consequence of falling demand. In the “other conversion” area, conversion declines due to the fall in the use of min- eral oil products. In contrast to this, the increased production of biogas and biofuels leads to greater use of biomass. All in all, the use of energy sources in other conversion changes only slightly (-3%). The substitution of fossil fuels with biofuels and the (reduced) use of biomass and biogas in the gen- eration of electricity and heat result in around 1,700 PJ of biomass being used in total for primary energy. This volume exceeds the potential that can be generated in a strictly sustainable manner in Germany. As a condition for the use of imported biomass from Europe or global markets binding regula- tions and legal standards for the ecological and social integrity of the biomass have to be implemented. Taking the additional measures of the “Blueprint Germany” into consideration, the share of renew- able energy sources in overall primary energy consumption reaches a level of around 43% in 2030, of around 65% in 2040 and around 85% in 2050.
  • 24.
    24 25 Costs and savings 40 Source: Prognos 2009 30 20 10 Bn € 0 2010 2015 2020 2025 2030 2035 2040 2045 2050 -10 Fig. K 15: Additional cost of the -20 innovation scenario for the Investments national economy vs. saved Results without CCS expenditure for imported -30 Results with CCS fossil fuels, 2010 – 2050, in billion (real, 2000) Savings with CCS -40 Savings without CCS The innovation scenario includes investments and strategic decisions which lead to additional costs compared to the reference scenario with its continuation of current energy policy. In contrast to this, the reduced use of fossil energy sources especially means savings for the economy. All in all, integrated costs which total a maximum of 0.6% of GDP are comparatively low and economically acceptable. Additional investment and hence additional costs will be generated by: • more extensive refurbishment of existing buildings and on the whole very demanding energetic building standards, especially in the private household sector; • the introduction of electric vehicles in the field of passenger cars, including infrastructure, as well as the improvement of freight transport logistics, including handling centres; • the changeover of processes in the industrial and services sector, as well as technology development; • the changeover of power stations to renewable energies, the expansion of storage capacities and the introduction of CCS technology. 30.000 Source: Prognos 2009 25.000 20.000 Mio. € 15.000 10.000 Rail infrastructure EV charging infrastructure Electric vehicles Fig. K 16: Industry Elements of additional services, commerce and trade costs in the Innovation scenario 2010 – 2050 electricity in Mio. € (real, 2000) space heating (buildings) 2010 2015 2020 2025 2030 2035 2040 2045 2050
  • 25.
    This is setoff by the saved expenditure for imported fossil fuels, calculated at import prices. Assuming that starting in 2010 targeted investment begins, annual additional costs rise from approx. € 6 billion in 2010 to a good € 32 billion max. in 2033; after this, they fall slowly to approx. € 22 billion per year. Annual savings from the lower use of fossil fuels grow continuously due to investment in savings and rising energy prices to € 29 billion annually, and to approx. € 30 billion in the variant with CCS. From 2044 on, savings outweigh investment. Net savings rise to € 6.6 billion p.a. In 2024, this leads to maximum net costs for the economy of almost € 16 billion (approx. 0.6% of GDP) after which time, this burden will decline. Added together over the entire period under review (and with a discounted, long-term interest rate of 1.5%), this results in a burden of approx. 0.3% of GDP. Energy-related greenhouse gas emissions 1.200 Source: Prognos 2009 1.000 Million tonnes of CO2 equivalents 800 600 400 Fig. K 17: Energy-related green- house gas emissions in 200 the innovation scenario (variant without CCS) in million tonnes of CO2 0 equivalents, 1990 – 2050 1990 2005 2020 2030 2040 2050 N20 Electricity generationgeneration Commercial, trade and services sectors CH4 Generation of district heating Private households Conversion sector, total Transport Other conversion Industry
  • 26.
    26 27 >> In 2050, energy-related greenhouse gas emissions (in the variant without CCS) total 96.6 million tonnes of carbon dioxide equivalents and are hence 91% lower than 1990. All sectors contribute to this development although admittedly to different degrees (since it is not possible to consistently compare emissions to 1990, the reduction rates are shown here in comparison to 2005). Private households account for the relatively highest contribution where emissions fall by 98% between 2005 and 2050. Heating demand for space heating will decline to practically zero. Due to the high share of space heating and high electricity share, the services sector can also reduce its direct emissions significantly (by approx. 85%). The transport and industry sectors also reduce their emissions significantly (industry: 64%, trans- port 83%), however, in 2050 they still emit greenhouse gases due to the use of fossil fuels to generate process heat (a reduction in the metallurgical sector too) as well as fossil fuels for aviation and shipping. Due to the high share of renewable energy in electricity generation, emissions here decline by 98% to 14 million tonnes in 2050. Emissions from the other conversion sector will fall to around 3 million tonnes primarily due to the decline in the generation of district heating as well as the strong reduc- tion in the production of mineral oil products. Other energy-related greenhouse gas emissions (N2O and CH4), primarily in conjunction with transport and the combustion of fossil fuels, decline between 2005 and 2050 by 81% to almost 2 million tonnes of carbon dioxide equivalents . 1.200 Source: Prognos 2009 1.000 Million tonnes of CO2 equivalents 800 600 400 200 Fig. K 18: 0 Energy-related greenhouse 1990 2005 2020 2030 2040 2050 gas emissions in the N20 Electricity generation Commercial, trade and services sectors innovation scenario (variant with CCS) in CH4 Generation of district heating Private households Conversion sector, total Transport million tonnes of CO2 equivalents, 1990 –2050 Other conversion Industry With the CCS option, energy-related greenhouse gas emissions are reduced between 1990 and 2050 by 88% to 106 million tonnes of carbon dioxide equivalents. Compared to the option without CCS, the structure of electricity generation changes. CO2 emissions by fossil power stations decline by 93%, however, they do not disappear all together. Around 23 million tonnes of carbon dioxide equivalents continue to be emitted by hard-coal and lignite power stations which are equipped with CCS technology.
  • 27.
    Other greenhouse gasemissions by other sectors In addition to combustion-related CO2, CH4 and N2O emissions, a host • Waste sector measures of other sectors contribute to overall greenhouse gas emissions. - Promotion of waste avoidance and recycling, as well as of eco- These emissions include: nomical material use for energy-intensive products. • volatile greenhouse gas emissions by the energy sector, - Promotion measures for energetic recycling, especially the expansion • CO2 emissions from industrial processes, of gasification and fermentation capacities to approx. two thirds of • CH4 emissions from industrial processes, organic waste. • N2O emissions from industrial processes, • Agricultural measures • emissions of fluorinated greenhouse gases, - Increase in the share of organically farmed in agricultural land up to • greenhouse gas emissions from waste management, 25% by 2030 at the latest. • greenhouse gas emissions from agriculture, - Initiation of a set of measures for fertiliser management comprising • CH4 emissions from agriculture, a duty on nitrogen surpluses in farming on a farm basis as well as • N2O emissions from agricultural soils, promotion measures for improved fertiliser management, and tar- • greenhouse gas emissions from LULUCF (land use, land use change geted research and information on climate friendly farming methods. and forestry). - Initiation of a set of measures for climate protection and health with regulatory restrictions to livestock numbers per area as well as All in all, a host of very heterogeneous, sector-specific measures result in a implementing an information and awareness campaign to reduce decline of these emissions in the innovation scenario between 2005 and meat consumption. 2050 from 188 million tonnes to 60 million tonnes of CO2 equivalents. - Regulatory rules for the gas-tight storage of slurry and promotion This corresponds to a reduction of 68% compared to 2005 and of 67% measures to boost the energetic recycling of slurry and of harvest compared to 1990. residues in biogas plants. • Measures in land use In order to achieve the “Blueprint Germany” in the non-energy sectors, - Promotion of measures in forestry that are geared towards sustainable the following strategic safeguards must be put in place: forestry and that maintain and/or boost the sink effect of Germany’s • Greenhouse gas emissions from agriculture should be reduced forests (integration of CO2 into forest biomass). between 2005 and 2030 by 30% and by 40% by the year 2050. - Regulatory restriction of land use to convert non-sealed land into • With a view to emissions from land use, land use change and for- residential, transport and settlement areas. estry, the release of CO2 should be reduced by 70% between 2005 - Initiation of a set of measures for land transformation comprising and 2050. promotion measures for the renaturation of peat land and drained grasslands, regulatory establishment of alternative use and the imple- The same applies to the set of instruments. mentation of the goals of the Federal government’s biodiversity strategy. The most important sector-specific instruments are listed below: - Stricter regulations for land protection as a precondition for payments • Instruments in industry: within the scope of a new EU agricultural policy. - Fully binding introduction of CCS for process-related emissions in the steel, cement and lime sectors unless such a measure has already been implemented through the CO2 price signal of emissions trading. - Initiation of a set of measures to reduce fluorinated GHGs; compris- ing regulatory requirements, such as a ban on the use of F-gases as refrigerants from 2015 onwards and a tax on the use of F-gases linked to the greenhouse gas potential.
  • 28.
    28 29 Key elements of an integrated climate protection and energy programme 2030 In addition to and to supplement the measures of the Federal government’s “Integrated Energy and Climate Programme” from 2008, an “Integrated climate protection and energy programme 2030” can be outlined that should be based on the following key elements (the sector-specific bundle has been described in the respective sector chapters): 1. Legal framework for a long-term climate protection policy • Binding establishment of long-term goals; • Monitoring methods and action plans based on strategic goals; • Sanction and adaptation measures for cases where targets are not reached. 2. General instruments • Further development of the EU emissions trading system with a cap that for 2020 is 35% below and for 2030 60% below the 2005 level and with a much stronger restriction of emission reductions made outside the sectors covered by the emissions trading system and which can be counted as proof of commitment; • Introduction of a CO2 tax for stationary use for energy sources that are not covered by the EU emissions trading system. 3. General instruments to boost energy efficiency • Creation of a flexible quantity control system for energy savings with which energy suppliers, using a positive list for energy-saving projects (with defined baseline methods, etc.), must furnish proof each year in the form of freely tradable saving certificates of a certain energy saving amount which is based on the percentage of the energy supplier’s sales (rising by one percentage point each year after 2010); • Re-introduction of the deduction from taxation of investments in energy efficiency. 4. Innovation and infrastructure-specific measures • Revision and expansion of the German biomass strategy which contains long-term prioritisation and concrete steps in the field of biofuels (including the specification of aviation fuels based on biomass), biomethane supplies and the generation of electricity from biomass. • Innovation programme for biofuels of the second generation, with a target of having only this biofuel quality on the market by 2020. • Innovation and market launch programme for electric cars, including efficiency-dependent bonuses. • Innovation programme to develop and promote smart distribution grids with intelligent load management options. • Fastest possible implementation of CCS pilot and demonstration projects and, if applicable, the drawing up of a “German CCS development plan” to define the solution contributions by CCS under different boundary conditions, the infrastructure required, underground regional planning to manage competition for underground use and use prioritisation. • Preparation of a “German energy infrastructure conversion programme”; this can be used as a basis for investment incentives and obligations for the transmission grids as well as for the expansion of the CO2 infrastructure, implementation within the framework of Deutsches Netz AG. • Improved promotion of research with milestones in the field of energy efficiency improvements through further development and the application of new key technologies, e.g. for processes and materials. Targeted market launch of initiatives to optimise these technologies and to achieve their widespread implementation.
  • 29.
    Conclusions and outlook:changes in energy and climate policy, innovation and global frameworks With a continuation – no matter how ambitious – of today’s energy and climate policy, i.e. a continuation of the technologies commonly used today as well as today’s consumption patterns for energy and resources, it will not be at all possible to reach the reduction target of 95% for total greenhouse gas emissions by the middle of the century (compared to the 1990 baseline). The con- tinuation of today’s ambitious level in energy and climate policy assumed in the reference scenario can at best be expected to achieve about 45% reduction of greenhouse gas emissions in the period from 1990 to 2050. An emissions reduction path that is consistent with international efforts to restrict mean global tem- perature rise to a value below 2°C compared to pre-industrial levels must set new courses at an early point in time. An analysis of the innovation scenario and the additional analyses highlight the following challenges for the changes necessary by the year 2050: • Considerable efforts must be made immediately to significantly boost energy efficiency. If energy productivity is not increased by at least 2.6% annually, it is extremely unlikely that this climate protection target will be reached. • In all sectors, the remaining energy demand must be almost fully covered by renewable energy, the use of CCS is unavoidable for the greater share of any emissions that remain from fossil fuels and industrial processes. • A large part of the changes necessary involve plants and infrastructures with a long service life, long lead times or complex conversion processes. Political strategies and measures will have to be continuously examined with a view to their compatibility with the required long-term developments. • Especially emission reductions in the mid-term and long-term perspective call for extensive innovations that are specifically initiated and that must be quickly launched on the market. • In addition to measures in the field of energy-related greenhouse gas emissions, significant emission reductions in the field of non-energy related emissions are also unavoidable. Greater reductions in emissions from industrial processes, agriculture and land use play a central role. Even though there are no alternatives to the efforts to reduce the entire range of greenhouse gas emissions, it is highly unlikely that the 95% target for the year 2050 will be reached if the following new courses are not set: • A significant decline and stabilisation of electricity demand to a level that is 25% below today’s values in 2030 and 35% in 2050. This also applies in the case of a large-scale launch of electric drivetrains in the transport sector. • An expansion of electricity using renewable energy sources to 95% (employing more than 50% of CCS power stations). • The refurbishment of existing buildings up to a space heating demand of (practically) zero and the early introduction of zero-energy standards for new buildings. • Considerable modal shifts in transport, which, for instance, require a doubling of rail freight transport capacities and a huge expansion of public passenger transport. • Improved efficiency of the vehicle fleet by an average of 60% and improved efficiency of road freight transport by more than 30%. • Extensive shift in motorised individual transport to electric drivetrains with sustainably generated biofuels covering the remaining fuel demand in passenger, freight and air transport. • Avoidance of process-related CO2 emissions by the iron and steel industry and in cement production through significant material savings and/or substitution and the use of CCS in industry. • Sustainably generated biomethane to cover the remaining demand for process heat in industry. • Enormous emission reductions in agriculture and in land use.
  • 30.
    30 31 >> In addition to a host of technical innovations, changes in production and consumption patterns will have to be made across the entire board along with huge structural change. Moreover, the changes will not be possible unless a persistently systematic view of the necessary changes is developed: • The diverse changes at the energy demand and supply sides call for extensive reshaping of the infrastructure for electricity, gas and CO2 as well as systematic and long-term approaches to system integration and market integration of climate-friendly technologies, especially in the field of fluctuating supplies of electricity from renewable energy sources. • The enormous reductions in emissions call for a strategic re-evaluation of the use of scarce resources for a series of important climate protection options. The use of biomass must not only be examined in view of the quantities available in Europe and the demand for the most efficient use possible, but also with a view to the areas where no alternative to biomass exists in the long-term. Limited CO2 storage reservoirs mean that priority must be given to the use of CCS and correspond- ing management of storage reservoirs. • The strategies needed to provide sustainably generated biomass will have to include the drafting and implementation (with a considerable lead time) of strict sustainability standards. The additional costs of a huge reduction in emissions for the strategies pursued in the innovation scenario appear to be reasonable on the investment side, totalling a max. of 0.6% of GDP. The burdens, however, are distributed unevenly (e.g. high, non- amortisable investments in the field of buildings). Suitable instruments will be needed here to allocate and distribute additional costs. Many more ambitious instruments will hence be needed than those discussed up to now in energy and climate policy; these instruments will have to be embedded in long-term, calculable targets and political strategies and will require widespread social consensus for the strategic goals and a balanced distribution of burdens. This consensus must also include the exploitation of the poten- tial offered by renewable energy and/or the storage options for CO2, in particular, as well as the need for changed mobility and consumption patterns. Apart from the technical/economic potential to reduce emissions and the political instruments re- quired to implement this, it will also be extremely important to find supportive acceptance in society for the restructuring process required. This calls for a broad, social discussion process. It will be a high priority task of politics to initiate and accompany this process with other social groups. The implementation of emission reductions across the board calls for new political frameworks in addition to a host of new actors. An energy and climate policy that is geared towards ambitious - climate protection goals will have to aim for a diverse range of actors and a high degree of compe- tition and will prevent the formation of market structures that hinder innovation. The strategic goals along with the required development of technologies, infrastructures and busi- ness models call for integration into an international context which avoids one-sided burdens for industries competing on a global level and leakage effects. This integration should include compara- ble (ambitious) commitments by all industrial nations and today’s newly industrialised countries, tech- nology transfer as well as international balancing mechanisms. In order to save time and in the inter- est of cost efficiency, technology development should be internationally co-ordinated and based on co-operative work sharing. Irrespective of the apparent nature and necessity of the European and international integration of many implementation measures for an emissions reduction path based on the “Blueprint Germany”, this does not alter the fact that a country like Germany should develop a sound, national strategy for a long-term reduction in emissions along the lines of the 95% reduction target. Such a strategy is needed to test the consistency of all political measures. The strategies and measures outlined in this study could form a reliable basis for a national policy development process that is strictly orientated towards innovation, climate protection and a pioneering role.
  • 31.
    Table of abbreviations, acronyms and symbols GDP Gross domestic product CCS Carbon Capture and Storage CH4 Methane CO2 Carbon dioxide EU European Union EUR Euro g Gram IPCC Intergovernmental Panel on Climate Change J Joule (physical unit for work) km Kilometre kWh Kilowatt hour l Litre LED Light Emitting Diode HGV Heavy goods vehicle m3 Cubic metre max. Maximum m Millions N2O Nitrogen oxide NOx Oxides of nitrogen O2 Oxygen OLED Organic Light Emitting Diode (LED based on organic materials, e.g. dyestuffs) PV Photovoltaics t tonne GHG Greenhouse gases cf. compare V Volt W Watt (physical unit for power) Prefix signs: Wh Watt hours Designation Factor Designation Factor Nano (n) 10-9 Mega (M) 106 Micro (μ) 10 -6 Giga (G) 109 Milli (m) 10-3 Tera (T) 1012 Kilo (k) 103 Peta (P) 1015 Energy units (conversion factors): from to J TJ kWh J 1 1x10-12 0.2778x10⁻⁶ TJ 1x10 12 1 0.2778x10⁶ kWh 3.6x10⁶ 3.6x10⁻⁶ 1 GWh 3.6x10 12 3.6 1x10⁶
  • 32.
    34 35 List of figures 4 Fig. K 1: Greenhouse gas emissions by sectors, 1990, 2005, and the target up to 2050, in million t of CO2 equivalents 5 Fig. K 2: Reference scenario: emission reductions broken down into sectors, 1990 – 2050, in million t of CO2 equivalents 6 Fig. K 3: Total greenhouse gas emissions 1990 – 2050 8 Fig. K 4: Contributors from different fields of action to the development of total greenhouse gas emissions 12 Fig. K 5: Framework development: gross domestic product in billion € and population in millions, 2005 – 2050 14 Fig. K 6: Final energy consumption by private households in the innovation scenario broken down according to energy sources and uses, in PJ, index of direct CO2 emissions, 2005 – 2050 16 Fig. K 7: Final energy consumption by the services sector in the innovation scenario, broken down according to types of use and energy sources, in PJ, index of direct CO2 emissions, 2005 – 2050 17 Fig. K 8: Final energy consumption by the industrial sector in the innovation scenario, broken down according to types of use and energy sources, in PJ, index of direct CO2 emissions,2005 – 2050 18 Fig. K 9: Final energy consumption by passenger and freight transport in the innovation scenario, broken down according to forms of transport, in PJ, 2005 – 2050 19 Fig. K 10: Final energy consumption by passenger and freight transport in the innovation scenario, broken down according to energy sources, in PJ, index of direct CO2 emissions, 2005 – 2050 20 Fig. K 11: Total final energy consumption in the innovation scenario, broken down according to energy sources and sectors, in PJ, index of direct CO2 emissions, 2005 – 2050 21 Fig. K 12: Net electricity generation by German power stations in the innovation scenario (variant without CCS), broken down according to energy sources in TWh, 2005 – 2050 21 Fig. K 13: Net electricity generation by German power stations in the innovation scenario (variant with CCS), broken down into energy sources, in PJ, in TWh, 2005 – 2050 23 Fig. K 14: Primary energy consumption (without non-energetic consumption) in the innovation scenario (variant without CCS), broken down according to energy sources and sectors, index of energy-related CO2 emissions, 2005 – 2050 24 Fig. K 15: Additional cost of the innovation scenario for the national economy vs. saved expenditure for imported fossil fuels, 2010 – 2050, in billion € (real, 2000) 24 Fig. K 16: Elements of additional costs in the innovation scenario in Mio. € (real, 2000) 25 Fig. K 17: Energy-related greenhouse gas emissions in the innovation scenario (variant with CCS) in million tonnes of CO2 equivalents, 1990 – 2050 26 Fig. K 18: Energy-related greenhouse gas emissions in the innovation scenario (variant with CCS) in million tonnes of CO2 equivalents, 1990 – 2050
  • 33.
    Prepared by Prognos/Öko-Institutand Dr. Hans-Joachim Ziesing for WWF Germany. Prognos AG Dr. Almut Kirchner (project manager) Dr. Michael Schlesinger Dr. Bernd Weinmann Peter Hofer Vincent Rits Marco Wünsch Marcus Koepp Lucas Kemper Ute Zweers Samuel Straßburg Redaktionsassistenz: Andrea Ley Dr. Felix Chr. Matthes (project manager) Julia Busche Verena Graichen Dr. Wiebke Zimmer Hauke Hermann Gerhard Penninger Lennart Mohr Dr. Hans-Joachim Ziesing impressum: WWF Germany, Frankfurt/ Main October 2009 Coordination: Regine Günther, Viviane Raddatz
  • 34.
    © Copyright WWFInternational ® Registered by WWF International • Printed on 100% recycling paper WWF Germany WWF is one of the world’s largest and most experienced indepen- Reinhardtstraße 14 dent conservation organizations, with almost 5 million supporters 10117 Berlin and a global network active in more than 100 countries. tel: +49 30 308742-0 fax: +49 30 308742-50 WWF’s mission is to stop the degradation of the planet’s natural info@wwf.de environment and to build a future in which humans live in harmony with nature, by: www. wwf • conserving the world’s biological diversity • ensuring that the use of renewable natural resources is sustainable • promoting the reduction of pollution and wasteful consumption. .de