SlideShare a Scribd company logo
1 of 9
Download to read offline
2005 Estimated GHG Emissions2
               Summary Mitigation
  Country                                    Detailed Mitigation action Submitted to the UNFCCC1
                    Action                                                                                                       % of World
                                                                                                             MtCO2e     Rank       Total
China         • Reduce emissions per        Endeavor to lower its carbon dioxide emissions per unit of
                 unit of GDP of 40-45%      GDP by 40-45% by 2020 compared to the 2005 level,
                 below 2005 levels by       increase the share of non-fossil fuels in primary energy
                 2020                       consumption to around 15% by 2020 and increase forest
              • Increase energy from        coverage by 40 million hectares and forest stock volume by
                 non-fossil fuels to        1.3 billion cubic meters by 2020 from the 2005 levels.
                 supply 15% of China's
                 primary energy                                                                               7,187       1         16.6%
                 consumption by 2020
              • Increase forest cover by
                 40 million hectares by
                 2020 and increase forest
                 stock volume 1.3 billion
                 cubic meters above
                 2005 levels by 2020.
USA          In the range of 17%, in        In the range of 17%, in conformity with anticipated U.S.
            conformity w/ energy &          energy and climate legislation, recognizing that the final
            climate legislation             target will be reported to the Secretariat in light of enacted
                                            legislation. The pathway set forth in pending legislation         6,814       2         15.8%
                                            would entail a 30% reduction in 2025 and a 42% reduction in
                                            2030, in line with the goal to reduce emissions 83% by 2050.
EU          20-30% economy-wide cut
                                            20/30% economy-wide cut below 1990 levels in 2020. As
            below 1990 levels in 2020
                                            part of a global and comprehensive agreement for the period
                                            beyond 2012, the EU reiterates its conditional offer to move
                                            to a 30% reduction by 2020 compared to 1990 levels,               5,049       3         11.7%
                                            provided that other developed countries commit themselves
                                            to comparable emission reductions and that developing
                                            countries contribute adequately according to their
                                            responsibilities and respective capabilities.
2005 Estimated GHG Emissions2

Brazil   36-39% reduction below         Anticipated that these actions will lead to an expected
         business as usual levels       reduction of 36.1-38.9% regarding the projected emissions of
         (reducing emissions to         Brazil by 2020.
         ~1994 levels)                    • Reduction of Amazon deforestation (range of estimated
           • 80% cut in deforestation       reduction: 564 MMTCO2e in 2020)
             rates from historic levels   • Reduction in “Cerrado” deforestation (range of estimated
             by 2020                        reduction: 104 MMTCO2e in 2020)
           • Increase alternative         • Restoration of grazing land (range of estimated
             energy sources, energy         reduction: 83-104 MMTCO2e in 2020)
             efficiency, improved         • No-till farming (range of estimated reduction: 16-20
             farming practices, and         MMTCO2e in 2020)
             other measures               • Biological N2 fixation (range of estimated reduction: 16-
                                                                                                        2,842       4         6.6%
                                            20 MMTCO2e in 2020)
                                          • Energy efficiency (range of estimated reduction: 12-15
                                            MMTCO2e in 2020)
                                          • Increase the use of biofuels (range of estimated
                                            reduction: 48-60 MMTCO2e in 2020)
                                          • Increase in energy supply by hydroelectric power plants
                                            (range of estimated reduction: 79-99 MMTCO2e in 2020)
                                          • Alternative energy sources (range of estimated reduction:
                                            26-33 MMTCO2e in 2020)
                                          • Iron & steel – replace coal from deforestation with coal
                                            from planted forests (range of estimated reduction: 8-10
                                            MMTCO2e in 2020)
2005 Estimated GHG Emissions2

Indonesia    26% emission reduction by      26% emission reduction by 2020 below business as usual
             2020 below BAU                 levels, achieved through the following actions:
                                              • Sustainable peat land management
                                              • Reduction in the rate of deforestation and land
                                                degradation
                                              • Development of carbon sequestration                          2,042       5         4.7%
                                              • Promotion of energy efficiency
                                              • Development of alternative and renewable energy
                                                sources
                                              • Reduction in solid and liquid waste
                                              • Shifting to low-emission transportation mode
Russian      15-25% economy-wide cut        15-25% economy-wide cut below 1990 levels in 2020
                                                                                                             2,005       6         4.6%
Federation   below 1990 levels in 2020
India        Reduce emissions per unit      India will endeavour to reduce the emissions intensity of its
             of GDP of 20-25% below         GDP by 20-25% by 2020 in comparison to the 2005 level.
             2005 levels by 2020            The emissions from agriculture sector will not form part of      1,866       7         4.3%
                                            the assessment of emissions intensity.
Japan        25% economy-wide cut           25% economy-wide reduction below 1990 levels in 2020,
             below 1990 levels in 2020      which is premised on the establishment of a fair and effective
             with a “fair and effective”    international framework in which all major economies             1,356       8         3.1%
             international framework        participate and on agreement by those economies on
                                            ambitious targets.
Canada       17% economy-wide cut
             below 2005 levels in 2020,
                                            17% economy-wide emissions cut compared to 2005 levels,          804         9         1.9%
             to be aligned with the final
                                            to be aligned with the final economy-wide emissions target of
             US legislation
                                            the United States in enacted legislation.
Mexico       Aims at reducing its GHG         • Achieve a reduction in total annual emissions of 51
             emissions up to 30% with           MMTCO2e by 2012.
             respect to the BAU scenario      • Aims at reducing its GHG emissions up to 30% with
                                                                                                             683        10         1.6%
             by 2020, provided the              respect to the BAU scenario by 2020, provided the
             provision of adequate              provision of adequate financial and technological
             financial and technological        support from developed countries as part of a global
2005 Estimated GHG Emissions2

               support.                          agreement.

Republic of    Cut national emissions 30%    To reduce national greenhouse gas emissions by 30% from
Korea          below BAU in 2020             the business-as-usual emissions by 2020 (~%4 below 2005         569        11         1.3%
                                             levels)
Australia      5-25% economy-wide cut        Australia will reduce its greenhouse gas emissions by 25% on
               below 2000 levels in 2020     2000 levels by 2020 if the world agrees to an ambitious
                                             global deal capable of stabilising levels of greenhouse gases
                                             in the atmosphere at 450 ppm CO2-eq or lower. Australia
                                             will unconditionally reduce our emissions by 5% below 2000
                                             levels by 2020, and by up to 15% by 2020 if there is a global   559        12         1.3%
                                             agreement which falls short of securing atmospheric
                                             stabilisation at 450 ppm CO2-eq and under which major
                                             developing economies commit to substantially restrain
                                             emissions and advanced economies take on commitments
                                             comparable to Australia's.
South Africa    34% cut below BAU by         34% deviation below the BAU emissions growth trajectory
               2020 and 42% below BAU        by 2020 and a 42% deviation below the BAU emissions             423        18         1.0%
               by 2025                       trajectory by 2025
Kazakhstan      15% economy-wide             15% economy-wide reduction in emission below 1992 levels
               reduction in emission below   in 2020                                                         206        29         0.5%
               1992 levels in 2020
Israel         20% reduction of GHG          Strive for target of 20% reduction of GHG emissions by 2020
               emissions by 2020 below       below BAU. Main actions for achieving reduction target
               BAU.                          include:                                                         82        52         0.2%
                                               • 10% renewable energy for electricity generation by 2020
                                               • 20% reduction of electricity consumption by 2020
2005 Estimated GHG Emissions2

New Zealand   10-20% economy-wide cut        New Zealand is prepared to take on a responsibility target for
              below 1990 levels in 2020,     greenhouse gas emissions reductions of between 10 per cent
              as a part of global            and 20 per cent below 1990 levels by 2020, if there is a
              agreement                      comprehensive global agreement. This means:
                                              • the global agreement sets the world on a pathway to limit
                                                 temperature rise to not more than 2° C;
                                              • developed countries make comparable efforts to those of
                                                 New Zealand;                                                    79        53         0.2%
                                              • advanced and major emitting developing countries take
                                                 action fully commensurate with their respective
                                                 capabilities;
                                              • there is an effective set of rules for land use, land-use
                                                 change and forestry (LULUCF); and
                                              • there is full recourse to a broad and efficient international
                                                 carbon market
Ethiopia      Listed a variety of national   Listed a variety of national actions, including:
              actions                         • Hydro, wind, geothermal, off-grid renewables, and
                                                 biofuels
                                              • Reforestation, reduced deforestation, and reduced forest         74        54         0.2%
                                                 degradation
                                              • Waste management
Morocco       Listed a variety of national   Listed a variety of national actions, including:
              actions                         • Install new renewable energy capacity: 300MW of
                                                 micro-hydro power by 2030; 40 MW of hydro by 2013;
                                                 2,000 MW of solar power between 2015-2020; and 5,000
                                                 MW wind power by 2030
                                              • Install 870 MW of combined cycle generation plants               61        61         0.1%
                                              • Promote improved energy efficiency through efficient
                                                 lighting and effiency labeling
                                              • Strengthen vehicle technical standards, modernize
                                                 vehicle fleets through subsidies, promote train and urban
                                                 transport systems
2005 Estimated GHG Emissions2

                                             • Develop wind energy and energy efficiency by industrial
                                               sector partners
                                             • Recovery of methane and other greenhouse gas emissions
                                             • Treatment of 80%-90% of waste water by 2020-2030
                                             • Improve agricultural yield
                                             • Reforest 1 million hectares by 2030
Norway       30-40% economy-wide cut        30-40% economy-wide cut below 1990 levels in 2020. As
             below 1990 levels in 2020      part of a global and comprehensive agreement for the period
                                            beyond 2012 where major emitting Parties agree on                  52        64         0.12%
                                            emissions reductions in line with the 2 degrees Celsius target,
                                            Norway will move to a level of 40% reduction for 2020.
Singapore    Reduction in GHG               Reduction of GHG emissions 16% below BAU levels in
             emissions by 16%, below        2020, contingent on a legally binding global agreement in
             BAU                            which all countries implement their commitments in good            48        65         0.11%
                                            faith.

Madagascar   Listed a variety of national   Listed a variety of national actions, including:
             actions                         • Developing renewable energy including hydropower,
                                                solar, wind, and biomass
                                             • Improving and reducing fuel wood use and increasing use
                                                of efficient lighting                                          31        75         0.07%
                                             • Implementing reforestation, restoration and biodiversity
                                                protection activities
                                             • Increasing use of biofuels and sustainable transport.
Croatia      5% economy-wide cut            Cut economy-wide emissions to 5% below 1990 levels.
             below 1990 levels in 2020      Temporary target for Croatia. Upon the accession of Croatia
                                            to the European Union, the Croatian target shall be replaced       31        77         0.07%
                                            by arrangement in line with and part of the European Union
                                            mitigation effort.
2005 Estimated GHG Emissions2

Mongolia      Listed a variety of national   Listed a variety of national actions, including:
              actions                         • Increasing PV, solar, and wind utilization                     30        78         0.07%
                                              • Improving energy efficiency
Jordan        Listed a variety of national   Listed a variety of national actions, including:
              actions                         • Railway, light rail, and freight modernization
                                              • Removed customs and taxes on energy saving
                                                 technologies
                                              • Energy efficiency programs                                     23        84         0.05%
                                              • Adoption of renewable energy law
                                              • Solid waste management
                                              • Improved farming practices
Republic of   Listed a variety of national   Listed a variety of national actions, including:
Congo         actions                         • Increasing energy efficiency, boosting hydroelectric
                                                 potential and improving electric distribution
                                                 infrastructure
                                              • Developing REDD activities, sustainable forestry
                                                 management, forest certification and cogeneration from        17        95         0.04%
                                                 value added forest concessions.
                                              • Developing municipal waste management plans.
                                              • Adopting agricultural production better suited to climate
                                                 variability and increasing use of nitrogen fixing species.
Moldova       Listed a variety of national   A reduction of no less than 25% of the base year (1990) level
              actions                        total national GHG emissions have to be achieved by 2020
                                             year through implementation of global economical                  13        99         0.03%
                                             mechanisms focused on the climate change mitigation, in
                                             accordance with the Convention's principles and provisions.
2005 Estimated GHG Emissions2

Macedonia       Listed a variety of national   Listed a variety of national actions, including:
               actions                          • Increasing the share of renewables in the energy sector
                                                • Improvement of energy efficiency                              11        104        0.03%
                                                • Industrial energy transformation
                                                • Improvements of public and urban transport
Costa Rica     Carbon neutral by 2021          Long term economy-wide transformational effort to enable
               (with int’l assistance)         carbon-neutrality that will help the country to significantly
                                               deviate from business as usual GHG emissions projected           10        108        0.02%
                                               scenarios from now on up to 2021 and beyond

Armenia        Listed a variety of national    Listed a variety of national actions, including:
               actions                          • Increasing renwable energy use
                                                                                                                7.4       115        0.02%
                                                • Improving energy efficiency
                                                • Expansion of electrical transport
Togo                                           Listed a variety of national actions, including:
                                                • Increase forest cover from 7% of land surface in 2005 to
                                                   30% by 2050
                                                • Boost urban and rural energy efficiency
                                                                                                                6         119        0.01%
                                                • Improve use of traditional energy sources like biomass
                                                   and carbon
                                                • Promote solar, wind, biogas and biofuel energy

Sierra Leone   Listed a variety of national    Listed a variety of national actions, including:
               actions                          • Establishment of protected area reserves and improve
                                                                                                                4         125        0.01%
                                                   forest governance
                                                • Expanding clean energy utilization
Maldives       Achieve carbon neutrality       Achieve carbon neutrality as a country by 2020
                                                                                                                0.7       140       >0.01%
               by 2020
Marshall       40% CO2 reduction from          40% reduction of CO2 emissions below 2009 levels by 2020,
Islands        2009 levels by 2020, subject    pursuant to the 2009 National Energy Policy and Energy
               to assistance                   Action Plan, and with subject to the provision of adequate       n/a       n/a         n/a
                                               international support
2005 Estimated GHG Emissions2

Bhutan          Remain carbon neutral           Ensure that emissions don’t exceed their sequestration
                                                capacity.                                                              n/a          n/a            n/a

(1) Click on the blue hyperlink for the official country letter. All country submissions of actions are available at: http://unfccc.int/home/items/5265.php
(2) Source: World Resources Institute, Climate Analysis Indicator Tool (CAIT), available at: http://cait.wri.org/. All values are from 2005 emissions
data. Values include all six greenhouse gases and emissions and sequestration from land-use, land-use change, and forestry.

More Related Content

What's hot

Mike Ahearne Biofuels For Transport And Chp
Mike Ahearne Biofuels For Transport And ChpMike Ahearne Biofuels For Transport And Chp
Mike Ahearne Biofuels For Transport And ChpSonia Large
 
Introduction CRIF_Senior Officer Event 12th October
Introduction CRIF_Senior Officer Event 12th OctoberIntroduction CRIF_Senior Officer Event 12th October
Introduction CRIF_Senior Officer Event 12th Octobercrifcambs
 
EPIC - Where Are We In Climate Action?
EPIC - Where Are We In Climate Action?EPIC - Where Are We In Climate Action?
EPIC - Where Are We In Climate Action?CleanEarth4Kids
 
Comparison of best biofuels technologies (including synthetic biology) for wh...
Comparison of best biofuels technologies (including synthetic biology) for wh...Comparison of best biofuels technologies (including synthetic biology) for wh...
Comparison of best biofuels technologies (including synthetic biology) for wh...PwC
 
The future of lignocellulose processing
The future of lignocellulose processingThe future of lignocellulose processing
The future of lignocellulose processingNNFCC
 
Opportunity and Risk of REDD+, Green Economy, and Sustainable Development
Opportunity and Risk of REDD+, Green Economy, and Sustainable DevelopmentOpportunity and Risk of REDD+, Green Economy, and Sustainable Development
Opportunity and Risk of REDD+, Green Economy, and Sustainable DevelopmenttheREDDdesk
 
Doe 2013 Eere Congressional Budget Request
Doe 2013 Eere Congressional Budget RequestDoe 2013 Eere Congressional Budget Request
Doe 2013 Eere Congressional Budget RequestLarry Stapleton
 
Market Research Finland - Biofuels Market in Finland 2009
Market Research Finland - Biofuels Market in Finland 2009Market Research Finland - Biofuels Market in Finland 2009
Market Research Finland - Biofuels Market in Finland 2009Netscribes, Inc.
 
NNFCC market review biofuels issue seven october 2012
NNFCC market review biofuels issue seven october 2012NNFCC market review biofuels issue seven october 2012
NNFCC market review biofuels issue seven october 2012NNFCC
 
NextGen of Cleantech Investing: Policy and Scaling
NextGen of Cleantech Investing:  Policy and ScalingNextGen of Cleantech Investing:  Policy and Scaling
NextGen of Cleantech Investing: Policy and ScalingJohnBalbach
 
Annual Energy Outlook 2011
Annual Energy Outlook 2011Annual Energy Outlook 2011
Annual Energy Outlook 2011Chris Hunter
 
29 05-09 dalj necak croatia presentation
29 05-09 dalj necak croatia presentation29 05-09 dalj necak croatia presentation
29 05-09 dalj necak croatia presentationdoxikus
 
010-011_Biofuels-Fundamental Research and Industrial Application
010-011_Biofuels-Fundamental Research and Industrial Application010-011_Biofuels-Fundamental Research and Industrial Application
010-011_Biofuels-Fundamental Research and Industrial Applicationsenicsummerschool
 
No to BNPP Revival Power Issues
No to BNPP Revival Power IssuesNo to BNPP Revival Power Issues
No to BNPP Revival Power Issuesgtapang
 
Bio Jet Update Unclassified 3 12
Bio Jet Update Unclassified 3 12Bio Jet Update Unclassified 3 12
Bio Jet Update Unclassified 3 12drewn15
 

What's hot (20)

Mike Ahearne Biofuels For Transport And Chp
Mike Ahearne Biofuels For Transport And ChpMike Ahearne Biofuels For Transport And Chp
Mike Ahearne Biofuels For Transport And Chp
 
Introduction CRIF_Senior Officer Event 12th October
Introduction CRIF_Senior Officer Event 12th OctoberIntroduction CRIF_Senior Officer Event 12th October
Introduction CRIF_Senior Officer Event 12th October
 
EPIC - Where Are We In Climate Action?
EPIC - Where Are We In Climate Action?EPIC - Where Are We In Climate Action?
EPIC - Where Are We In Climate Action?
 
Comparison of best biofuels technologies (including synthetic biology) for wh...
Comparison of best biofuels technologies (including synthetic biology) for wh...Comparison of best biofuels technologies (including synthetic biology) for wh...
Comparison of best biofuels technologies (including synthetic biology) for wh...
 
The future of lignocellulose processing
The future of lignocellulose processingThe future of lignocellulose processing
The future of lignocellulose processing
 
Socio-economics Aspects Biofuels Production: What are the concerns in Europe?
Socio-economics Aspects Biofuels Production: What are the concerns in Europe?Socio-economics Aspects Biofuels Production: What are the concerns in Europe?
Socio-economics Aspects Biofuels Production: What are the concerns in Europe?
 
C riley 2005
C riley 2005C riley 2005
C riley 2005
 
EERA_Paper_2007
EERA_Paper_2007EERA_Paper_2007
EERA_Paper_2007
 
CA Waste Conversion Technologies Guide
CA Waste Conversion Technologies GuideCA Waste Conversion Technologies Guide
CA Waste Conversion Technologies Guide
 
Opportunity and Risk of REDD+, Green Economy, and Sustainable Development
Opportunity and Risk of REDD+, Green Economy, and Sustainable DevelopmentOpportunity and Risk of REDD+, Green Economy, and Sustainable Development
Opportunity and Risk of REDD+, Green Economy, and Sustainable Development
 
Doe 2013 Eere Congressional Budget Request
Doe 2013 Eere Congressional Budget RequestDoe 2013 Eere Congressional Budget Request
Doe 2013 Eere Congressional Budget Request
 
Market Research Finland - Biofuels Market in Finland 2009
Market Research Finland - Biofuels Market in Finland 2009Market Research Finland - Biofuels Market in Finland 2009
Market Research Finland - Biofuels Market in Finland 2009
 
NNFCC market review biofuels issue seven october 2012
NNFCC market review biofuels issue seven october 2012NNFCC market review biofuels issue seven october 2012
NNFCC market review biofuels issue seven october 2012
 
NextGen of Cleantech Investing: Policy and Scaling
NextGen of Cleantech Investing:  Policy and ScalingNextGen of Cleantech Investing:  Policy and Scaling
NextGen of Cleantech Investing: Policy and Scaling
 
Skanska Green
Skanska GreenSkanska Green
Skanska Green
 
Annual Energy Outlook 2011
Annual Energy Outlook 2011Annual Energy Outlook 2011
Annual Energy Outlook 2011
 
29 05-09 dalj necak croatia presentation
29 05-09 dalj necak croatia presentation29 05-09 dalj necak croatia presentation
29 05-09 dalj necak croatia presentation
 
010-011_Biofuels-Fundamental Research and Industrial Application
010-011_Biofuels-Fundamental Research and Industrial Application010-011_Biofuels-Fundamental Research and Industrial Application
010-011_Biofuels-Fundamental Research and Industrial Application
 
No to BNPP Revival Power Issues
No to BNPP Revival Power IssuesNo to BNPP Revival Power Issues
No to BNPP Revival Power Issues
 
Bio Jet Update Unclassified 3 12
Bio Jet Update Unclassified 3 12Bio Jet Update Unclassified 3 12
Bio Jet Update Unclassified 3 12
 

Viewers also liked

10 Insightful Quotes On Designing A Better Customer Experience
10 Insightful Quotes On Designing A Better Customer Experience10 Insightful Quotes On Designing A Better Customer Experience
10 Insightful Quotes On Designing A Better Customer ExperienceYuan Wang
 
How to Build a Dynamic Social Media Plan
How to Build a Dynamic Social Media PlanHow to Build a Dynamic Social Media Plan
How to Build a Dynamic Social Media PlanPost Planner
 
Learn BEM: CSS Naming Convention
Learn BEM: CSS Naming ConventionLearn BEM: CSS Naming Convention
Learn BEM: CSS Naming ConventionIn a Rocket
 
SEO: Getting Personal
SEO: Getting PersonalSEO: Getting Personal
SEO: Getting PersonalKirsty Hulse
 
Understanding Copenhagen Accord
Understanding Copenhagen AccordUnderstanding Copenhagen Accord
Understanding Copenhagen AccordYangki Imade Suara
 
Copenhagen presentation 3
Copenhagen presentation 3Copenhagen presentation 3
Copenhagen presentation 3ce4710
 
Prototyping is an attitude
Prototyping is an attitudePrototyping is an attitude
Prototyping is an attitudeWith Company
 

Viewers also liked (8)

10 Insightful Quotes On Designing A Better Customer Experience
10 Insightful Quotes On Designing A Better Customer Experience10 Insightful Quotes On Designing A Better Customer Experience
10 Insightful Quotes On Designing A Better Customer Experience
 
How to Build a Dynamic Social Media Plan
How to Build a Dynamic Social Media PlanHow to Build a Dynamic Social Media Plan
How to Build a Dynamic Social Media Plan
 
Learn BEM: CSS Naming Convention
Learn BEM: CSS Naming ConventionLearn BEM: CSS Naming Convention
Learn BEM: CSS Naming Convention
 
SEO: Getting Personal
SEO: Getting PersonalSEO: Getting Personal
SEO: Getting Personal
 
Understanding Copenhagen Accord
Understanding Copenhagen AccordUnderstanding Copenhagen Accord
Understanding Copenhagen Accord
 
Report on Copenhagen COP15
Report on Copenhagen COP15Report on Copenhagen COP15
Report on Copenhagen COP15
 
Copenhagen presentation 3
Copenhagen presentation 3Copenhagen presentation 3
Copenhagen presentation 3
 
Prototyping is an attitude
Prototyping is an attitudePrototyping is an attitude
Prototyping is an attitude
 

Similar to Detailed Copenhagen Accord Commitments

Proposal for a New Climate Target
Proposal for a New Climate TargetProposal for a New Climate Target
Proposal for a New Climate TargetNaoyuki Yamagishi
 
Cb Low Carbon Sa Media Aug 09
Cb   Low Carbon Sa Media Aug 09Cb   Low Carbon Sa Media Aug 09
Cb Low Carbon Sa Media Aug 09equitywatch
 
Main findings Working Group 3: Mitigation of Climate Change
Main findings Working Group 3: Mitigation of Climate ChangeMain findings Working Group 3: Mitigation of Climate Change
Main findings Working Group 3: Mitigation of Climate ChangeAndy Dabydeen
 
How can agriculture help achieve the 2°C target?
How can agriculture help achieve the 2°C target? How can agriculture help achieve the 2°C target?
How can agriculture help achieve the 2°C target? CIFOR-ICRAF
 
Indc 2015 of_bangladesh
Indc 2015 of_bangladeshIndc 2015 of_bangladesh
Indc 2015 of_bangladeshdpm gumti
 
Deep decarbonisation of Ireland's energy system
Deep decarbonisation of Ireland's energy systemDeep decarbonisation of Ireland's energy system
Deep decarbonisation of Ireland's energy systemIEA-ETSAP
 
CCXG Oct 2019 Overview of Renewable Energy Brazil - Luis Fernando Badanhan
CCXG Oct 2019 Overview of Renewable Energy Brazil - Luis Fernando BadanhanCCXG Oct 2019 Overview of Renewable Energy Brazil - Luis Fernando Badanhan
CCXG Oct 2019 Overview of Renewable Energy Brazil - Luis Fernando BadanhanOECD Environment
 
WRI15_BRO_Country-Action-v8
WRI15_BRO_Country-Action-v8WRI15_BRO_Country-Action-v8
WRI15_BRO_Country-Action-v8Hanasis
 
Web Mesh Agrobiodiversity Climate Water And Poverty Solutions 01 09
Web Mesh Agrobiodiversity Climate Water And Poverty Solutions 01 09Web Mesh Agrobiodiversity Climate Water And Poverty Solutions 01 09
Web Mesh Agrobiodiversity Climate Water And Poverty Solutions 01 09Michael P Totten
 
png_presentation_irpa_meeting_11_march_2010_paris
png_presentation_irpa_meeting_11_march_2010_parispng_presentation_irpa_meeting_11_march_2010_paris
png_presentation_irpa_meeting_11_march_2010_paristheREDDdesk
 
Carlo carraro - Cities and the 1.5° Mitigation Challenge
Carlo carraro - Cities and the 1.5° Mitigation ChallengeCarlo carraro - Cities and the 1.5° Mitigation Challenge
Carlo carraro - Cities and the 1.5° Mitigation ChallengeEIT Climate-KIC
 
7th Strategic Dialogue of the CMP - Rajinder Sahota, CARB
7th Strategic Dialogue of the CMP - Rajinder Sahota, CARB7th Strategic Dialogue of the CMP - Rajinder Sahota, CARB
7th Strategic Dialogue of the CMP - Rajinder Sahota, CARBOECD Environment
 
Climate for Life Presentation California Academy of Sciences
Climate for Life Presentation California Academy of SciencesClimate for Life Presentation California Academy of Sciences
Climate for Life Presentation California Academy of SciencesMichael P Totten
 
Climate focal point and the montreal protocol
Climate focal point and the montreal protocolClimate focal point and the montreal protocol
Climate focal point and the montreal protocolUNEP OzonAction
 
2015-08-18 GR Academy Kyoto Protocol
2015-08-18 GR Academy Kyoto Protocol2015-08-18 GR Academy Kyoto Protocol
2015-08-18 GR Academy Kyoto ProtocolESGQ Rating Agency
 

Similar to Detailed Copenhagen Accord Commitments (20)

Proposal for a New Climate Target
Proposal for a New Climate TargetProposal for a New Climate Target
Proposal for a New Climate Target
 
UNEP Emissions Gap Report
UNEP Emissions Gap Report UNEP Emissions Gap Report
UNEP Emissions Gap Report
 
Cb Low Carbon Sa Media Aug 09
Cb   Low Carbon Sa Media Aug 09Cb   Low Carbon Sa Media Aug 09
Cb Low Carbon Sa Media Aug 09
 
Main findings Working Group 3: Mitigation of Climate Change
Main findings Working Group 3: Mitigation of Climate ChangeMain findings Working Group 3: Mitigation of Climate Change
Main findings Working Group 3: Mitigation of Climate Change
 
How can agriculture help achieve the 2°C target?
How can agriculture help achieve the 2°C target? How can agriculture help achieve the 2°C target?
How can agriculture help achieve the 2°C target?
 
Lessons Learnt From Unilateral Process of Reducing Emissions From Land-based ...
Lessons Learnt From Unilateral Process of Reducing Emissions From Land-based ...Lessons Learnt From Unilateral Process of Reducing Emissions From Land-based ...
Lessons Learnt From Unilateral Process of Reducing Emissions From Land-based ...
 
Indc 2015 of_bangladesh
Indc 2015 of_bangladeshIndc 2015 of_bangladesh
Indc 2015 of_bangladesh
 
Deep decarbonisation of Ireland's energy system
Deep decarbonisation of Ireland's energy systemDeep decarbonisation of Ireland's energy system
Deep decarbonisation of Ireland's energy system
 
CCXG Oct 2019 Overview of Renewable Energy Brazil - Luis Fernando Badanhan
CCXG Oct 2019 Overview of Renewable Energy Brazil - Luis Fernando BadanhanCCXG Oct 2019 Overview of Renewable Energy Brazil - Luis Fernando Badanhan
CCXG Oct 2019 Overview of Renewable Energy Brazil - Luis Fernando Badanhan
 
National transition pathways - theoretical framework
National transition pathways - theoretical frameworkNational transition pathways - theoretical framework
National transition pathways - theoretical framework
 
EPA: Greenhouse Gas Emissions and the Transport Sector - Laura Burke
EPA: Greenhouse Gas Emissions and the Transport Sector - Laura BurkeEPA: Greenhouse Gas Emissions and the Transport Sector - Laura Burke
EPA: Greenhouse Gas Emissions and the Transport Sector - Laura Burke
 
WRI15_BRO_Country-Action-v8
WRI15_BRO_Country-Action-v8WRI15_BRO_Country-Action-v8
WRI15_BRO_Country-Action-v8
 
Web Mesh Agrobiodiversity Climate Water And Poverty Solutions 01 09
Web Mesh Agrobiodiversity Climate Water And Poverty Solutions 01 09Web Mesh Agrobiodiversity Climate Water And Poverty Solutions 01 09
Web Mesh Agrobiodiversity Climate Water And Poverty Solutions 01 09
 
png_presentation_irpa_meeting_11_march_2010_paris
png_presentation_irpa_meeting_11_march_2010_parispng_presentation_irpa_meeting_11_march_2010_paris
png_presentation_irpa_meeting_11_march_2010_paris
 
Carlo carraro - Cities and the 1.5° Mitigation Challenge
Carlo carraro - Cities and the 1.5° Mitigation ChallengeCarlo carraro - Cities and the 1.5° Mitigation Challenge
Carlo carraro - Cities and the 1.5° Mitigation Challenge
 
7th Strategic Dialogue of the CMP - Rajinder Sahota, CARB
7th Strategic Dialogue of the CMP - Rajinder Sahota, CARB7th Strategic Dialogue of the CMP - Rajinder Sahota, CARB
7th Strategic Dialogue of the CMP - Rajinder Sahota, CARB
 
Climate for Life Presentation California Academy of Sciences
Climate for Life Presentation California Academy of SciencesClimate for Life Presentation California Academy of Sciences
Climate for Life Presentation California Academy of Sciences
 
Climate focal point and the montreal protocol
Climate focal point and the montreal protocolClimate focal point and the montreal protocol
Climate focal point and the montreal protocol
 
IEA-Energy Technology Model
IEA-Energy Technology ModelIEA-Energy Technology Model
IEA-Energy Technology Model
 
2015-08-18 GR Academy Kyoto Protocol
2015-08-18 GR Academy Kyoto Protocol2015-08-18 GR Academy Kyoto Protocol
2015-08-18 GR Academy Kyoto Protocol
 

Detailed Copenhagen Accord Commitments

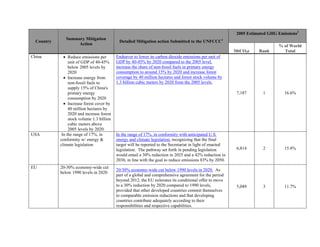
  • 1. 2005 Estimated GHG Emissions2 Summary Mitigation Country Detailed Mitigation action Submitted to the UNFCCC1 Action % of World MtCO2e Rank Total China • Reduce emissions per Endeavor to lower its carbon dioxide emissions per unit of unit of GDP of 40-45% GDP by 40-45% by 2020 compared to the 2005 level, below 2005 levels by increase the share of non-fossil fuels in primary energy 2020 consumption to around 15% by 2020 and increase forest • Increase energy from coverage by 40 million hectares and forest stock volume by non-fossil fuels to 1.3 billion cubic meters by 2020 from the 2005 levels. supply 15% of China's primary energy 7,187 1 16.6% consumption by 2020 • Increase forest cover by 40 million hectares by 2020 and increase forest stock volume 1.3 billion cubic meters above 2005 levels by 2020. USA In the range of 17%, in In the range of 17%, in conformity with anticipated U.S. conformity w/ energy & energy and climate legislation, recognizing that the final climate legislation target will be reported to the Secretariat in light of enacted legislation. The pathway set forth in pending legislation 6,814 2 15.8% would entail a 30% reduction in 2025 and a 42% reduction in 2030, in line with the goal to reduce emissions 83% by 2050. EU 20-30% economy-wide cut 20/30% economy-wide cut below 1990 levels in 2020. As below 1990 levels in 2020 part of a global and comprehensive agreement for the period beyond 2012, the EU reiterates its conditional offer to move to a 30% reduction by 2020 compared to 1990 levels, 5,049 3 11.7% provided that other developed countries commit themselves to comparable emission reductions and that developing countries contribute adequately according to their responsibilities and respective capabilities.
  • 2. 2005 Estimated GHG Emissions2 Brazil 36-39% reduction below Anticipated that these actions will lead to an expected business as usual levels reduction of 36.1-38.9% regarding the projected emissions of (reducing emissions to Brazil by 2020. ~1994 levels) • Reduction of Amazon deforestation (range of estimated • 80% cut in deforestation reduction: 564 MMTCO2e in 2020) rates from historic levels • Reduction in “Cerrado” deforestation (range of estimated by 2020 reduction: 104 MMTCO2e in 2020) • Increase alternative • Restoration of grazing land (range of estimated energy sources, energy reduction: 83-104 MMTCO2e in 2020) efficiency, improved • No-till farming (range of estimated reduction: 16-20 farming practices, and MMTCO2e in 2020) other measures • Biological N2 fixation (range of estimated reduction: 16- 2,842 4 6.6% 20 MMTCO2e in 2020) • Energy efficiency (range of estimated reduction: 12-15 MMTCO2e in 2020) • Increase the use of biofuels (range of estimated reduction: 48-60 MMTCO2e in 2020) • Increase in energy supply by hydroelectric power plants (range of estimated reduction: 79-99 MMTCO2e in 2020) • Alternative energy sources (range of estimated reduction: 26-33 MMTCO2e in 2020) • Iron & steel – replace coal from deforestation with coal from planted forests (range of estimated reduction: 8-10 MMTCO2e in 2020)
  • 3. 2005 Estimated GHG Emissions2 Indonesia 26% emission reduction by 26% emission reduction by 2020 below business as usual 2020 below BAU levels, achieved through the following actions: • Sustainable peat land management • Reduction in the rate of deforestation and land degradation • Development of carbon sequestration 2,042 5 4.7% • Promotion of energy efficiency • Development of alternative and renewable energy sources • Reduction in solid and liquid waste • Shifting to low-emission transportation mode Russian 15-25% economy-wide cut 15-25% economy-wide cut below 1990 levels in 2020 2,005 6 4.6% Federation below 1990 levels in 2020 India Reduce emissions per unit India will endeavour to reduce the emissions intensity of its of GDP of 20-25% below GDP by 20-25% by 2020 in comparison to the 2005 level. 2005 levels by 2020 The emissions from agriculture sector will not form part of 1,866 7 4.3% the assessment of emissions intensity. Japan 25% economy-wide cut 25% economy-wide reduction below 1990 levels in 2020, below 1990 levels in 2020 which is premised on the establishment of a fair and effective with a “fair and effective” international framework in which all major economies 1,356 8 3.1% international framework participate and on agreement by those economies on ambitious targets. Canada 17% economy-wide cut below 2005 levels in 2020, 17% economy-wide emissions cut compared to 2005 levels, 804 9 1.9% to be aligned with the final to be aligned with the final economy-wide emissions target of US legislation the United States in enacted legislation. Mexico Aims at reducing its GHG • Achieve a reduction in total annual emissions of 51 emissions up to 30% with MMTCO2e by 2012. respect to the BAU scenario • Aims at reducing its GHG emissions up to 30% with 683 10 1.6% by 2020, provided the respect to the BAU scenario by 2020, provided the provision of adequate provision of adequate financial and technological financial and technological support from developed countries as part of a global
  • 4. 2005 Estimated GHG Emissions2 support. agreement. Republic of Cut national emissions 30% To reduce national greenhouse gas emissions by 30% from Korea below BAU in 2020 the business-as-usual emissions by 2020 (~%4 below 2005 569 11 1.3% levels) Australia 5-25% economy-wide cut Australia will reduce its greenhouse gas emissions by 25% on below 2000 levels in 2020 2000 levels by 2020 if the world agrees to an ambitious global deal capable of stabilising levels of greenhouse gases in the atmosphere at 450 ppm CO2-eq or lower. Australia will unconditionally reduce our emissions by 5% below 2000 levels by 2020, and by up to 15% by 2020 if there is a global 559 12 1.3% agreement which falls short of securing atmospheric stabilisation at 450 ppm CO2-eq and under which major developing economies commit to substantially restrain emissions and advanced economies take on commitments comparable to Australia's. South Africa 34% cut below BAU by 34% deviation below the BAU emissions growth trajectory 2020 and 42% below BAU by 2020 and a 42% deviation below the BAU emissions 423 18 1.0% by 2025 trajectory by 2025 Kazakhstan 15% economy-wide 15% economy-wide reduction in emission below 1992 levels reduction in emission below in 2020 206 29 0.5% 1992 levels in 2020 Israel 20% reduction of GHG Strive for target of 20% reduction of GHG emissions by 2020 emissions by 2020 below below BAU. Main actions for achieving reduction target BAU. include: 82 52 0.2% • 10% renewable energy for electricity generation by 2020 • 20% reduction of electricity consumption by 2020
  • 5. 2005 Estimated GHG Emissions2 New Zealand 10-20% economy-wide cut New Zealand is prepared to take on a responsibility target for below 1990 levels in 2020, greenhouse gas emissions reductions of between 10 per cent as a part of global and 20 per cent below 1990 levels by 2020, if there is a agreement comprehensive global agreement. This means: • the global agreement sets the world on a pathway to limit temperature rise to not more than 2° C; • developed countries make comparable efforts to those of New Zealand; 79 53 0.2% • advanced and major emitting developing countries take action fully commensurate with their respective capabilities; • there is an effective set of rules for land use, land-use change and forestry (LULUCF); and • there is full recourse to a broad and efficient international carbon market Ethiopia Listed a variety of national Listed a variety of national actions, including: actions • Hydro, wind, geothermal, off-grid renewables, and biofuels • Reforestation, reduced deforestation, and reduced forest 74 54 0.2% degradation • Waste management Morocco Listed a variety of national Listed a variety of national actions, including: actions • Install new renewable energy capacity: 300MW of micro-hydro power by 2030; 40 MW of hydro by 2013; 2,000 MW of solar power between 2015-2020; and 5,000 MW wind power by 2030 • Install 870 MW of combined cycle generation plants 61 61 0.1% • Promote improved energy efficiency through efficient lighting and effiency labeling • Strengthen vehicle technical standards, modernize vehicle fleets through subsidies, promote train and urban transport systems
  • 6. 2005 Estimated GHG Emissions2 • Develop wind energy and energy efficiency by industrial sector partners • Recovery of methane and other greenhouse gas emissions • Treatment of 80%-90% of waste water by 2020-2030 • Improve agricultural yield • Reforest 1 million hectares by 2030 Norway 30-40% economy-wide cut 30-40% economy-wide cut below 1990 levels in 2020. As below 1990 levels in 2020 part of a global and comprehensive agreement for the period beyond 2012 where major emitting Parties agree on 52 64 0.12% emissions reductions in line with the 2 degrees Celsius target, Norway will move to a level of 40% reduction for 2020. Singapore Reduction in GHG Reduction of GHG emissions 16% below BAU levels in emissions by 16%, below 2020, contingent on a legally binding global agreement in BAU which all countries implement their commitments in good 48 65 0.11% faith. Madagascar Listed a variety of national Listed a variety of national actions, including: actions • Developing renewable energy including hydropower, solar, wind, and biomass • Improving and reducing fuel wood use and increasing use of efficient lighting 31 75 0.07% • Implementing reforestation, restoration and biodiversity protection activities • Increasing use of biofuels and sustainable transport. Croatia 5% economy-wide cut Cut economy-wide emissions to 5% below 1990 levels. below 1990 levels in 2020 Temporary target for Croatia. Upon the accession of Croatia to the European Union, the Croatian target shall be replaced 31 77 0.07% by arrangement in line with and part of the European Union mitigation effort.
  • 7. 2005 Estimated GHG Emissions2 Mongolia Listed a variety of national Listed a variety of national actions, including: actions • Increasing PV, solar, and wind utilization 30 78 0.07% • Improving energy efficiency Jordan Listed a variety of national Listed a variety of national actions, including: actions • Railway, light rail, and freight modernization • Removed customs and taxes on energy saving technologies • Energy efficiency programs 23 84 0.05% • Adoption of renewable energy law • Solid waste management • Improved farming practices Republic of Listed a variety of national Listed a variety of national actions, including: Congo actions • Increasing energy efficiency, boosting hydroelectric potential and improving electric distribution infrastructure • Developing REDD activities, sustainable forestry management, forest certification and cogeneration from 17 95 0.04% value added forest concessions. • Developing municipal waste management plans. • Adopting agricultural production better suited to climate variability and increasing use of nitrogen fixing species. Moldova Listed a variety of national A reduction of no less than 25% of the base year (1990) level actions total national GHG emissions have to be achieved by 2020 year through implementation of global economical 13 99 0.03% mechanisms focused on the climate change mitigation, in accordance with the Convention's principles and provisions.
  • 8. 2005 Estimated GHG Emissions2 Macedonia Listed a variety of national Listed a variety of national actions, including: actions • Increasing the share of renewables in the energy sector • Improvement of energy efficiency 11 104 0.03% • Industrial energy transformation • Improvements of public and urban transport Costa Rica Carbon neutral by 2021 Long term economy-wide transformational effort to enable (with int’l assistance) carbon-neutrality that will help the country to significantly deviate from business as usual GHG emissions projected 10 108 0.02% scenarios from now on up to 2021 and beyond Armenia Listed a variety of national Listed a variety of national actions, including: actions • Increasing renwable energy use 7.4 115 0.02% • Improving energy efficiency • Expansion of electrical transport Togo Listed a variety of national actions, including: • Increase forest cover from 7% of land surface in 2005 to 30% by 2050 • Boost urban and rural energy efficiency 6 119 0.01% • Improve use of traditional energy sources like biomass and carbon • Promote solar, wind, biogas and biofuel energy Sierra Leone Listed a variety of national Listed a variety of national actions, including: actions • Establishment of protected area reserves and improve 4 125 0.01% forest governance • Expanding clean energy utilization Maldives Achieve carbon neutrality Achieve carbon neutrality as a country by 2020 0.7 140 >0.01% by 2020 Marshall 40% CO2 reduction from 40% reduction of CO2 emissions below 2009 levels by 2020, Islands 2009 levels by 2020, subject pursuant to the 2009 National Energy Policy and Energy to assistance Action Plan, and with subject to the provision of adequate n/a n/a n/a international support
  • 9. 2005 Estimated GHG Emissions2 Bhutan Remain carbon neutral Ensure that emissions don’t exceed their sequestration capacity. n/a n/a n/a (1) Click on the blue hyperlink for the official country letter. All country submissions of actions are available at: http://unfccc.int/home/items/5265.php (2) Source: World Resources Institute, Climate Analysis Indicator Tool (CAIT), available at: http://cait.wri.org/. All values are from 2005 emissions data. Values include all six greenhouse gases and emissions and sequestration from land-use, land-use change, and forestry.