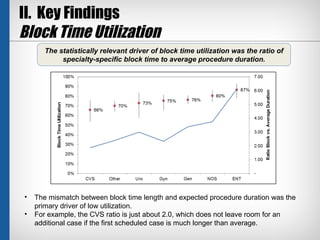
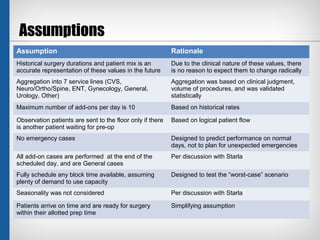
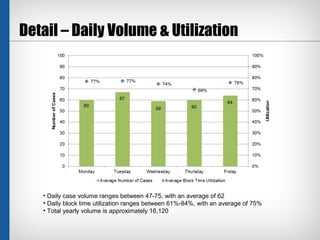
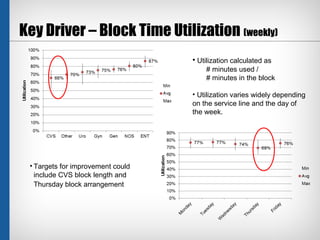
Pre/Post OR Bed Utilization
            Case Study
        Brittany Hagedorn

           2/29/2013
Agenda
I. Scenario Scope
II. Key Findings
III. Operating Alternatives
I. Scenario Scope
     The original project objective was to understand the implications on
   inpatient floors of an overflow policy that would be used to manage post-
   surgery observation patients. Based on the simulation results, the scope
       quickly expanded to address anticipated bed capacity shortages.
II. Key Findings
Original Scope Results
    Based on expected patient volumes, all three scenarios resulted in concerns
       about OR delays, as well as the need for additional observation beds.


             Scenario Outcomes                     Observations to Floor
                                        Full
               2012        2017       Schedule
 Patient
              15,031      15,911       16,120
 Volume
Days with
                67%         75%         77%
 Delays

Patients
               6 daily     9 daily    10 daily
Delayed

# Patients
              1.3 daily   2.0 daily   2.1 daily
 to Floor
II. Key Findings
Patient Delays
        By utilizing labels and a robust set of information store spreadsheets,
        we were able to export patient-level detail that allowed us to conduct a
                      like-real-life analysis on the causes of delays.


                                                         Minutes per Delay


                   Patients


•   Delays are not consistent across days of the week, which suggested that there were
    specific scheduling issues causing delays.
•   Based on an analysis of variance (ANOVA), same-day volumes for two specialties and
    observation patient carry-over were determined to be the key drivers.
II. Key Findings
Operational Implications – Sample Day
    By simulating each day individually, we were able to uncover the cause of
   delays. As patients exited the OR, they utilized an increasing proportion of
   the available beds, preventing new patients from being prepped for the OR.


                                                         Pre/Post Beds in Use


                                                         ORs in Use


   The ORs in use has a bimodal shape because the pre/post bed shortage caused delays in
   patients being prepped for their procedure. The second surge in volumes represents
   delayed patients finally getting through pre-op into the OR.
II. Key Findings
Block Time Utilization
       The statistically relevant driver of block time utilization was the ratio of
            specialty-specific block time to average procedure duration.


•   The mismatch between block time length and expected procedure duration was the
    primary driver of low utilization.
•   For example, the CVS ratio is just about 2.0, which does not leave room for an
    additional case if the first scheduled case is much longer than average.
III. Operating Alternatives
Pre-Admission Testing
  Option 1: Reclaim the 4 preadmission testing rooms for pre/post patient care.


There was a potential trade-off between the   The ideal number of pre/post patient beds
number of pre/post beds and OR delays.        is dependent on risk tolerance.
III. Operating Alternatives
Observation Patient Assignment
Option 2: Release an increased number of observation patients to an inpatient floor.


             There was a potential trade-off between observation patients
                transferred to an inpatient floor and expected delays.
Appendix
Assumptions
Assumption                                                 Rationale
Historical surgery durations and patient mix is an         Due to the clinical nature of these values, there
accurate representation of these values in the future      is no reason to expect them to change radically
Aggregation into 7 service lines (CVS,                     Aggregation was based on clinical judgment,
Neuro/Ortho/Spine, ENT, Gynecology, General,               volume of procedures, and was validated
Urology, Other)                                            statistically
Maximum number of add-ons per day is 10                    Based on historical rates

Observation patients are sent to the floor only if there   Based on logical patient flow
is another patient waiting for pre-op
No emergency cases                                         Designed to predict performance on normal
                                                           days, not to plan for unexpected emergencies
All add-on cases are performed at the end of the           Per discussion with Starla
scheduled day, and are General cases
Fully schedule any block time available, assuming          Designed to test the “worst-case” scenario
plenty of demand to use capacity
Seasonality was not considered                             Per discussion with Starla

Patients arrive on time and are ready for surgery          Simplifying assumption
within their allotted prep time
Detail – Block Time Utilization by OR
                                                                                            Yearly utilization calculated
                                                                                            based on 260 12-hour days
                                                                                            per year


• There is potential to increase OR capacity by focusing on improving utilization of:
       • ORs 1-3: underutilized due to their CVS specialty
       • OR 7: underutilized due to the block time being broken up between services
       • OR 14: not currently scheduled to be open every day
* Note: OR9 seems to have more than 100% because the calculation is based on a 12 hour day and OR9 has Add-On cases that run past scheduling
Detail – Daily Volume & Utilization


   • Daily case volume ranges between 47-75, with an average of 62
   • Daily block time utilization ranges between 61%-84%, with an average of 75%
   • Total yearly volume is approximately 16,120
Detail – Volume Breakdown
     Average Volume by Service Line                       Average Volume by Patient Type


 • Outpatient is the largest patient type
 • General is the largest service line (driven by assumption that add-ons are general cases)
 • Note: Case volume is not equivalent to hours of OR utilization
Key Driver – Block Time Utilization (weekly)
                                   • Utilization calculated as
                                       # minutes used /
                                       # minutes in the block

                                   • Utilization varies widely depending
                                   on the service line and the day of
                                   the week.


 • Targets for improvement could
   include CVS block length and
   Thursday block arrangement
Operational Alternative – Family use Waiting Room

                              Family Remains in Pre/Post    Family Stays in Waiting Room
                                Room during Surgery                during Surgery

     % Days with Delays                  77%                             45%
                                        10 daily                         1 daily
     # Patients Delayed
                                     (2,647 yearly)                   (287 yearly)
   # Observation Patients                2 daily
                                                                        0 yearly
          to Floor                     417 yearly


  • Option 3: Ask family to stay in the general waiting room during surgery in order to
  reclaim the pre/post room for the next patient

  • Risks:
       • Simulation does not account for pre/post room turnover time, which will use
       up some of the recovered time and reduce the actual impact of this change
       • This change would increase the need for seating in the general waiting room,
       which may not have enough capacity

Improving Healthcare with Simulation - Pre/Post OR Bed Utilization

  • 1.
    Pre/Post OR BedUtilization Case Study Brittany Hagedorn 2/29/2013
  • 2.
    Agenda I. Scenario Scope II.Key Findings III. Operating Alternatives
  • 3.
    I. Scenario Scope The original project objective was to understand the implications on inpatient floors of an overflow policy that would be used to manage post- surgery observation patients. Based on the simulation results, the scope quickly expanded to address anticipated bed capacity shortages.
  • 4.
    II. Key Findings OriginalScope Results Based on expected patient volumes, all three scenarios resulted in concerns about OR delays, as well as the need for additional observation beds. Scenario Outcomes Observations to Floor Full 2012 2017 Schedule Patient 15,031 15,911 16,120 Volume Days with 67% 75% 77% Delays Patients 6 daily 9 daily 10 daily Delayed # Patients 1.3 daily 2.0 daily 2.1 daily to Floor
  • 5.
    II. Key Findings PatientDelays By utilizing labels and a robust set of information store spreadsheets, we were able to export patient-level detail that allowed us to conduct a like-real-life analysis on the causes of delays. Minutes per Delay Patients • Delays are not consistent across days of the week, which suggested that there were specific scheduling issues causing delays. • Based on an analysis of variance (ANOVA), same-day volumes for two specialties and observation patient carry-over were determined to be the key drivers.
  • 6.
    II. Key Findings OperationalImplications – Sample Day By simulating each day individually, we were able to uncover the cause of delays. As patients exited the OR, they utilized an increasing proportion of the available beds, preventing new patients from being prepped for the OR. Pre/Post Beds in Use ORs in Use The ORs in use has a bimodal shape because the pre/post bed shortage caused delays in patients being prepped for their procedure. The second surge in volumes represents delayed patients finally getting through pre-op into the OR.
  • 7.
    II. Key Findings BlockTime Utilization The statistically relevant driver of block time utilization was the ratio of specialty-specific block time to average procedure duration. • The mismatch between block time length and expected procedure duration was the primary driver of low utilization. • For example, the CVS ratio is just about 2.0, which does not leave room for an additional case if the first scheduled case is much longer than average.
  • 8.
    III. Operating Alternatives Pre-AdmissionTesting Option 1: Reclaim the 4 preadmission testing rooms for pre/post patient care. There was a potential trade-off between the The ideal number of pre/post patient beds number of pre/post beds and OR delays. is dependent on risk tolerance.
  • 9.
    III. Operating Alternatives ObservationPatient Assignment Option 2: Release an increased number of observation patients to an inpatient floor. There was a potential trade-off between observation patients transferred to an inpatient floor and expected delays.
  • 10.
  • 11.
    Assumptions Assumption Rationale Historical surgery durations and patient mix is an Due to the clinical nature of these values, there accurate representation of these values in the future is no reason to expect them to change radically Aggregation into 7 service lines (CVS, Aggregation was based on clinical judgment, Neuro/Ortho/Spine, ENT, Gynecology, General, volume of procedures, and was validated Urology, Other) statistically Maximum number of add-ons per day is 10 Based on historical rates Observation patients are sent to the floor only if there Based on logical patient flow is another patient waiting for pre-op No emergency cases Designed to predict performance on normal days, not to plan for unexpected emergencies All add-on cases are performed at the end of the Per discussion with Starla scheduled day, and are General cases Fully schedule any block time available, assuming Designed to test the “worst-case” scenario plenty of demand to use capacity Seasonality was not considered Per discussion with Starla Patients arrive on time and are ready for surgery Simplifying assumption within their allotted prep time
  • 12.
    Detail – BlockTime Utilization by OR Yearly utilization calculated based on 260 12-hour days per year • There is potential to increase OR capacity by focusing on improving utilization of: • ORs 1-3: underutilized due to their CVS specialty • OR 7: underutilized due to the block time being broken up between services • OR 14: not currently scheduled to be open every day * Note: OR9 seems to have more than 100% because the calculation is based on a 12 hour day and OR9 has Add-On cases that run past scheduling
  • 13.
    Detail – DailyVolume & Utilization • Daily case volume ranges between 47-75, with an average of 62 • Daily block time utilization ranges between 61%-84%, with an average of 75% • Total yearly volume is approximately 16,120
  • 14.
    Detail – VolumeBreakdown Average Volume by Service Line Average Volume by Patient Type • Outpatient is the largest patient type • General is the largest service line (driven by assumption that add-ons are general cases) • Note: Case volume is not equivalent to hours of OR utilization
  • 15.
    Key Driver –Block Time Utilization (weekly) • Utilization calculated as # minutes used / # minutes in the block • Utilization varies widely depending on the service line and the day of the week. • Targets for improvement could include CVS block length and Thursday block arrangement
  • 16.
    Operational Alternative –Family use Waiting Room Family Remains in Pre/Post Family Stays in Waiting Room Room during Surgery during Surgery % Days with Delays 77% 45% 10 daily 1 daily # Patients Delayed (2,647 yearly) (287 yearly) # Observation Patients 2 daily 0 yearly to Floor 417 yearly • Option 3: Ask family to stay in the general waiting room during surgery in order to reclaim the pre/post room for the next patient • Risks: • Simulation does not account for pre/post room turnover time, which will use up some of the recovered time and reduce the actual impact of this change • This change would increase the need for seating in the general waiting room, which may not have enough capacity